| Param | Original file | Final file |
|---|---|---|
| Filename | modeM0/AS1A02_028T01_9000000724_05599cztM0_level2.evt | modeM0/AS1A02_028T01_9000000724_05599cztM0_level2_quad_clean.evt |
| Size (bytes) | 558,504,000 | 63,123,840 |
| Size | 532.6 MB | 60.2 MB |
| Events in quadrant A | 3,325,980 | 370,081 |
| Events in quadrant B | 3,746,392 | 372,580 |
| Events in quadrant C | 3,254,653 | 364,731 |
| Events in quadrant D | 6,129,096 | 331,968 |
| Mode SS | |||
|---|---|---|---|
| Quadrant | BADHDUFLAG | Total packets | Discarded packets |
| A | 0 | 140 | 0 |
| B | 0 | 140 | 0 |
| C | 0 | 140 | 0 |
| D | 0 | 140 | 0 |
| Mode M0 | |||
|---|---|---|---|
| Quadrant | BADHDUFLAG | Total packets | Discarded packets |
| A | 0 | 14098 | 3 |
| B | 0 | 15434 | 2 |
| C | 0 | 14056 | 2 |
| D | 0 | 22906 | 2 |
| Mode M9 | |||
|---|---|---|---|
| Quadrant | BADHDUFLAG | Total packets | Discarded packets |
| A | 0 | 22 | 0 |
| B | 0 | 22 | 0 |
| C | 0 | 22 | 0 |
| D | 0 | 22 | 0 |
| Quadrant | Total seconds | Saturated seconds | Saturation percentage |
|---|---|---|---|
| A | 6763 | 147 | 2.173592% |
| B | 6763 | 166 | 2.454532% |
| C | 6763 | 106 | 1.567352% |
| D | 6763 | 209 | 3.090345% |
Noise dominated data is calculated using 1-second bins in cleaned event files. If a bin has >2000 counts, and if more than 50% of those come from <1% of pixels, then it is considered to be noise-dominated and hence unusable.
| Quadrant | # 1 sec bins | Bins with >0 counts | Bins with >2000 counts | High rate bins dominated by noise | Noise dominated (total time) | Noise dominated (detector-on time) | Marked lightcurve |
|---|---|---|---|---|---|---|---|
| A | 8948 | 6763 | 0 | 0 | 0.00% | 0.00% | 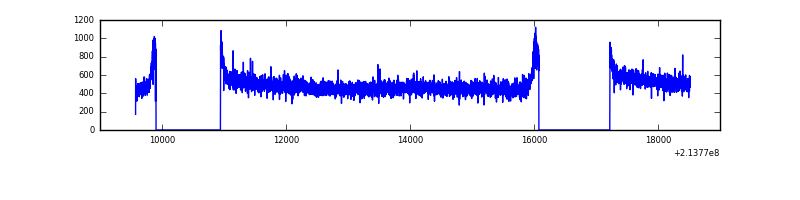 |
| B | 8948 | 6764 | 1 | 1 | 0.01% | 0.01% | 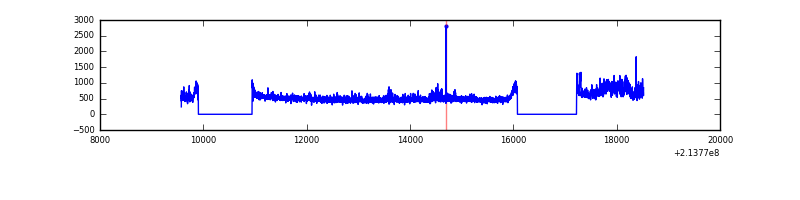 |
| C | 8948 | 6764 | 0 | 0 | 0.00% | 0.00% |  |
| D | 8948 | 6764 | 40 | 40 | 0.45% | 0.59% |  |
Top three noisy pixels from each quadrant. If the there are fewer than three noisy pixels in the level2.evt file, extra rows are filled as -1
| Pixel properties | Quadrant properties | ||||||
|---|---|---|---|---|---|---|---|
| Quadrant | DetID | PixID | Counts | Sigma | Mean | Median | Sigma |
| A | 13 | 14 | 26479 | 147.06 | 856 | 836 | 174.4 |
| A | 0 | 226 | 8377 | 43.25 | 856 | 836 | 174.4 |
| A | 12 | 194 | 8124 | 41.79 | 856 | 836 | 174.4 |
| B | 8 | 3 | 264584 | 1599.42 | 858 | 838 | 164.9 |
| B | 15 | 204 | 155438 | 937.53 | 858 | 838 | 164.9 |
| B | 12 | 111 | 15755 | 90.46 | 858 | 838 | 164.9 |
| C | 1 | 16 | 19130 | 95.61 | 824 | 828 | 191.4 |
| C | 8 | 128 | 9179 | 43.62 | 824 | 828 | 191.4 |
| C | 13 | 61 | 6609 | 30.2 | 824 | 828 | 191.4 |
| D | 2 | 63 | 2748379 | 13839.0 | 814 | 788 | 198.5 |
| D | 11 | 241 | 128566 | 643.59 | 814 | 788 | 198.5 |
| D | 2 | 136 | 114345 | 571.96 | 814 | 788 | 198.5 |
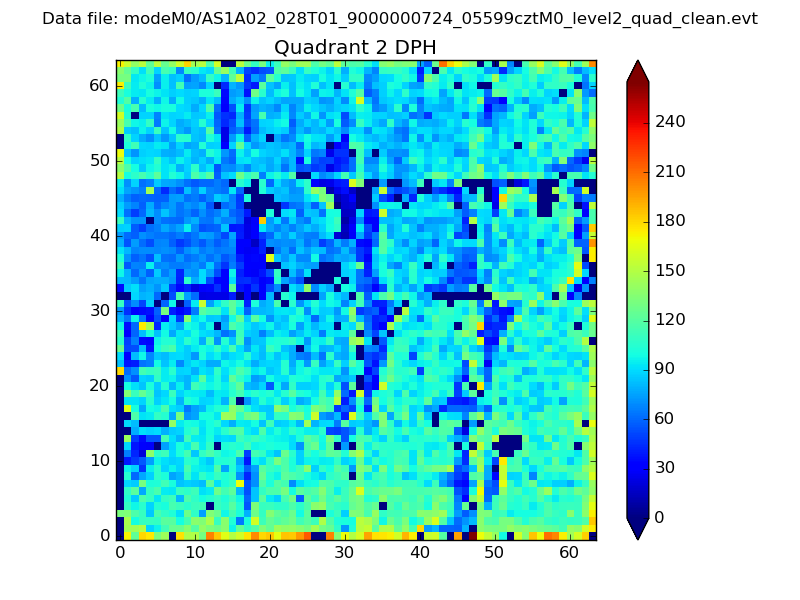
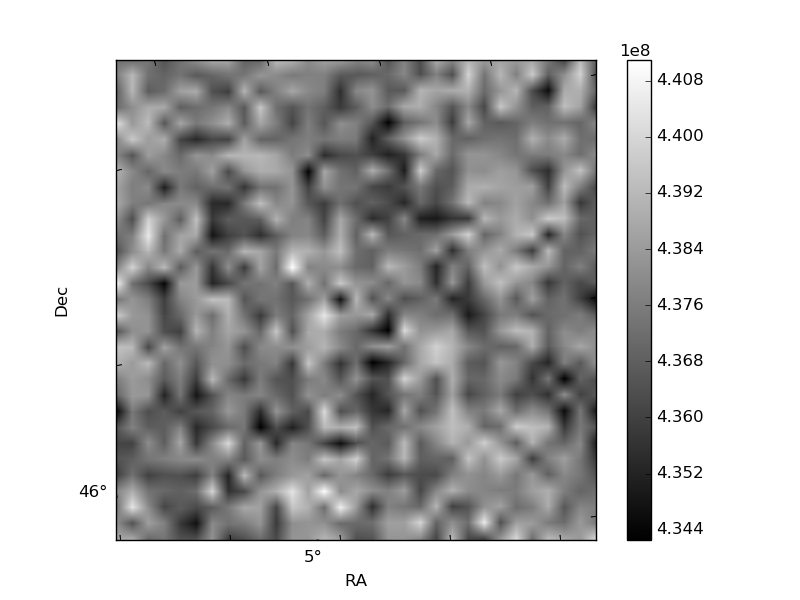
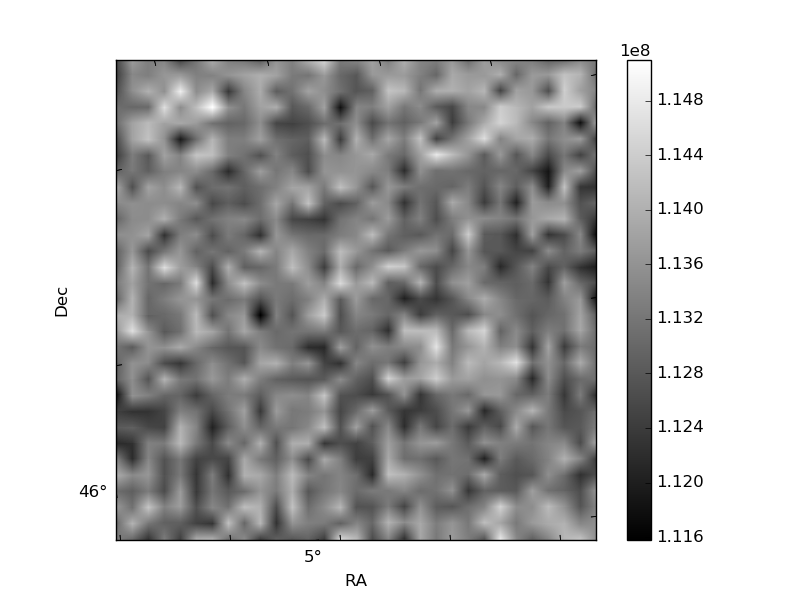
Histogram calculated using DETX and DETY for each event in the final _common_clean file
| Quadrant A | 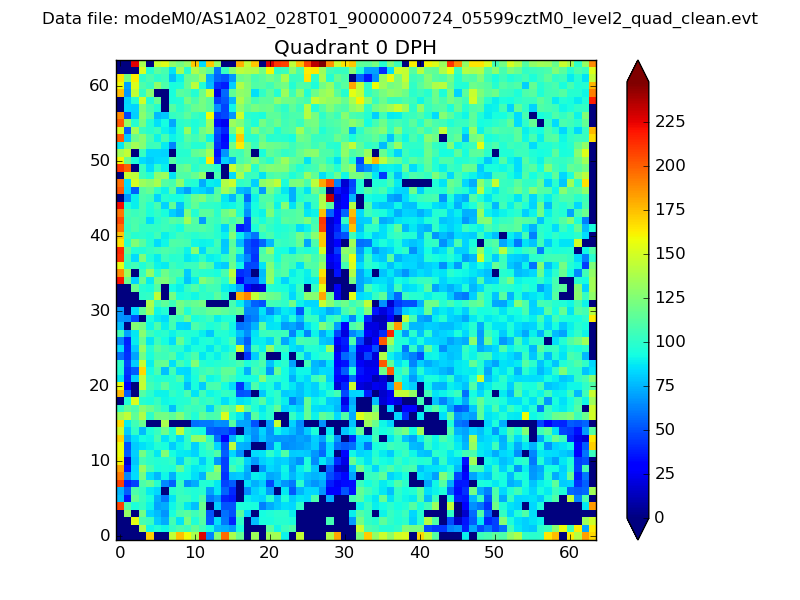 |
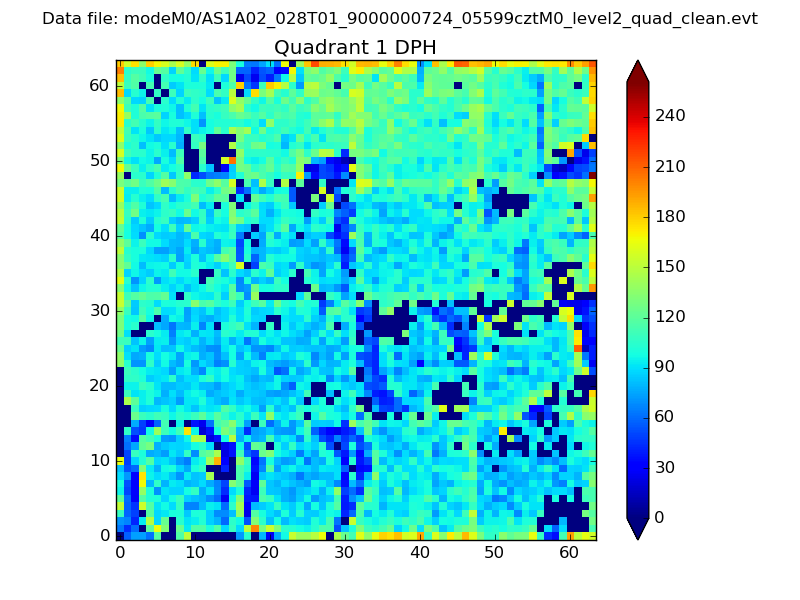 |
Quadrant B |
|---|---|---|---|
| Quadrant D | 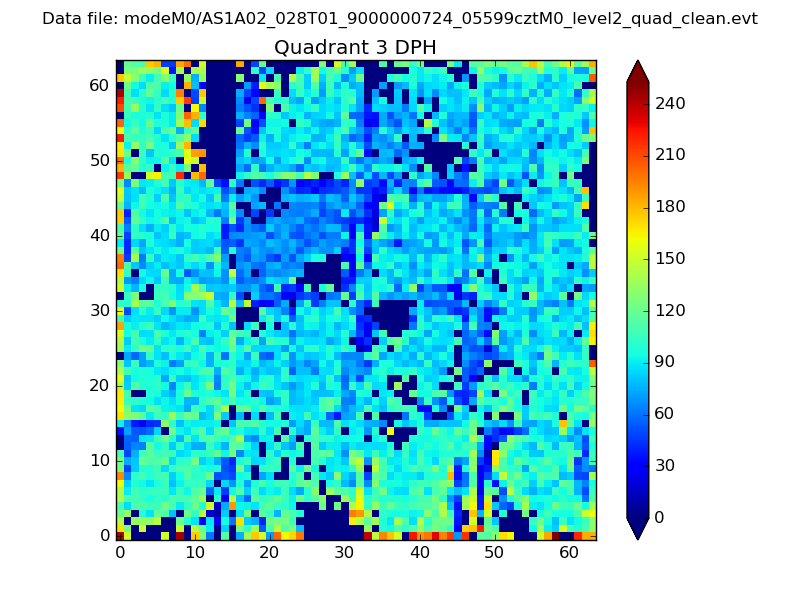 |
 |
Quadrant C |
| Plot type | Count rate plots | Images |
|---|---|---|
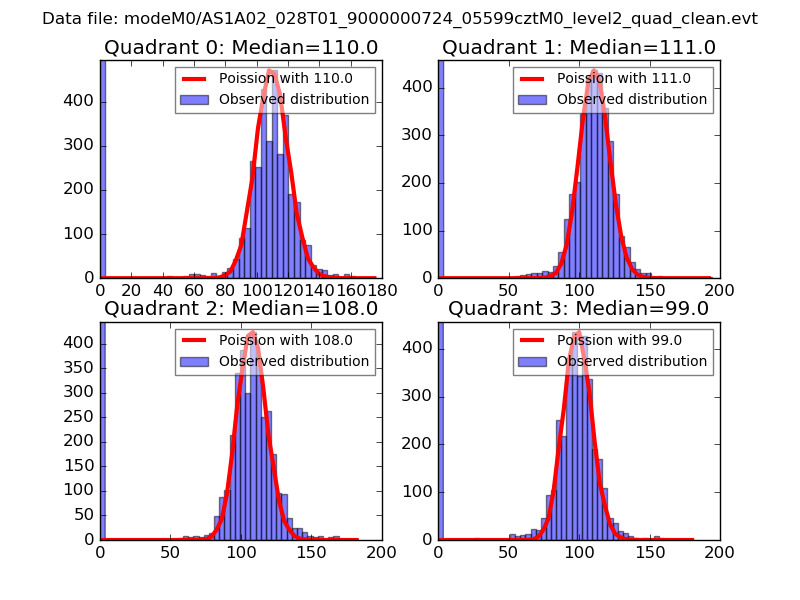
| Comparison with Poisson distribution Blue bars denote a histogram of data divided into 1 sec bins. Red curve is a Poisson curve with rate = median count rate of data. |
 |
 |
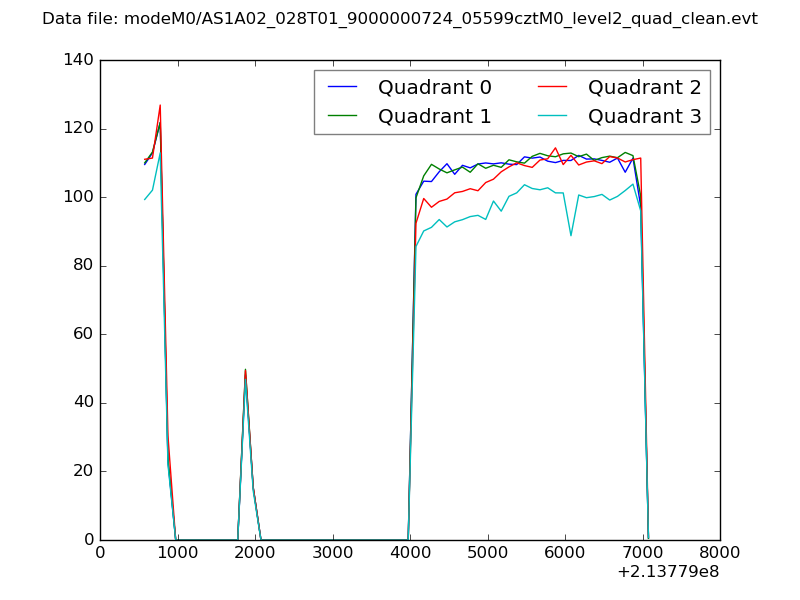
| Quadrant-wise count rates Data is divided into 100 sec bins |
 |
|
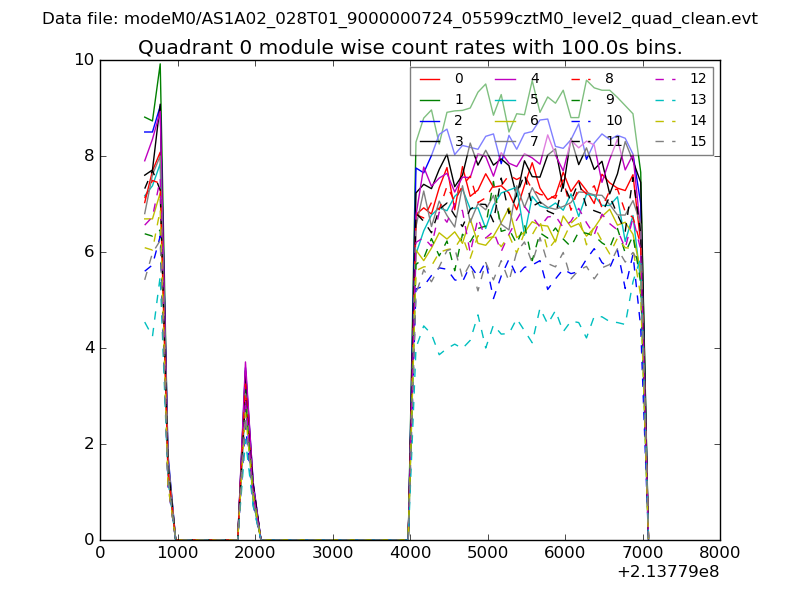
| Module-wise count rates for Quadrant A Data is divided into 100 sec bins |
 |
 |
| Module-wise count rates for Quadrant B Data is divided into 100 sec bins |
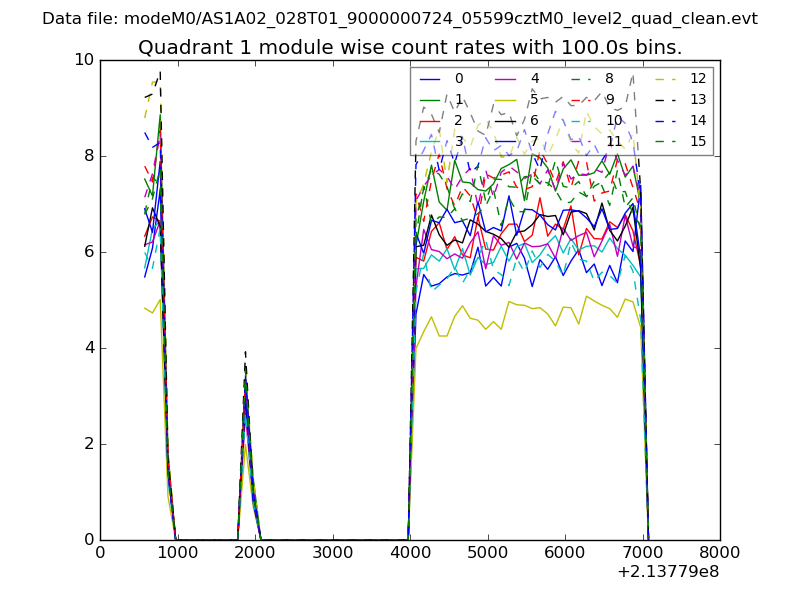 |
 |
| Module-wise count rates for Quadrant C Data is divided into 100 sec bins |
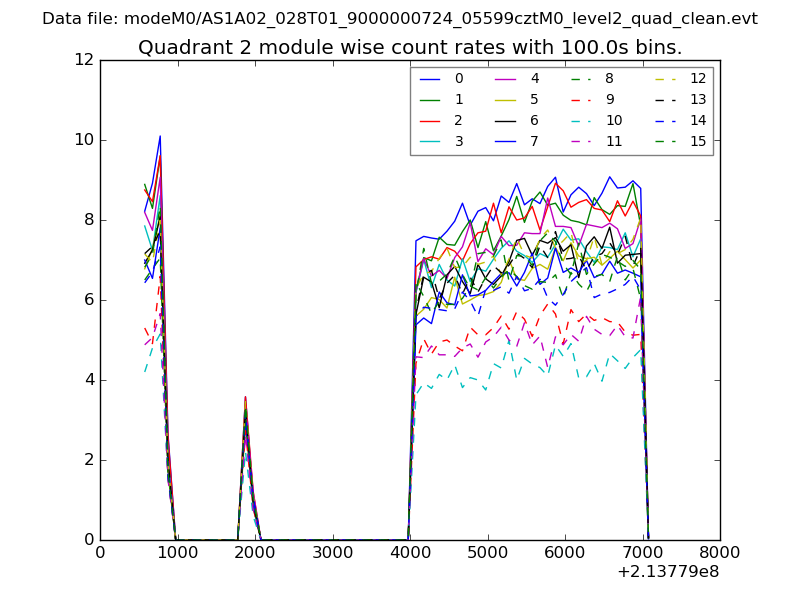 |
 |
| Module-wise count rates for Quadrant D Data is divided into 100 sec bins |
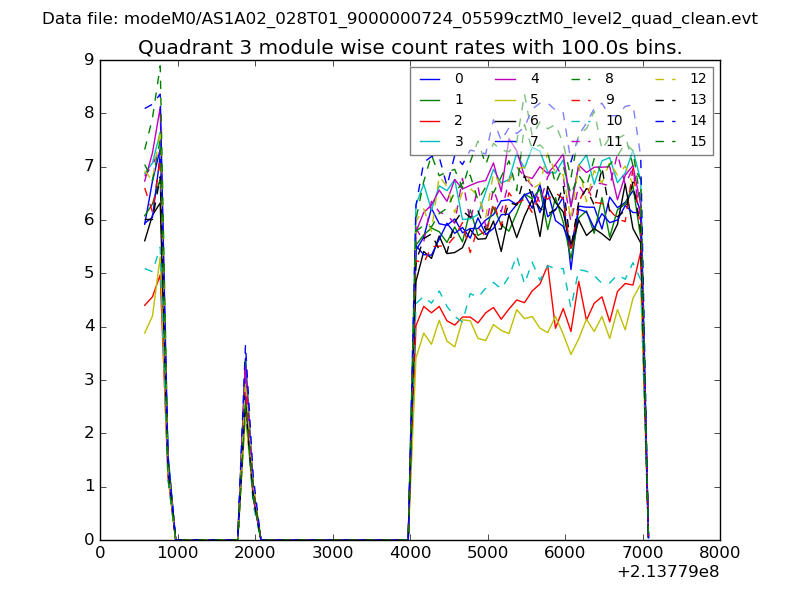 |
 |
| Parameter | Plot |
|---|---|
| CZT HV Monitor | 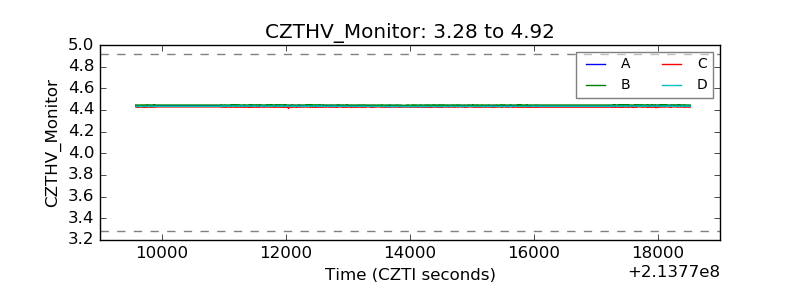 |
| D_VDD | 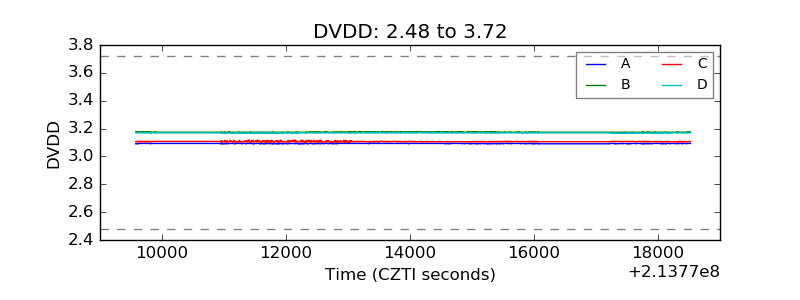 |
| Temperature 1 | 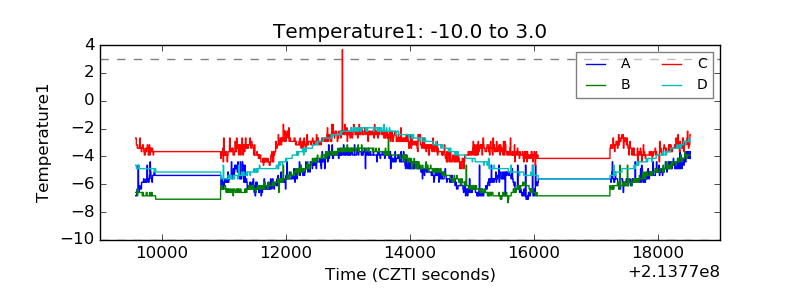 |
| Veto HV Monitor | 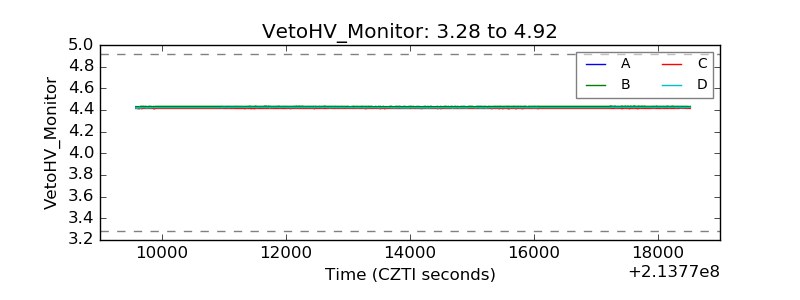 |
| Veto LLD | 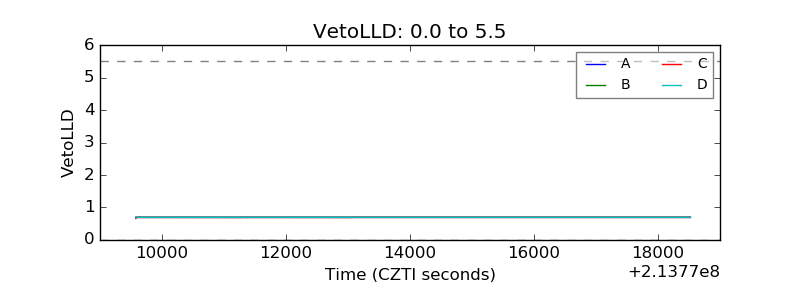 |
| Alpha Counter | 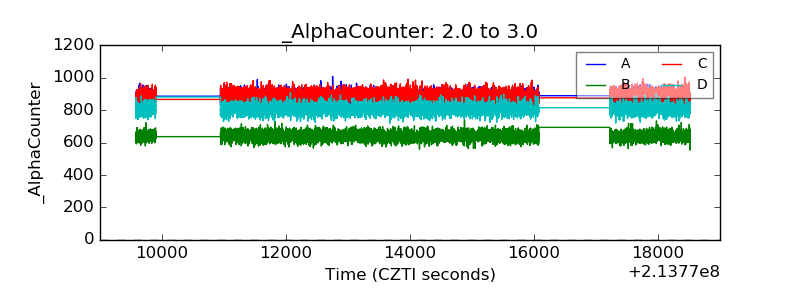 |
| _CPM_Rate | 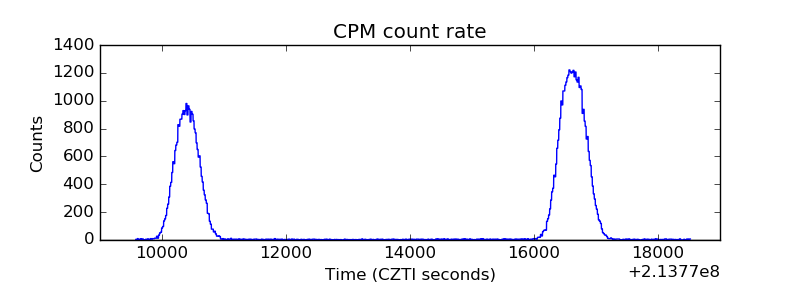 |
| CZT Counter | 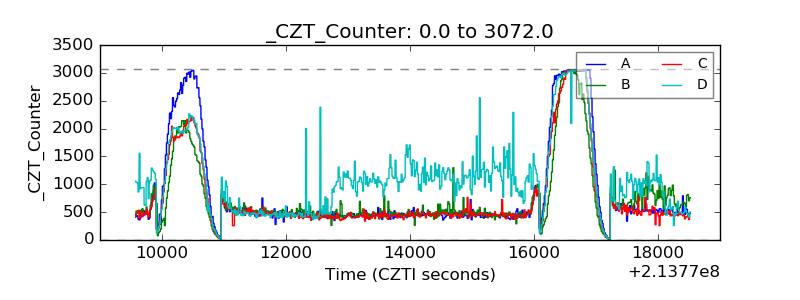 |
| +2.5 Volts monitor | 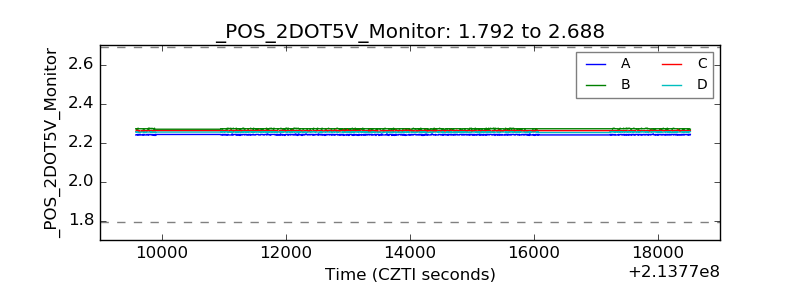 |
| +5 Volts monitor |  |
| _ROLL_ROT | 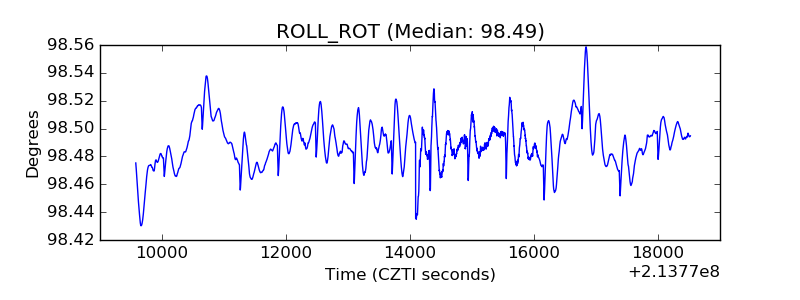 |
| _Roll_DEC | 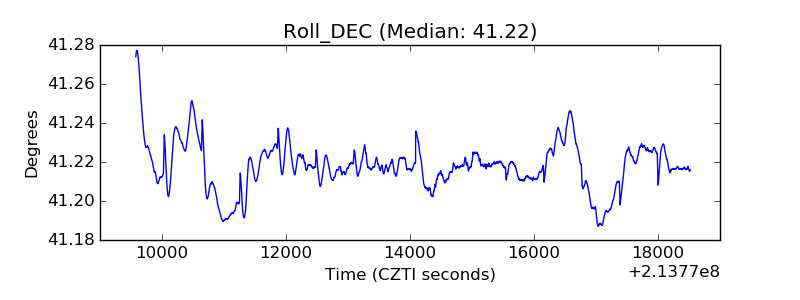 |
| _Roll_RA | 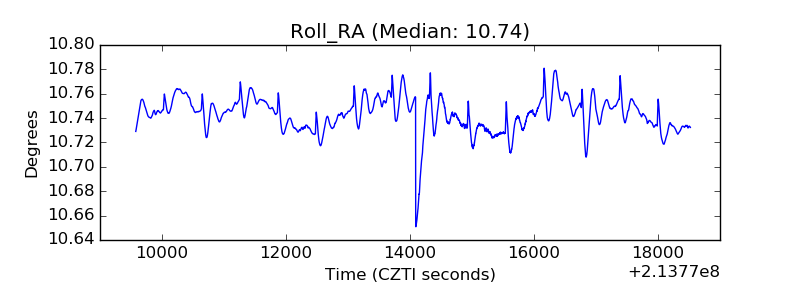 |
| Veto Counter | 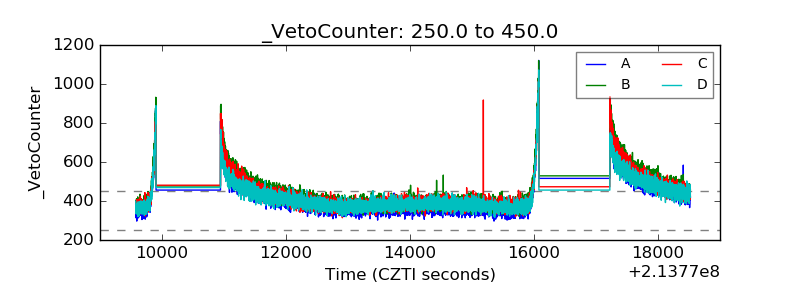 |