| Param | Original file | Final file |
|---|---|---|
| Filename | modeM0/AS1G06_060T01_9000000726_05607cztM0_level2.evt | modeM0/AS1G06_060T01_9000000726_05607cztM0_level2_quad_clean.evt |
| Size (bytes) | 591,402,240 | 98,763,840 |
| Size | 564.0 MB | 94.2 MB |
| Events in quadrant A | 3,876,371 | 611,157 |
| Events in quadrant B | 5,201,158 | 605,334 |
| Events in quadrant C | 3,865,591 | 613,991 |
| Events in quadrant D | 4,402,996 | 581,956 |
| Mode M9 | |||
|---|---|---|---|
| Quadrant | BADHDUFLAG | Total packets | Discarded packets |
| A | 0 | 6 | 0 |
| B | 0 | 6 | 0 |
| C | 0 | 6 | 0 |
| D | 0 | 6 | 0 |
| Mode SS | |||
|---|---|---|---|
| Quadrant | BADHDUFLAG | Total packets | Discarded packets |
| A | 0 | 170 | 0 |
| B | 0 | 170 | 0 |
| C | 0 | 170 | 0 |
| D | 0 | 170 | 0 |
| Mode M0 | |||
|---|---|---|---|
| Quadrant | BADHDUFLAG | Total packets | Discarded packets |
| A | 0 | 17381 | 4 |
| B | 0 | 21154 | 7 |
| C | 0 | 17276 | 3 |
| D | 0 | 18941 | 3 |
| Quadrant | Total seconds | Saturated seconds | Saturation percentage |
|---|---|---|---|
| A | 8327 | 71 | 0.852648% |
| B | 8325 | 299 | 3.591592% |
| C | 8327 | 50 | 0.600456% |
| D | 8327 | 66 | 0.792602% |
Noise dominated data is calculated using 1-second bins in cleaned event files. If a bin has >2000 counts, and if more than 50% of those come from <1% of pixels, then it is considered to be noise-dominated and hence unusable.
| Quadrant | # 1 sec bins | Bins with >0 counts | Bins with >2000 counts | High rate bins dominated by noise | Noise dominated (total time) | Noise dominated (detector-on time) | Marked lightcurve |
|---|---|---|---|---|---|---|---|
| A | 8947 | 8330 | 2 | 2 | 0.02% | 0.02% | 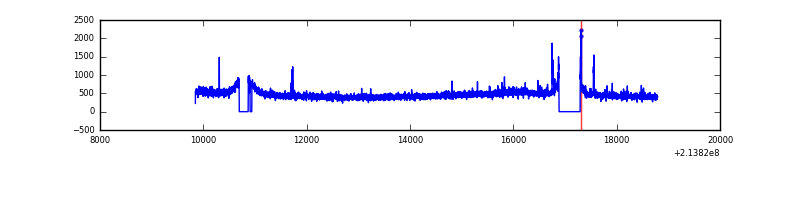 |
| B | 8947 | 8330 | 102 | 102 | 1.14% | 1.22% | 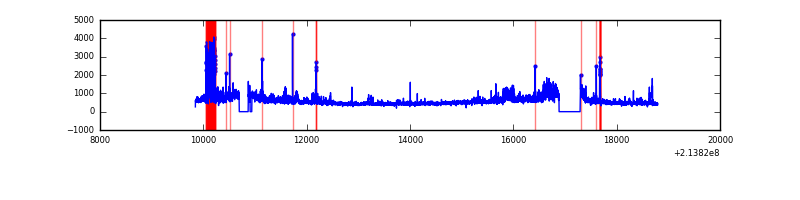 |
| C | 8947 | 8330 | 1 | 1 | 0.01% | 0.01% | 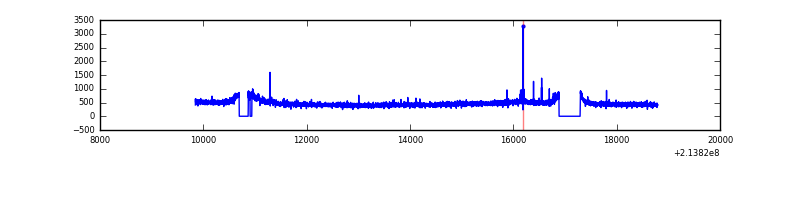 |
| D | 8947 | 8330 | 37 | 37 | 0.41% | 0.44% | 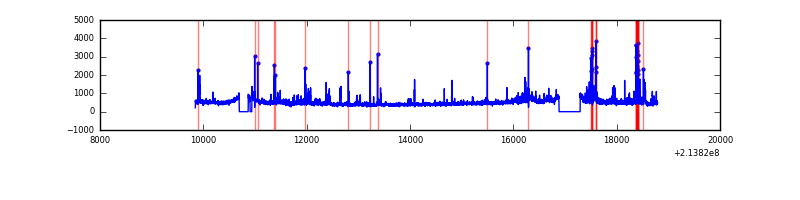 |
Top three noisy pixels from each quadrant. If the there are fewer than three noisy pixels in the level2.evt file, extra rows are filled as -1
| Pixel properties | Quadrant properties | ||||||
|---|---|---|---|---|---|---|---|
| Quadrant | DetID | PixID | Counts | Sigma | Mean | Median | Sigma |
| A | 0 | 50 | 65237 | 317.31 | 979 | 958 | 202.6 |
| A | 7 | 16 | 21363 | 100.73 | 979 | 958 | 202.6 |
| A | 12 | 194 | 9758 | 43.44 | 979 | 958 | 202.6 |
| B | 15 | 204 | 844588 | 4454.69 | 983 | 959 | 189.4 |
| B | 11 | 51 | 295059 | 1552.96 | 983 | 959 | 189.4 |
| B | 4 | 48 | 64214 | 334.01 | 983 | 959 | 189.4 |
| C | 1 | 16 | 69807 | 307.01 | 959 | 963 | 224.2 |
| C | 5 | 250 | 16260 | 68.22 | 959 | 963 | 224.2 |
| C | 8 | 128 | 14948 | 62.37 | 959 | 963 | 224.2 |
| D | 11 | 241 | 215773 | 910.86 | 956 | 926 | 235.9 |
| D | 2 | 136 | 149286 | 628.98 | 956 | 926 | 235.9 |
| D | 12 | 233 | 138110 | 581.6 | 956 | 926 | 235.9 |
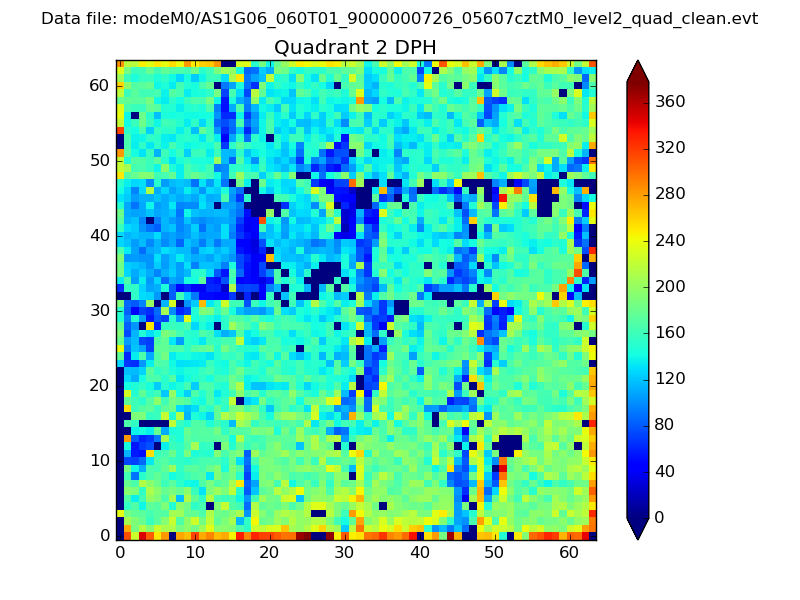
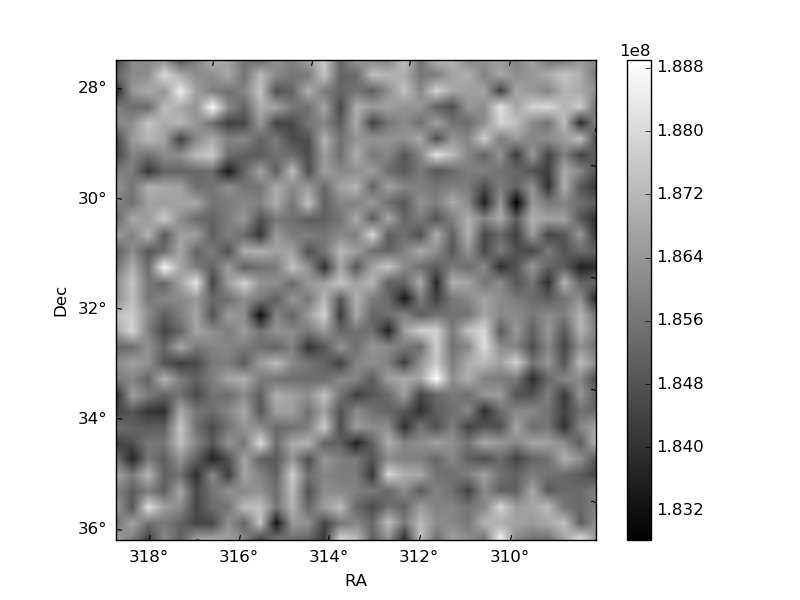
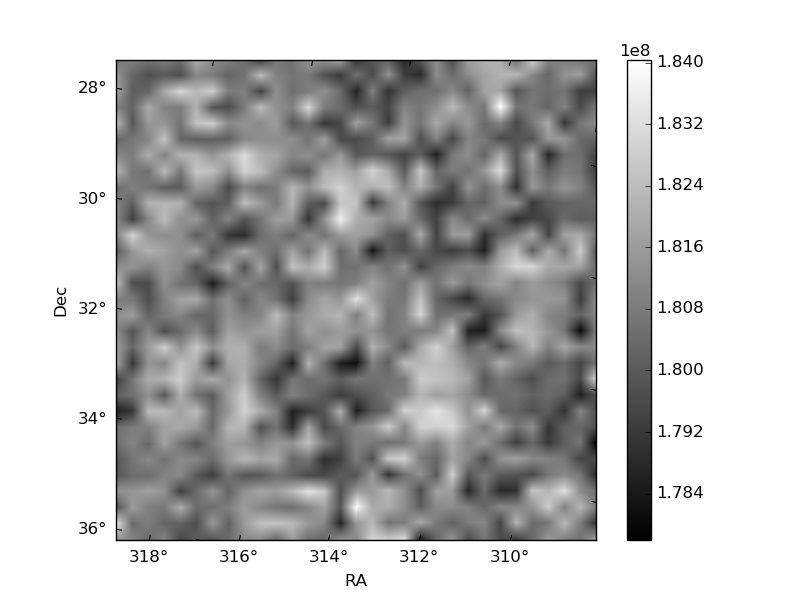
Histogram calculated using DETX and DETY for each event in the final _common_clean file
| Quadrant A | 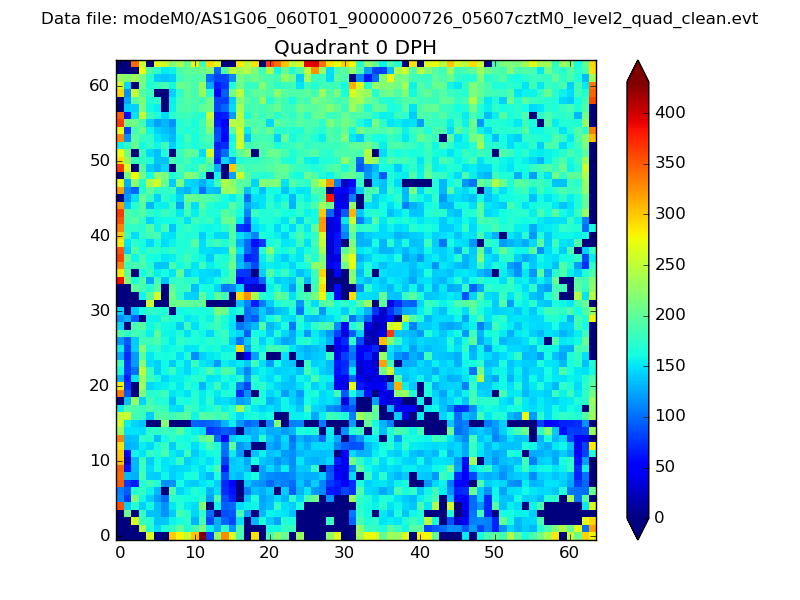 |
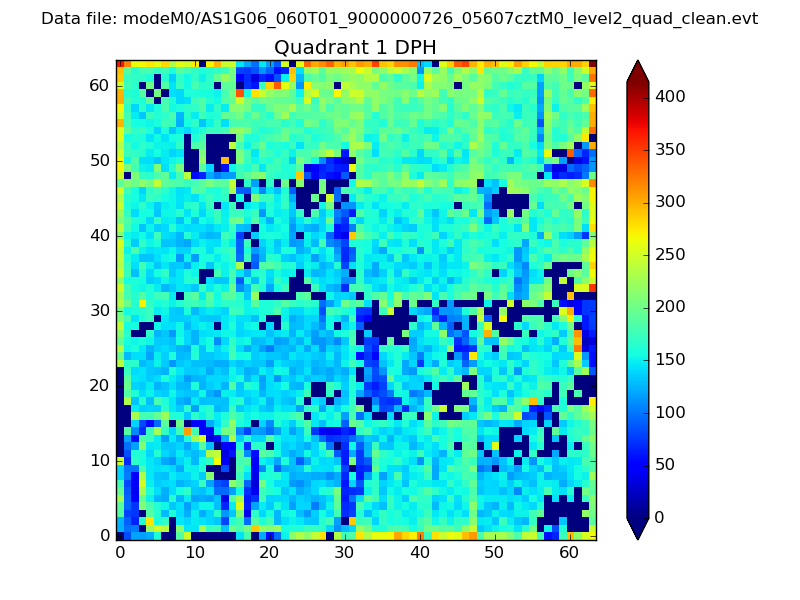 |
Quadrant B |
|---|---|---|---|
| Quadrant D | 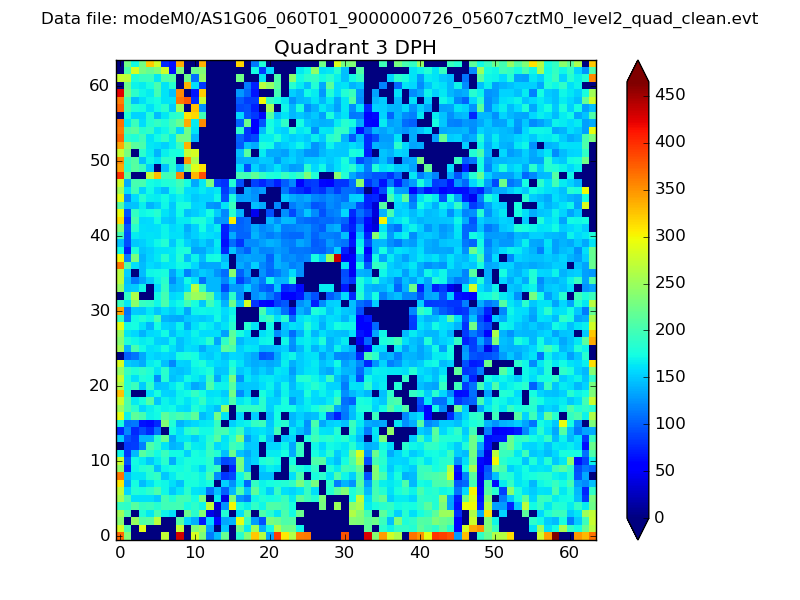 |
 |
Quadrant C |
| Plot type | Count rate plots | Images |
|---|---|---|
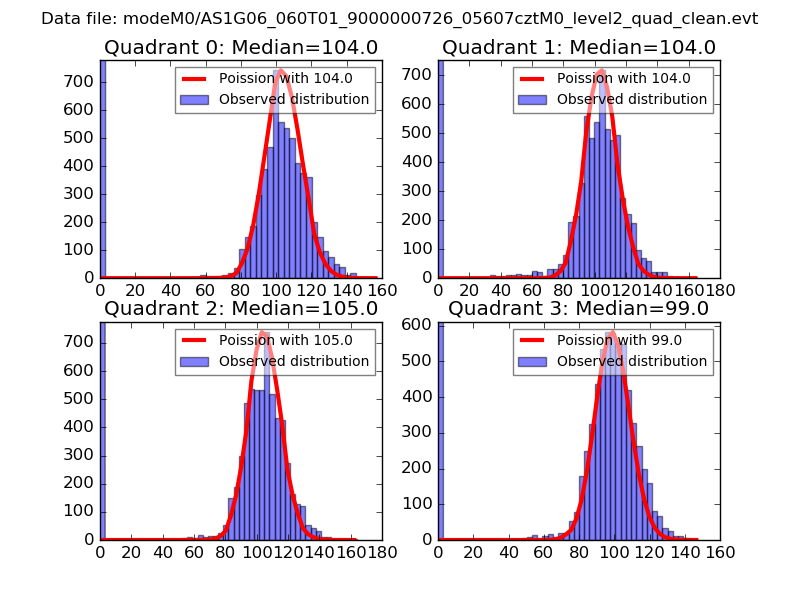
| Comparison with Poisson distribution Blue bars denote a histogram of data divided into 1 sec bins. Red curve is a Poisson curve with rate = median count rate of data. |
 |
 |
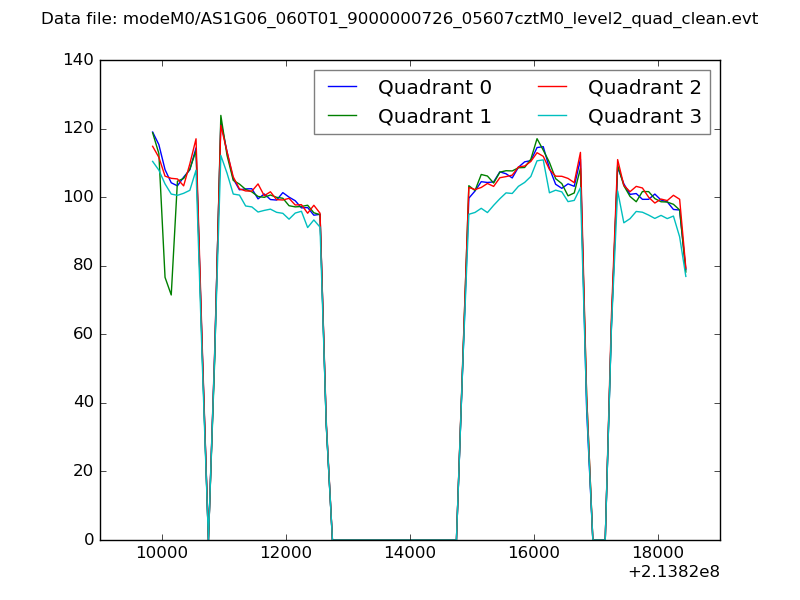
| Quadrant-wise count rates Data is divided into 100 sec bins |
 |
|
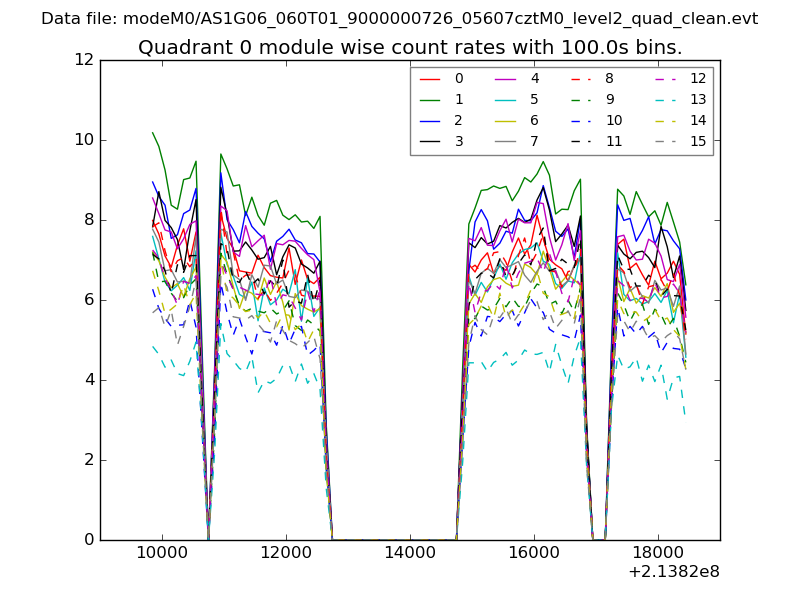
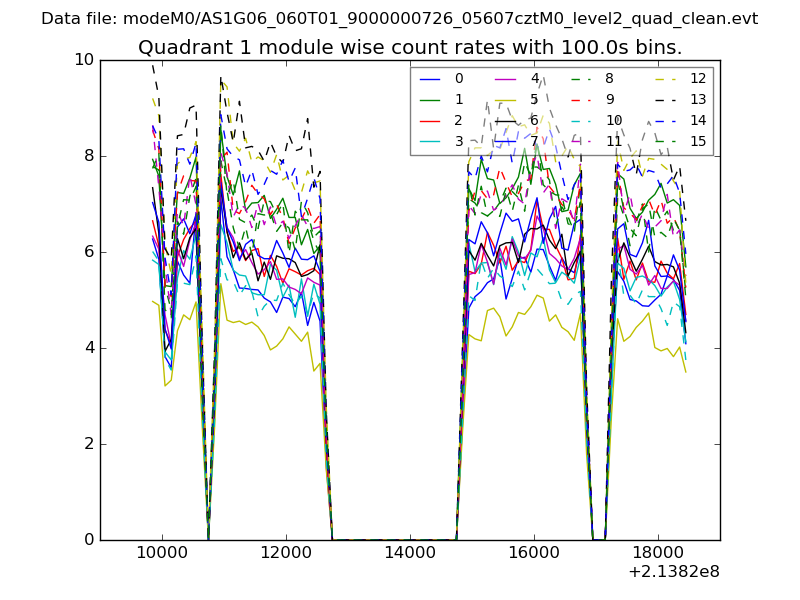
| Module-wise count rates for Quadrant A Data is divided into 100 sec bins |
 |
 |
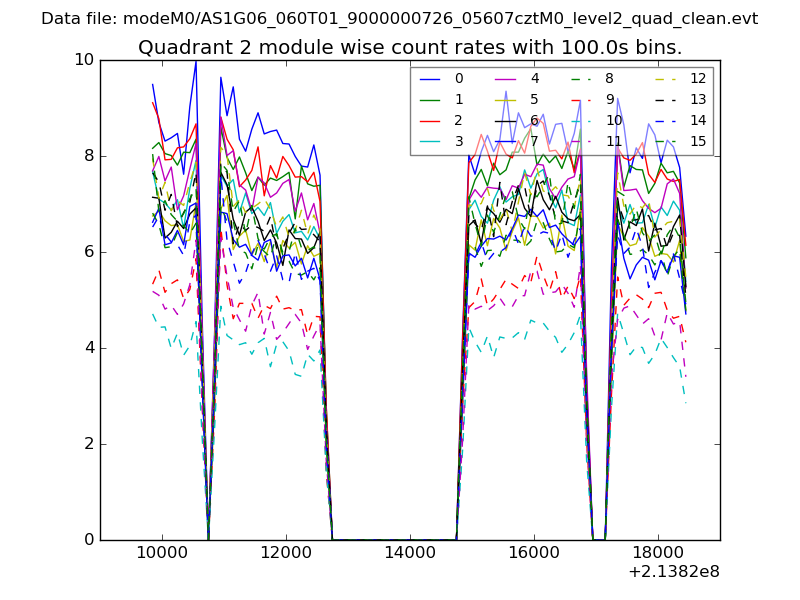
| Module-wise count rates for Quadrant B Data is divided into 100 sec bins |
 |
 |
| Module-wise count rates for Quadrant C Data is divided into 100 sec bins |
 |
 |
| Module-wise count rates for Quadrant D Data is divided into 100 sec bins |
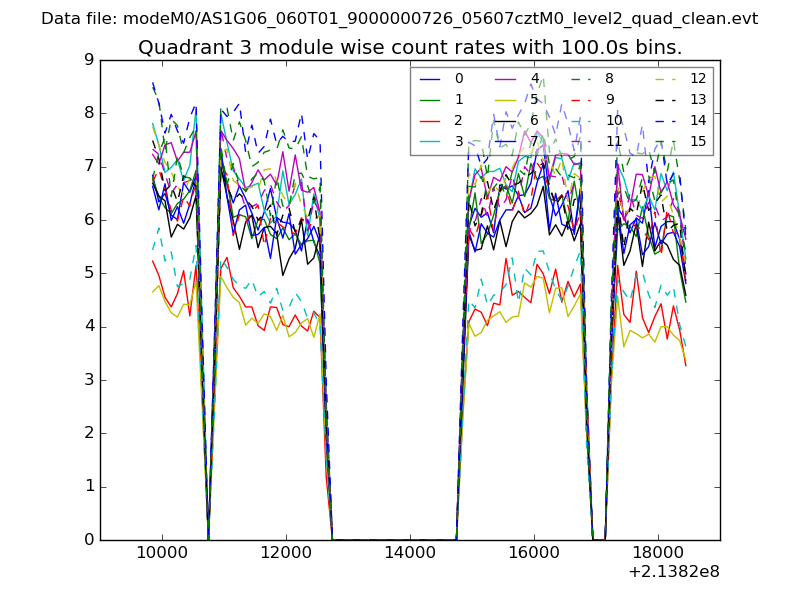 |
 |
| Parameter | Plot |
|---|---|
| CZT HV Monitor | 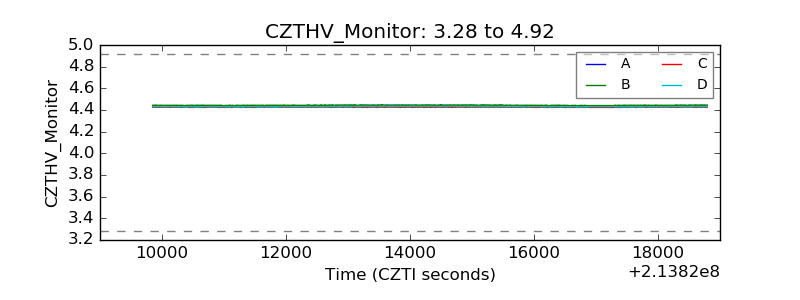 |
| D_VDD | 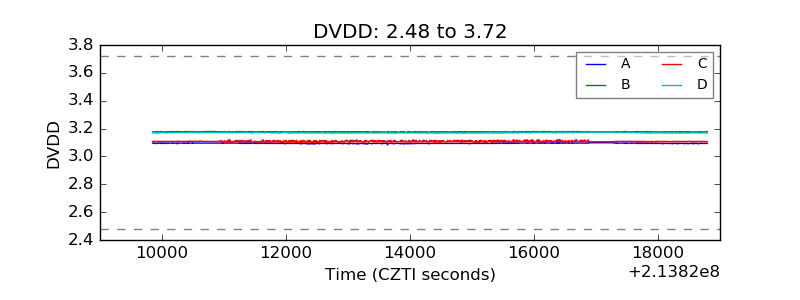 |
| Temperature 1 | 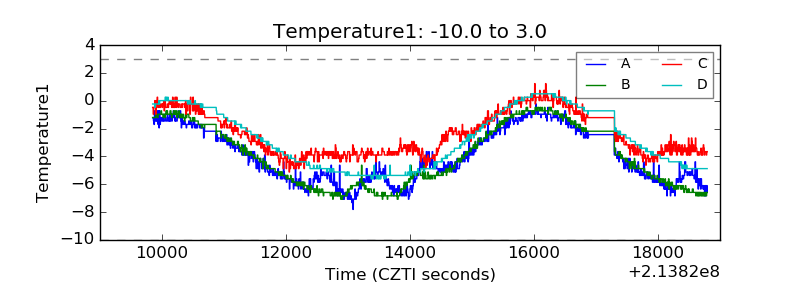 |
| Veto HV Monitor | 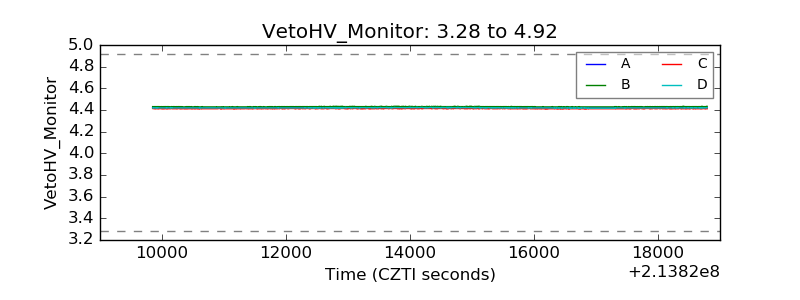 |
| Veto LLD | 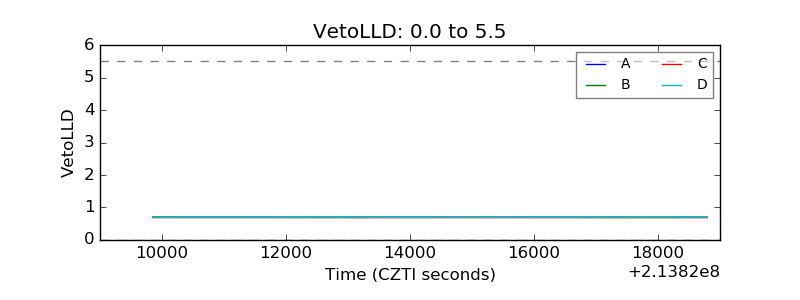 |
| Alpha Counter | 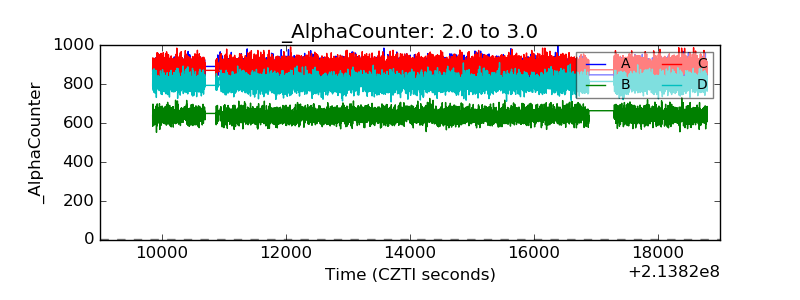 |
| _CPM_Rate | 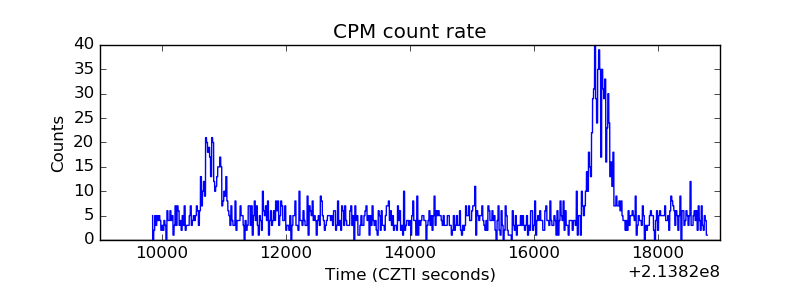 |
| CZT Counter | 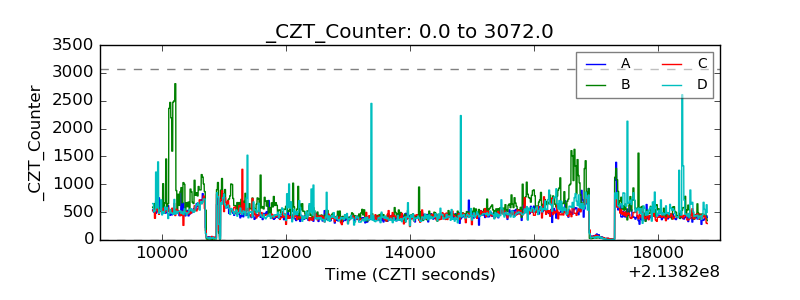 |
| +2.5 Volts monitor | 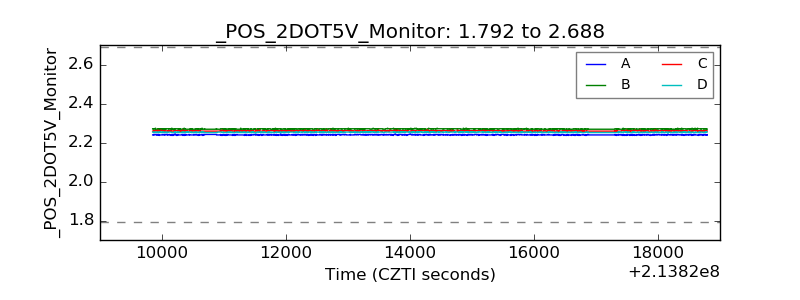 |
| +5 Volts monitor | 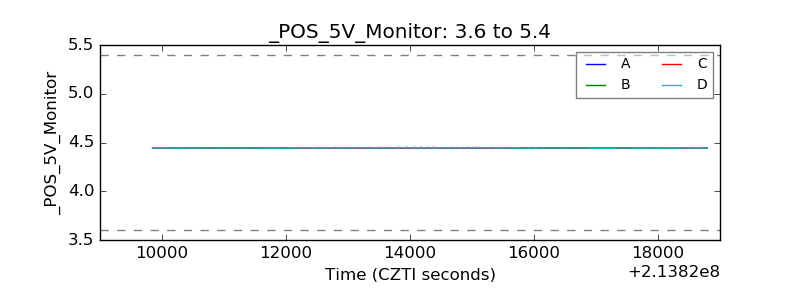 |
| _ROLL_ROT | 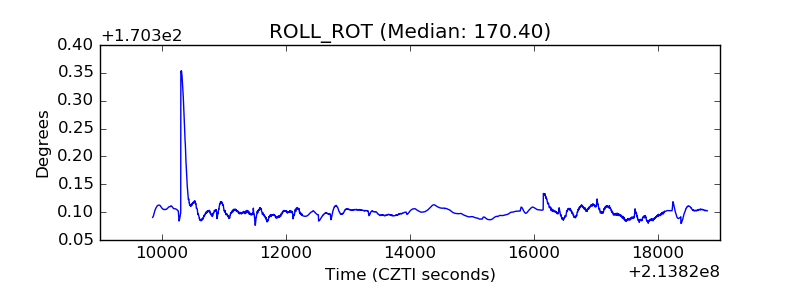 |
| _Roll_DEC | 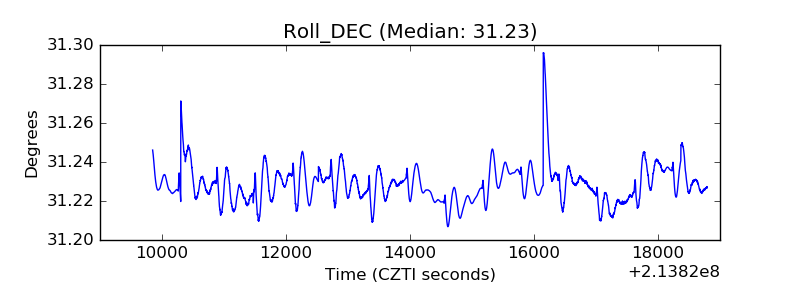 |
| _Roll_RA | 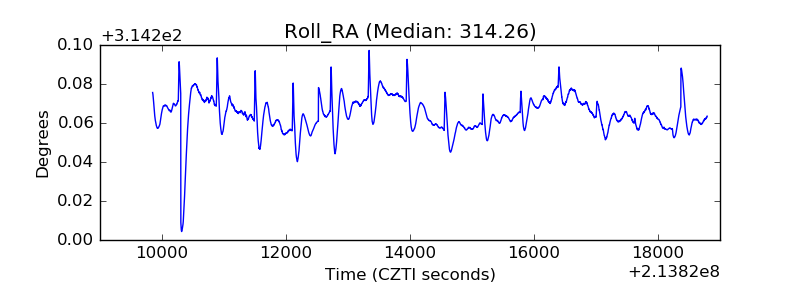 |
| Veto Counter | 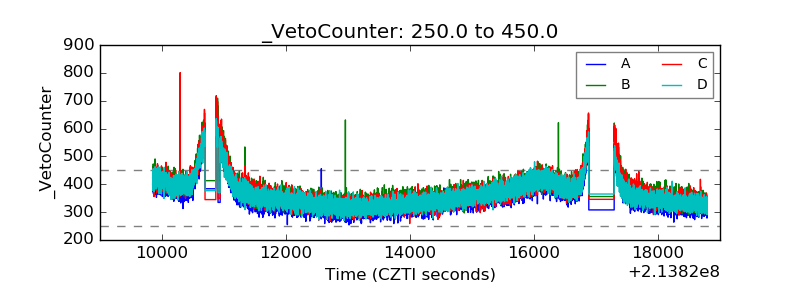 |