| Param | Original file | Final file |
|---|---|---|
| Filename | modeM0/AS1G06_060T01_9000000726_05610cztM0_level2.evt | modeM0/AS1G06_060T01_9000000726_05610cztM0_level2_quad_clean.evt |
| Size (bytes) | 1,274,117,760 | 189,950,400 |
| Size | 1.2 GB | 181.2 MB |
| Events in quadrant A | 8,605,672 | 1,125,514 |
| Events in quadrant B | 10,318,857 | 1,132,427 |
| Events in quadrant C | 8,597,506 | 1,128,520 |
| Events in quadrant D | 9,788,503 | 1,065,853 |
| Mode M9 | |||
|---|---|---|---|
| Quadrant | BADHDUFLAG | Total packets | Discarded packets |
| A | 0 | 26 | 0 |
| B | 0 | 26 | 0 |
| C | 0 | 26 | 0 |
| D | 0 | 26 | 0 |
| Mode SS | |||
|---|---|---|---|
| Quadrant | BADHDUFLAG | Total packets | Discarded packets |
| A | 0 | 388 | 0 |
| B | 0 | 388 | 0 |
| C | 0 | 388 | 2 |
| D | 0 | 388 | 2 |
| Mode M0 | |||
|---|---|---|---|
| Quadrant | BADHDUFLAG | Total packets | Discarded packets |
| A | 0 | 38803 | 164 |
| B | 0 | 43701 | 244 |
| C | 0 | 38802 | 182 |
| D | 0 | 42761 | 229 |
| Quadrant | Total seconds | Saturated seconds | Saturation percentage |
|---|---|---|---|
| A | 18874 | 127 | 0.672883% |
| B | 18858 | 244 | 1.293881% |
| C | 18866 | 85 | 0.450546% |
| D | 18860 | 220 | 1.166490% |
Noise dominated data is calculated using 1-second bins in cleaned event files. If a bin has >2000 counts, and if more than 50% of those come from <1% of pixels, then it is considered to be noise-dominated and hence unusable.
| Quadrant | # 1 sec bins | Bins with >0 counts | Bins with >2000 counts | High rate bins dominated by noise | Noise dominated (total time) | Noise dominated (detector-on time) | Marked lightcurve |
|---|---|---|---|---|---|---|---|
| A | 21545 | 18956 | 8 | 8 | 0.04% | 0.04% | 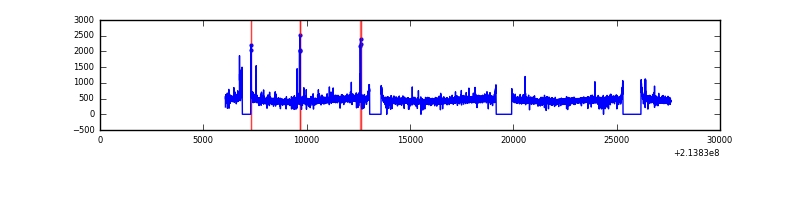 |
| B | 21545 | 18956 | 29 | 29 | 0.13% | 0.15% | 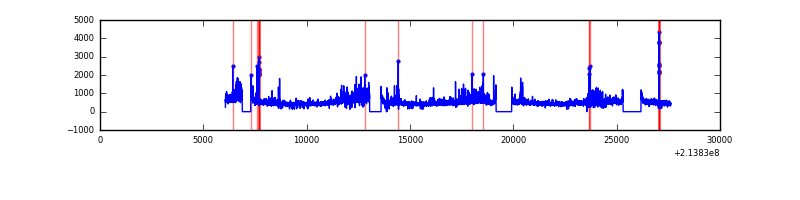 |
| C | 21545 | 18955 | 7 | 7 | 0.03% | 0.04% | 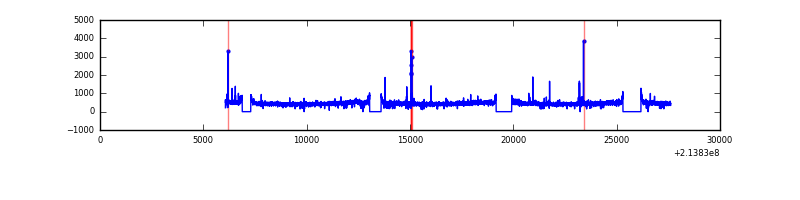 |
| D | 21545 | 18955 | 121 | 121 | 0.56% | 0.64% | 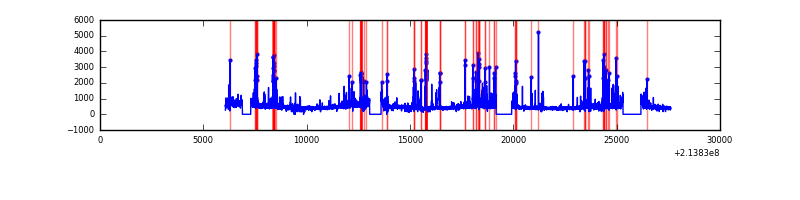 |
Top three noisy pixels from each quadrant. If the there are fewer than three noisy pixels in the level2.evt file, extra rows are filled as -1
| Pixel properties | Quadrant properties | ||||||
|---|---|---|---|---|---|---|---|
| Quadrant | DetID | PixID | Counts | Sigma | Mean | Median | Sigma |
| A | 0 | 50 | 81187 | 175.23 | 2193 | 2140 | 451.1 |
| A | 7 | 16 | 32481 | 67.26 | 2193 | 2140 | 451.1 |
| A | 0 | 226 | 21631 | 43.21 | 2193 | 2140 | 451.1 |
| B | 15 | 204 | 1248213 | 2934.68 | 2217 | 2156 | 424.6 |
| B | 0 | 214 | 157096 | 364.91 | 2217 | 2156 | 424.6 |
| B | 4 | 81 | 107215 | 247.43 | 2217 | 2156 | 424.6 |
| C | 1 | 16 | 188887 | 375.91 | 2139 | 2147 | 496.8 |
| C | 5 | 250 | 17782 | 31.47 | 2139 | 2147 | 496.8 |
| C | 13 | 61 | 17525 | 30.96 | 2139 | 2147 | 496.8 |
| D | 2 | 136 | 671272 | 1288.37 | 2122 | 2058 | 519.4 |
| D | 11 | 241 | 445936 | 854.55 | 2122 | 2058 | 519.4 |
| D | 2 | 14 | 186256 | 354.62 | 2122 | 2058 | 519.4 |
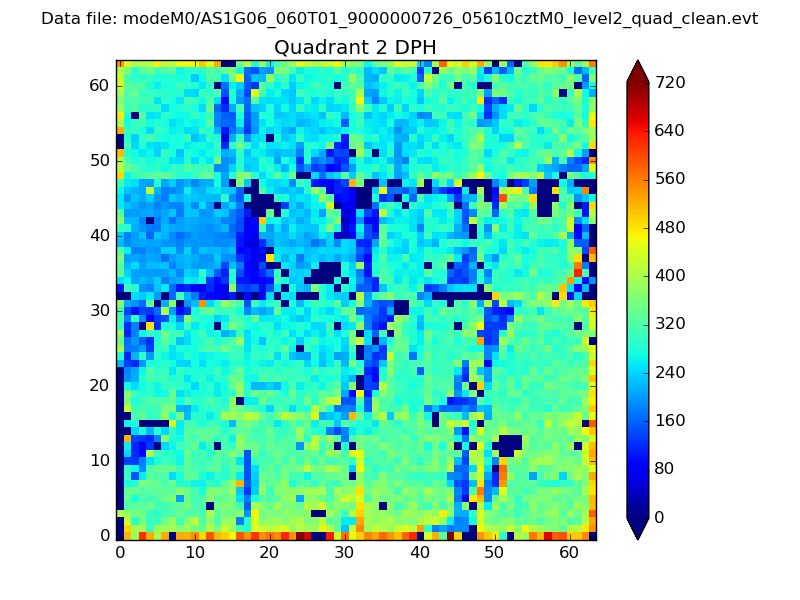
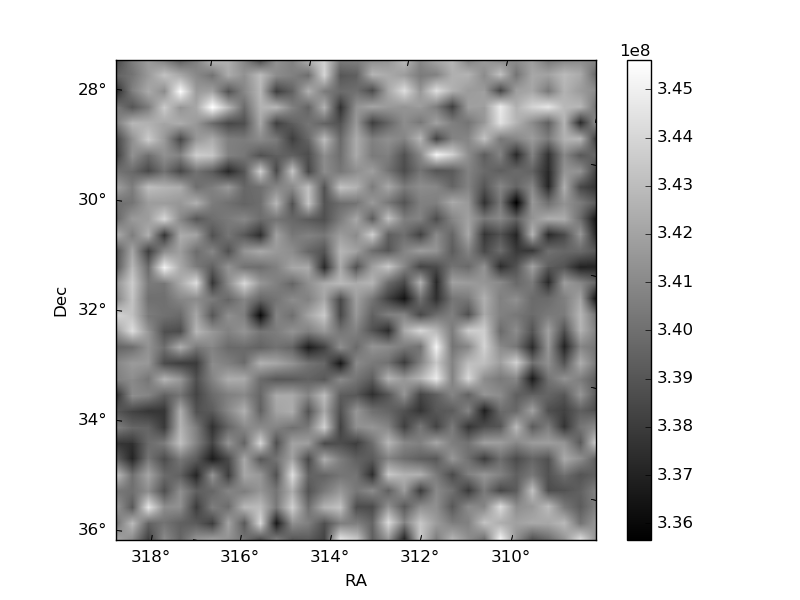
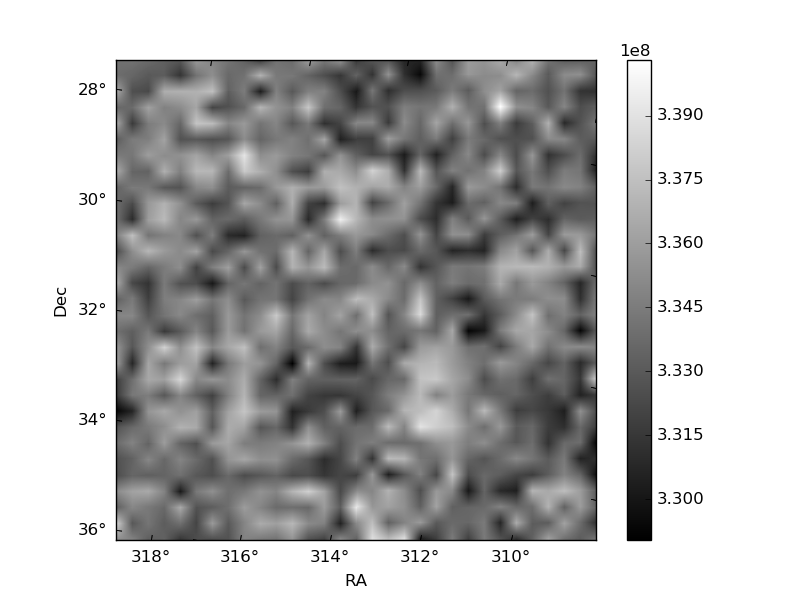
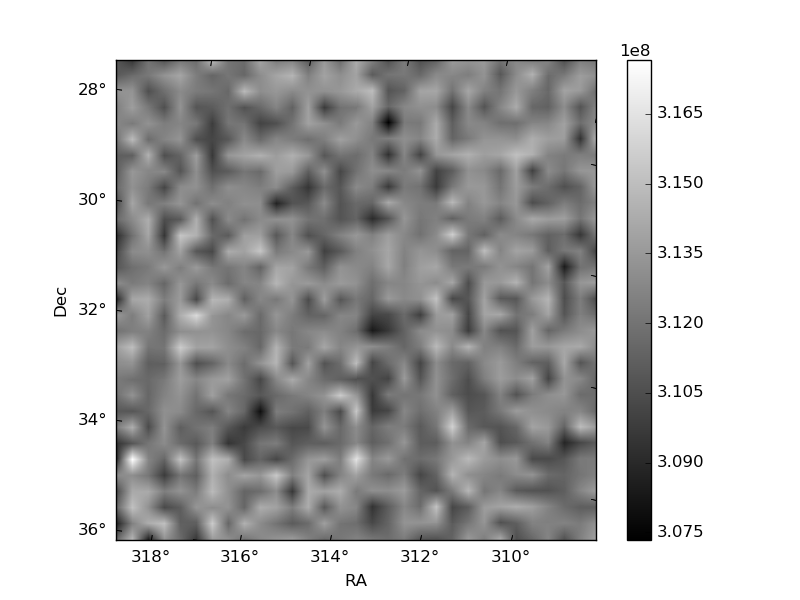
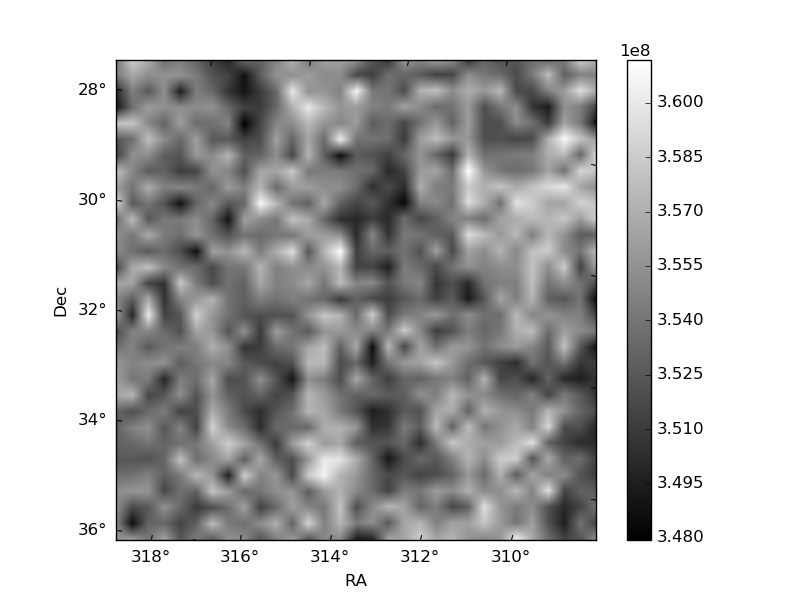
Histogram calculated using DETX and DETY for each event in the final _common_clean file
| Quadrant A | 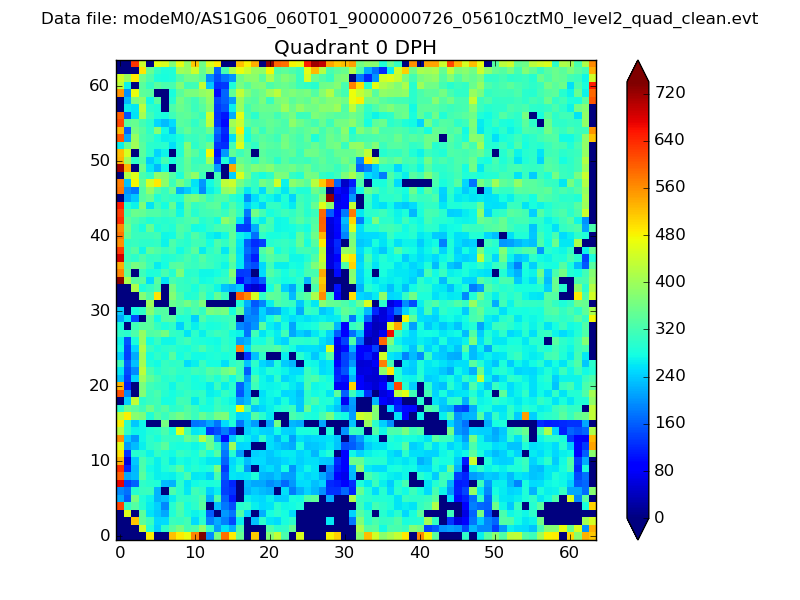 |
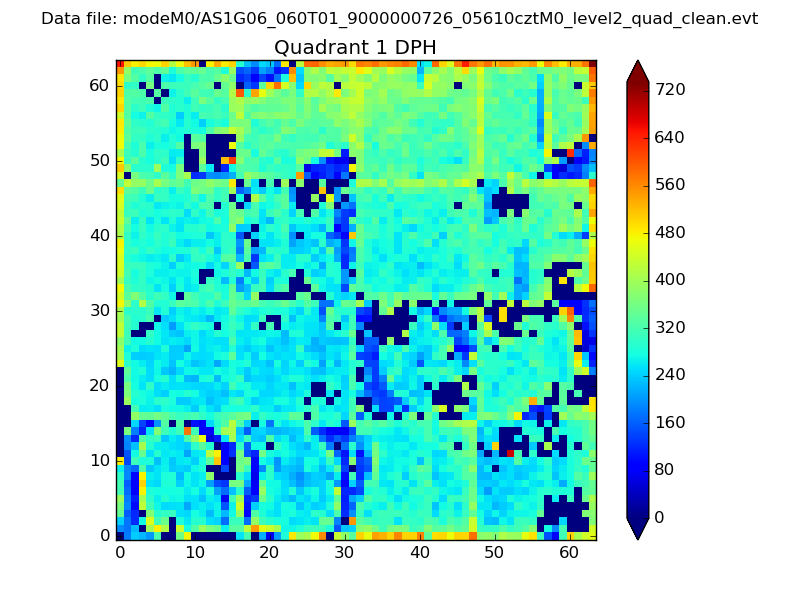 |
Quadrant B |
|---|---|---|---|
| Quadrant D | 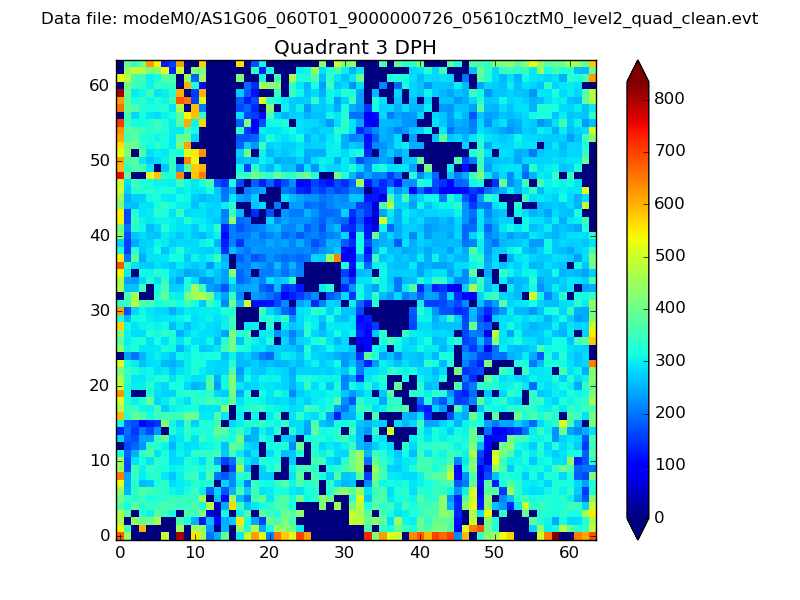 |
 |
Quadrant C |
| Plot type | Count rate plots | Images |
|---|---|---|
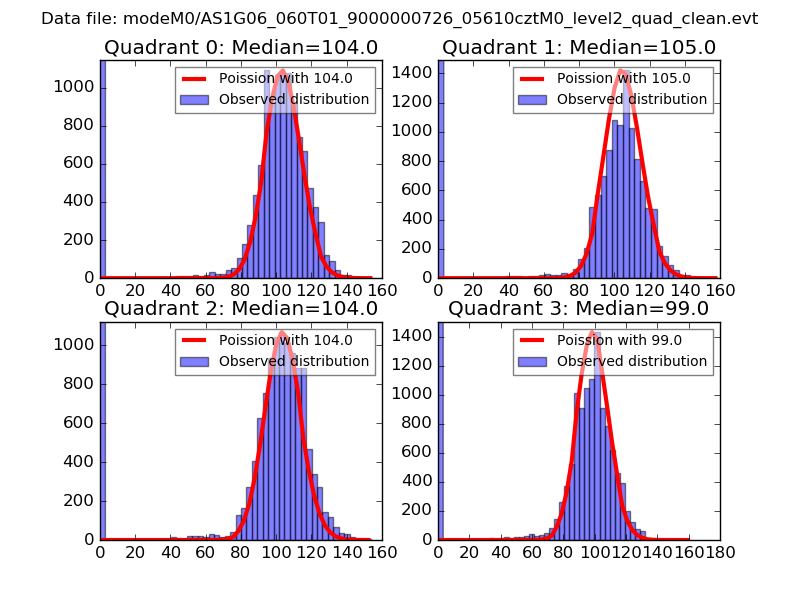
| Comparison with Poisson distribution Blue bars denote a histogram of data divided into 1 sec bins. Red curve is a Poisson curve with rate = median count rate of data. |
 |
 |
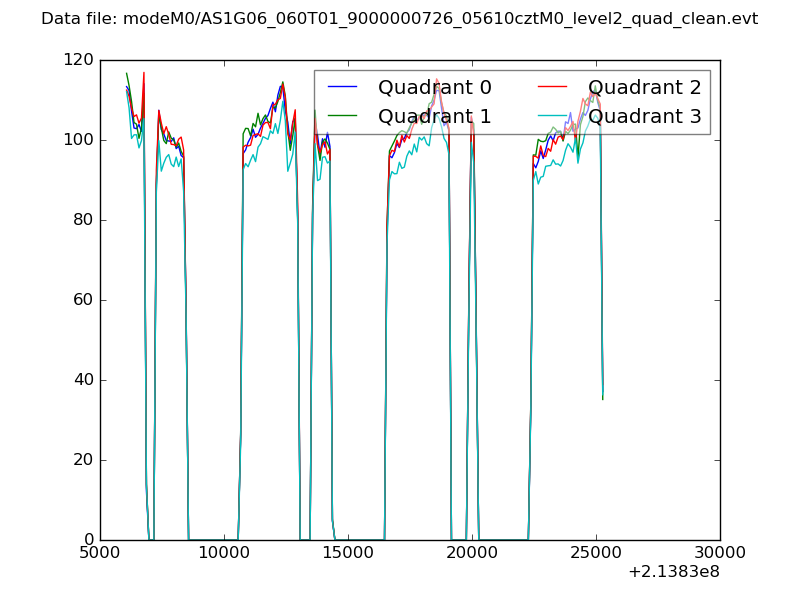
| Quadrant-wise count rates Data is divided into 100 sec bins |
 |
|
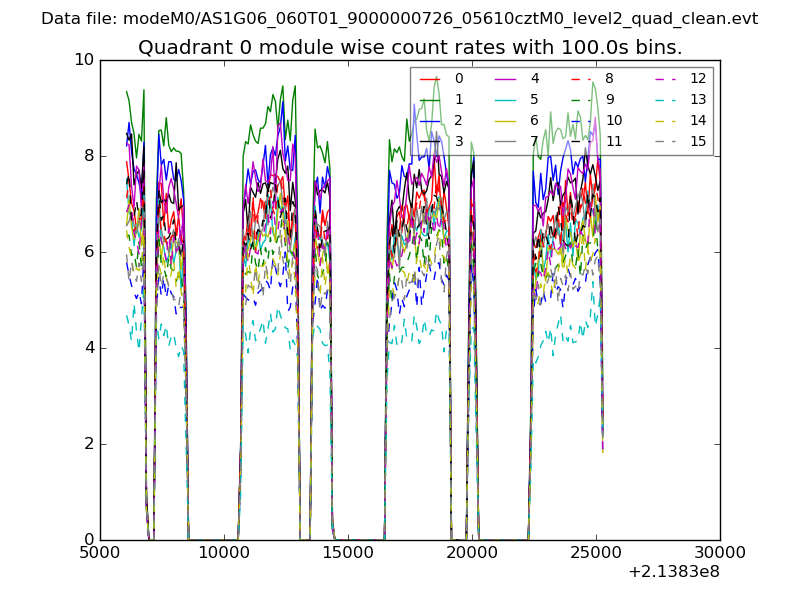
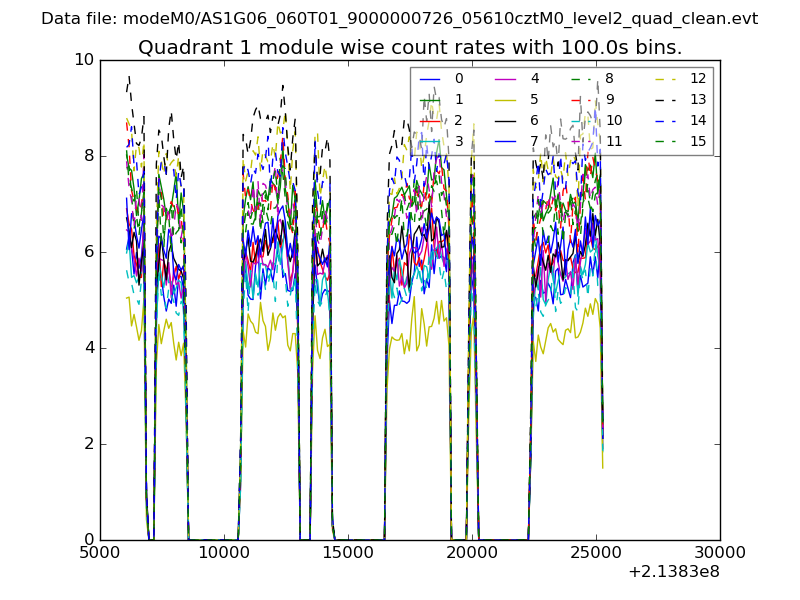
| Module-wise count rates for Quadrant A Data is divided into 100 sec bins |
 |
 |
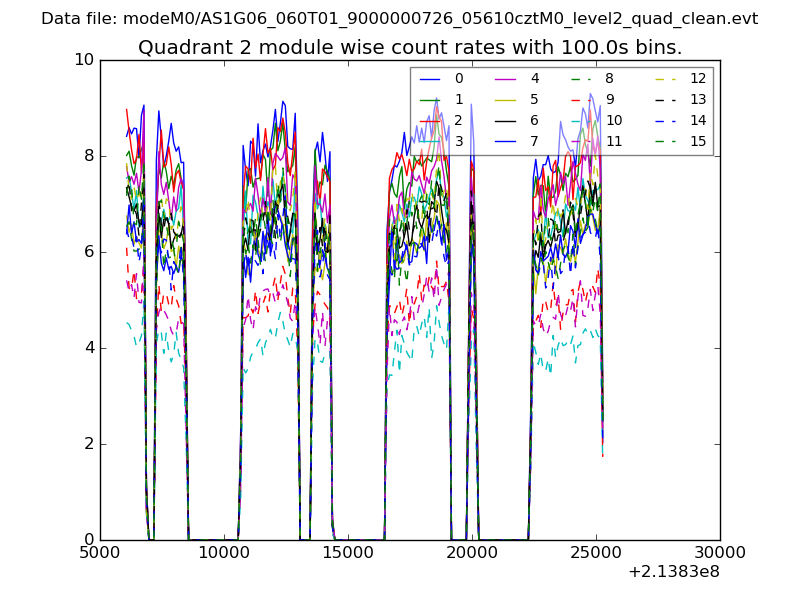
| Module-wise count rates for Quadrant B Data is divided into 100 sec bins |
 |
 |
| Module-wise count rates for Quadrant C Data is divided into 100 sec bins |
 |
 |
| Module-wise count rates for Quadrant D Data is divided into 100 sec bins |
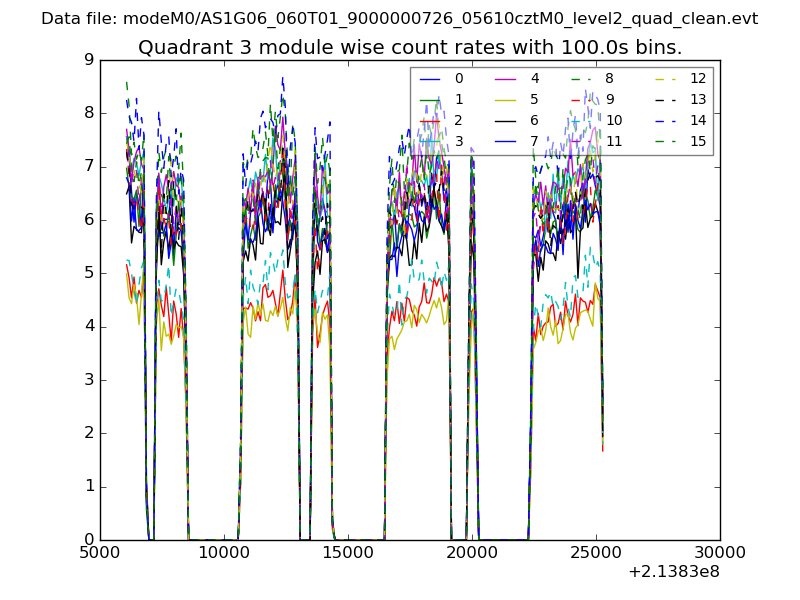 |
 |
| Parameter | Plot |
|---|---|
| CZT HV Monitor | 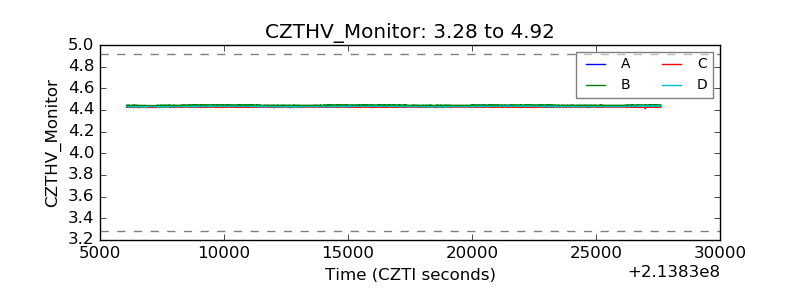 |
| D_VDD | 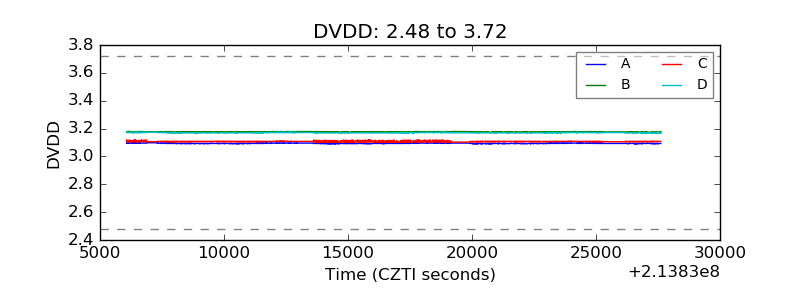 |
| Temperature 1 | 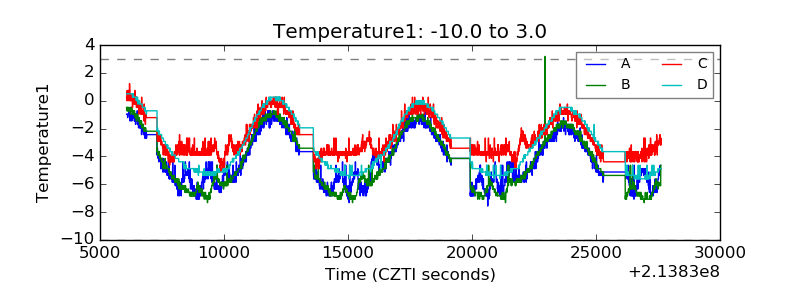 |
| Veto HV Monitor |  |
| Veto LLD | 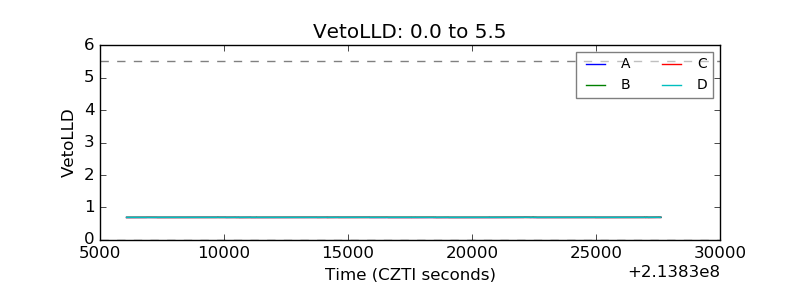 |
| Alpha Counter | 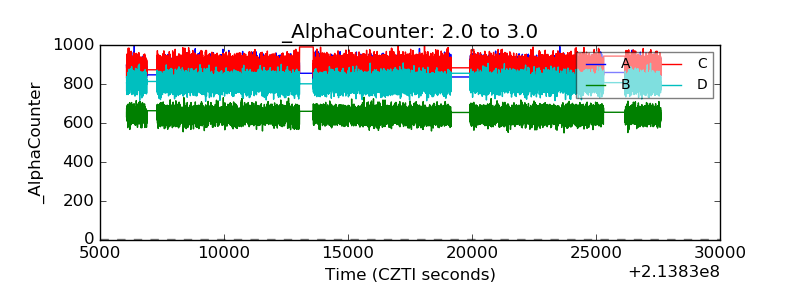 |
| _CPM_Rate | 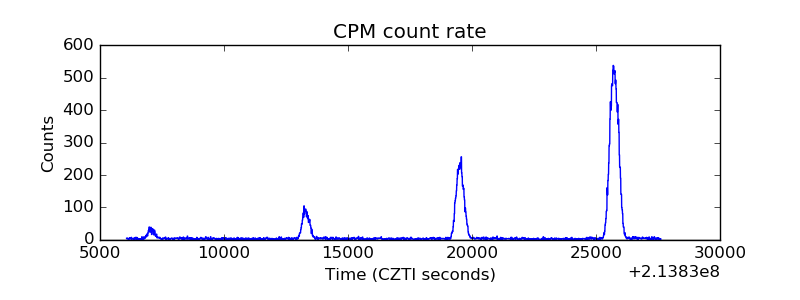 |
| CZT Counter | 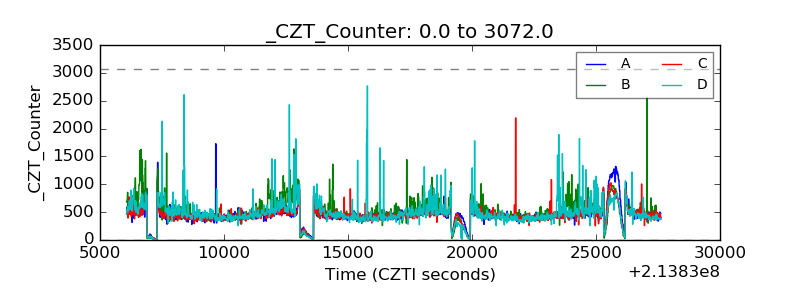 |
| +2.5 Volts monitor | 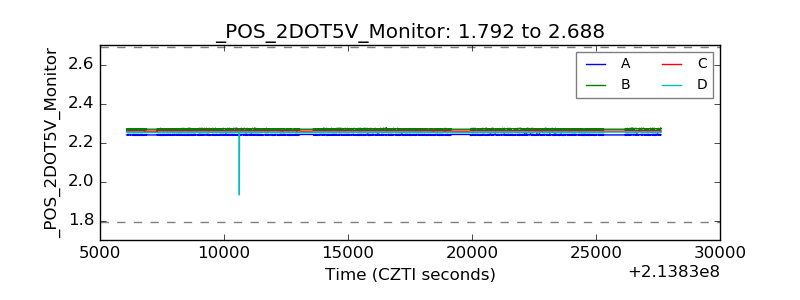 |
| +5 Volts monitor | 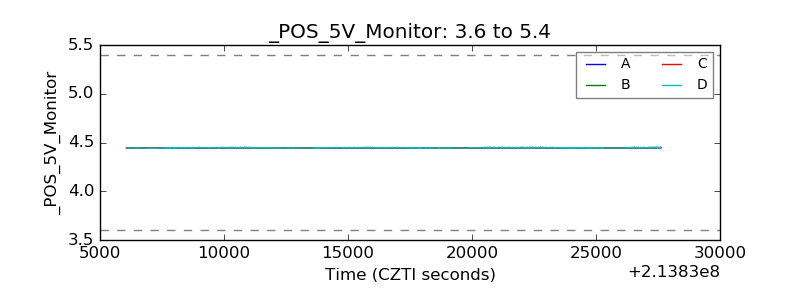 |
| _ROLL_ROT | 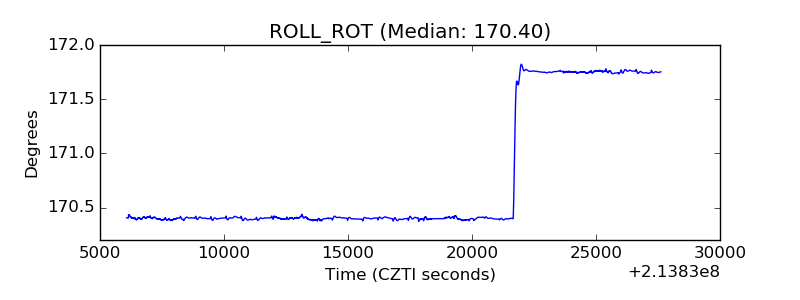 |
| _Roll_DEC | 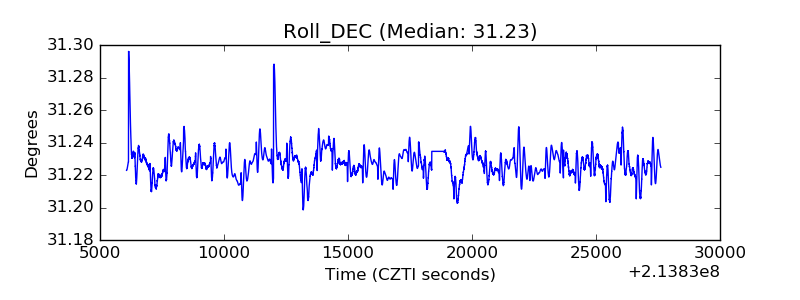 |
| _Roll_RA | 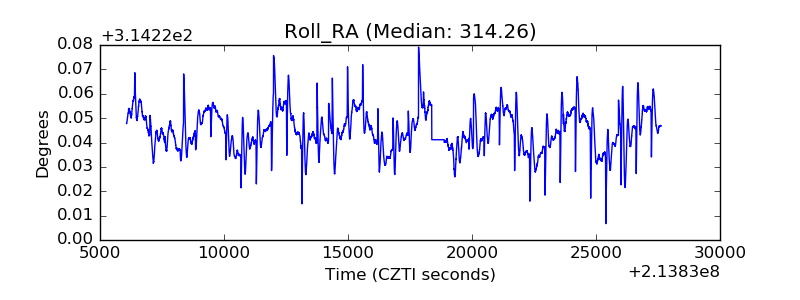 |
| Veto Counter | 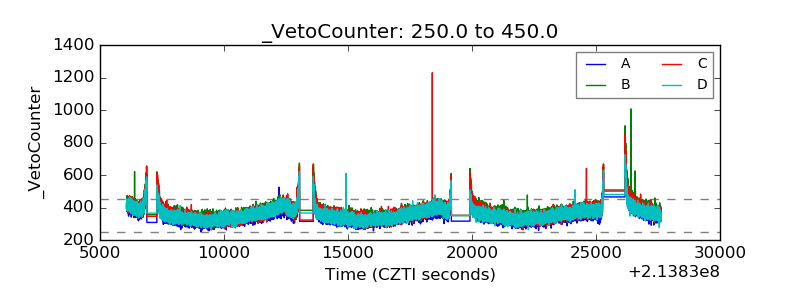 |