| Param | Original file | Final file |
|---|---|---|
| Filename | modeM0/AS1G06_060T01_9000000726_05611cztM0_level2.evt | modeM0/AS1G06_060T01_9000000726_05611cztM0_level2_quad_clean.evt |
| Size (bytes) | 472,821,120 | 65,131,200 |
| Size | 450.9 MB | 62.1 MB |
| Events in quadrant A | 3,296,643 | 375,043 |
| Events in quadrant B | 3,840,903 | 378,225 |
| Events in quadrant C | 3,220,652 | 375,440 |
| Events in quadrant D | 3,485,357 | 355,522 |
| Mode M9 | |||
|---|---|---|---|
| Quadrant | BADHDUFLAG | Total packets | Discarded packets |
| A | 0 | 18 | 0 |
| B | 0 | 18 | 0 |
| C | 0 | 18 | 0 |
| D | 0 | 18 | 0 |
| Mode SS | |||
|---|---|---|---|
| Quadrant | BADHDUFLAG | Total packets | Discarded packets |
| A | 0 | 146 | 0 |
| B | 0 | 146 | 0 |
| C | 0 | 146 | 0 |
| D | 0 | 146 | 0 |
| Mode M0 | |||
|---|---|---|---|
| Quadrant | BADHDUFLAG | Total packets | Discarded packets |
| A | 0 | 14486 | 9 |
| B | 0 | 15806 | 10 |
| C | 0 | 14347 | 21 |
| D | 0 | 15322 | 6 |
| Quadrant | Total seconds | Saturated seconds | Saturation percentage |
|---|---|---|---|
| A | 6997 | 84 | 1.200515% |
| B | 6996 | 138 | 1.972556% |
| C | 6992 | 44 | 0.629291% |
| D | 6998 | 77 | 1.100314% |
Noise dominated data is calculated using 1-second bins in cleaned event files. If a bin has >2000 counts, and if more than 50% of those come from <1% of pixels, then it is considered to be noise-dominated and hence unusable.
| Quadrant | # 1 sec bins | Bins with >0 counts | Bins with >2000 counts | High rate bins dominated by noise | Noise dominated (total time) | Noise dominated (detector-on time) | Marked lightcurve |
|---|---|---|---|---|---|---|---|
| A | 8900 | 7002 | 7 | 7 | 0.08% | 0.10% | 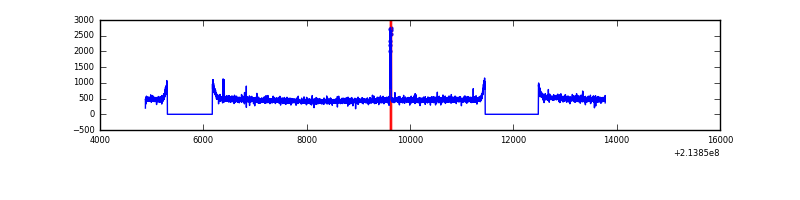 |
| B | 8900 | 7002 | 24 | 24 | 0.27% | 0.34% | 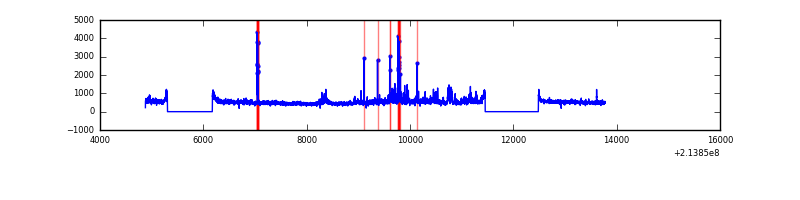 |
| C | 8900 | 7002 | 0 | 0 | 0.00% | 0.00% | 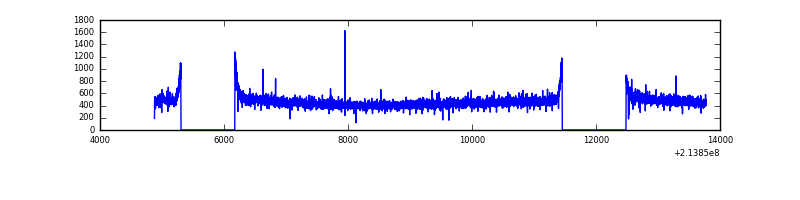 |
| D | 8900 | 7002 | 27 | 27 | 0.30% | 0.39% | 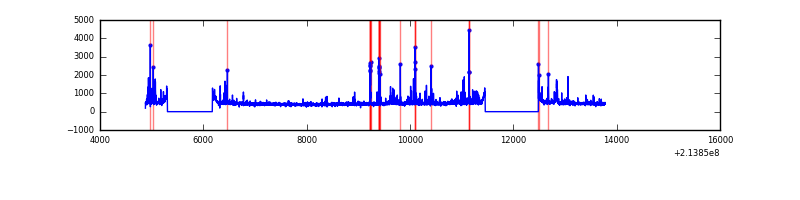 |
Top three noisy pixels from each quadrant. If the there are fewer than three noisy pixels in the level2.evt file, extra rows are filled as -1
| Pixel properties | Quadrant properties | ||||||
|---|---|---|---|---|---|---|---|
| Quadrant | DetID | PixID | Counts | Sigma | Mean | Median | Sigma |
| A | 0 | 50 | 37476 | 212.36 | 842 | 824 | 172.6 |
| A | 12 | 194 | 8193 | 42.7 | 842 | 824 | 172.6 |
| A | 0 | 226 | 8125 | 42.3 | 842 | 824 | 172.6 |
| B | 15 | 204 | 352503 | 2123.76 | 852 | 830 | 165.6 |
| B | 0 | 214 | 81162 | 485.13 | 852 | 830 | 165.6 |
| B | 4 | 48 | 37713 | 222.74 | 852 | 830 | 165.6 |
| C | 1 | 16 | 18010 | 89.07 | 820 | 825 | 192.9 |
| C | 13 | 61 | 6712 | 30.51 | 820 | 825 | 192.9 |
| C | 12 | 4 | 2695 | 9.69 | 820 | 825 | 192.9 |
| D | 2 | 136 | 260721 | 1301.35 | 812 | 788 | 199.7 |
| D | 2 | 14 | 42674 | 209.7 | 812 | 788 | 199.7 |
| D | 13 | 238 | 26994 | 131.2 | 812 | 788 | 199.7 |
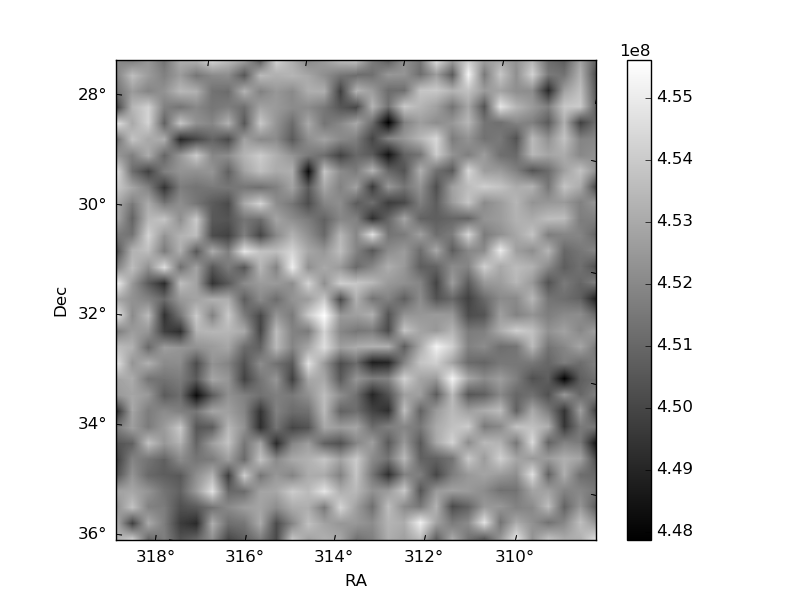
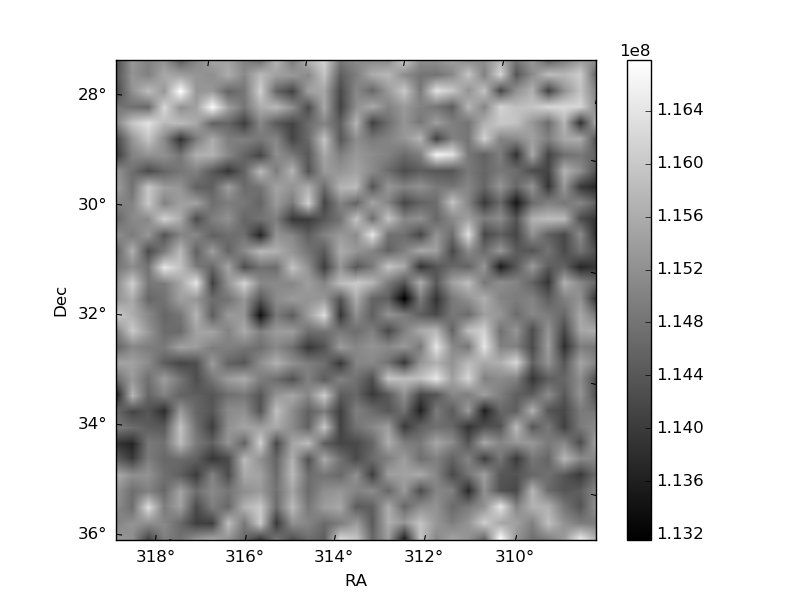
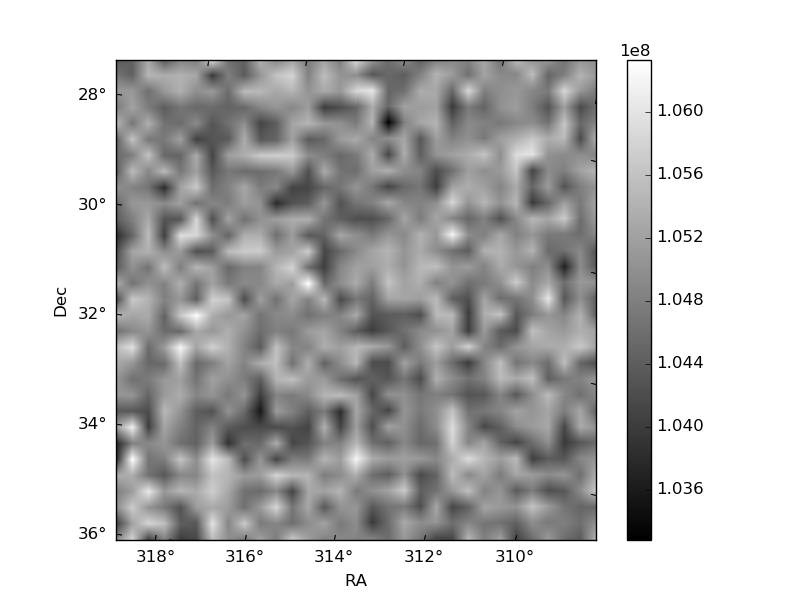
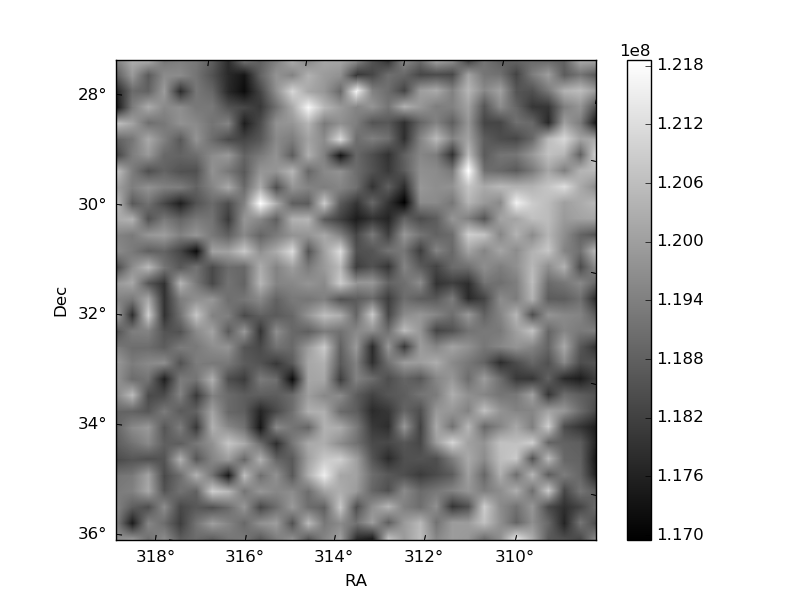
Histogram calculated using DETX and DETY for each event in the final _common_clean file
| Quadrant A | 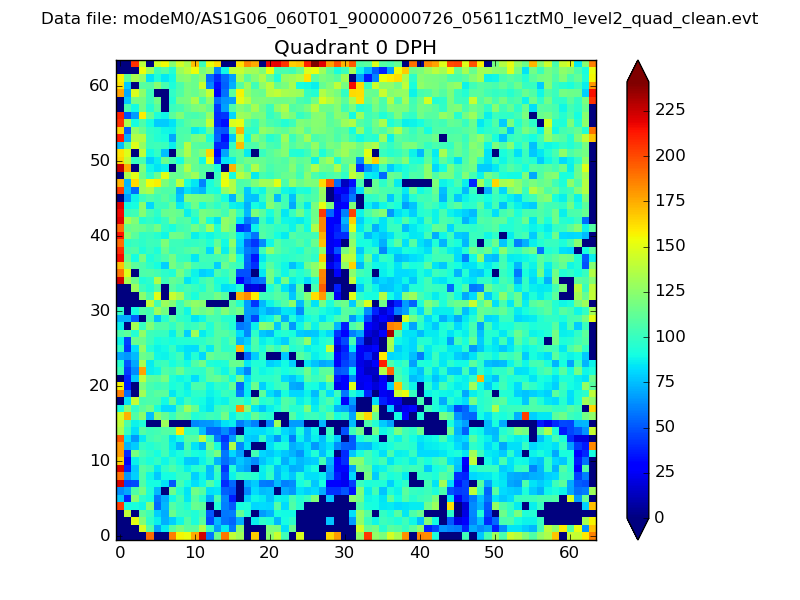 |
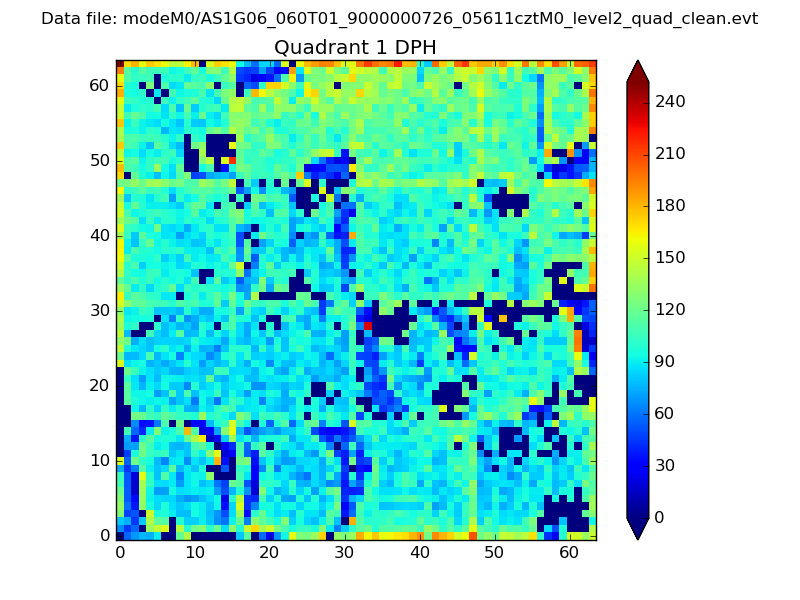 |
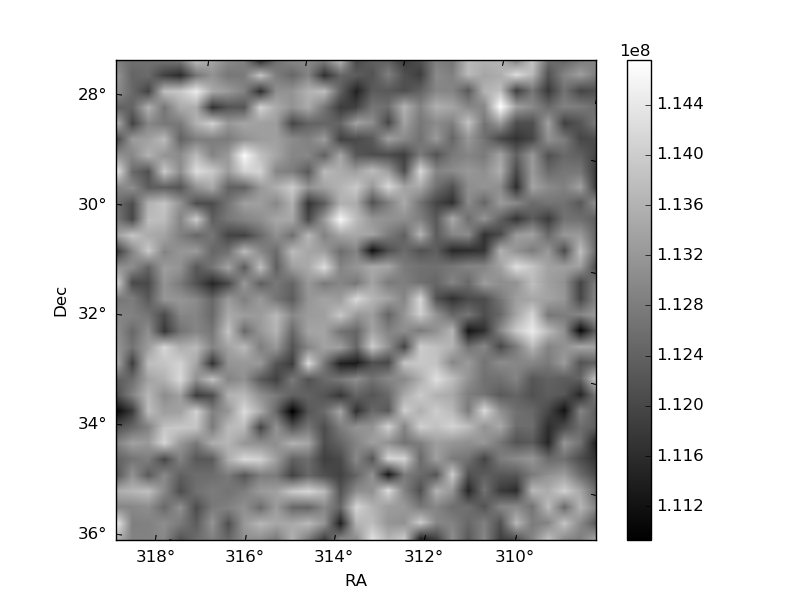
Quadrant B |
|---|---|---|---|
| Quadrant D | 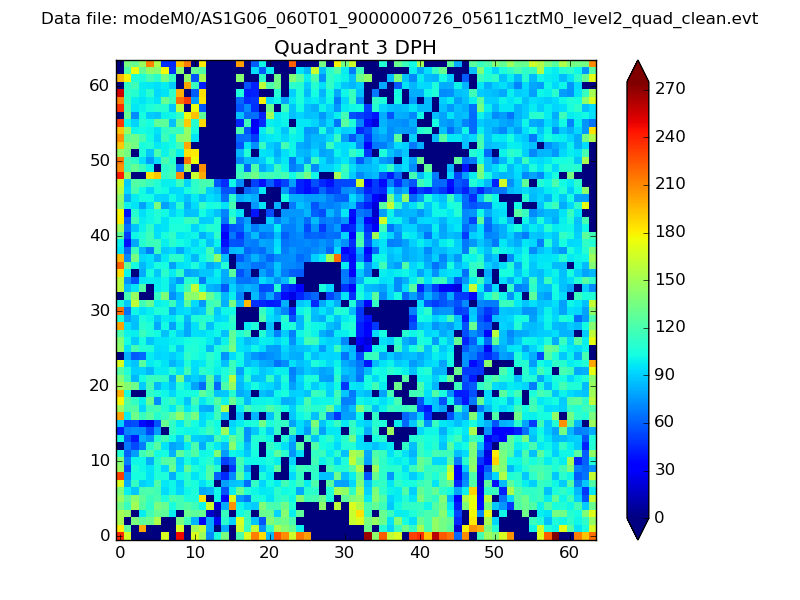 |
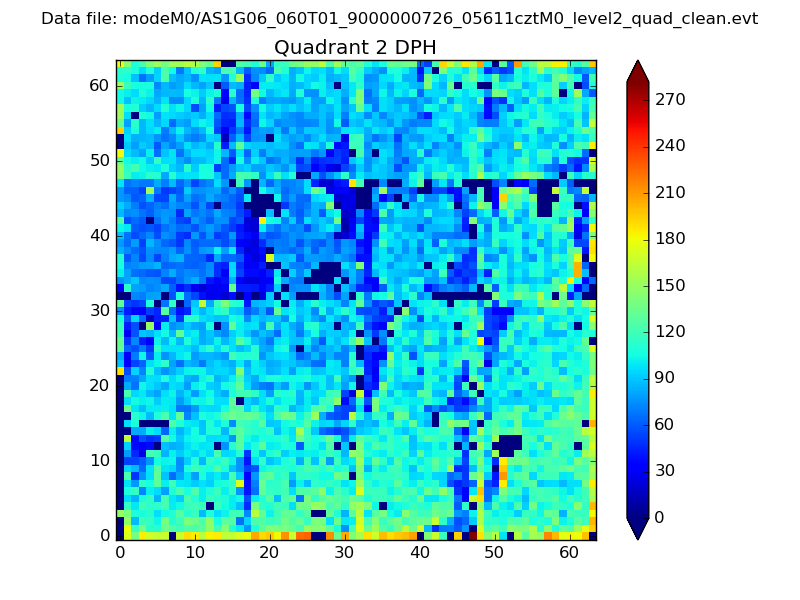 |
Quadrant C |
| Plot type | Count rate plots | Images |
|---|---|---|
| Comparison with Poisson distribution Blue bars denote a histogram of data divided into 1 sec bins. Red curve is a Poisson curve with rate = median count rate of data. |
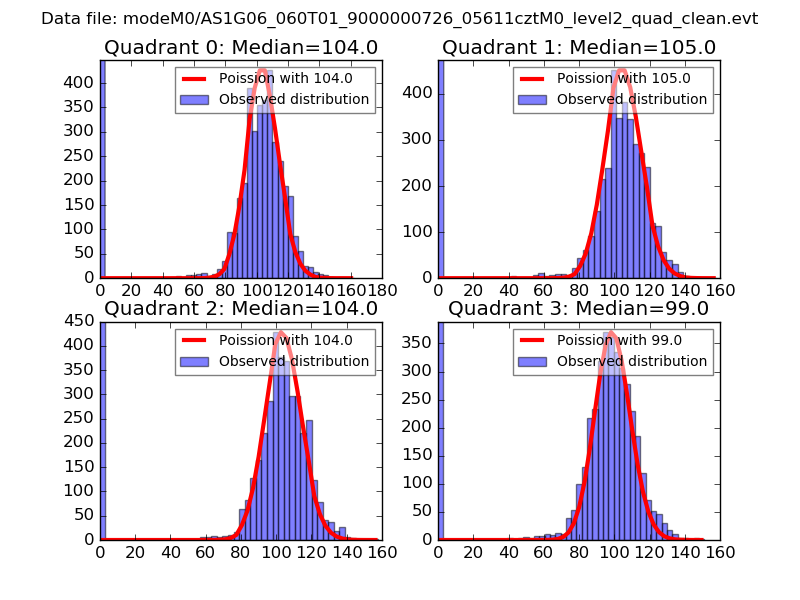 |
 |
| Quadrant-wise count rates Data is divided into 100 sec bins |
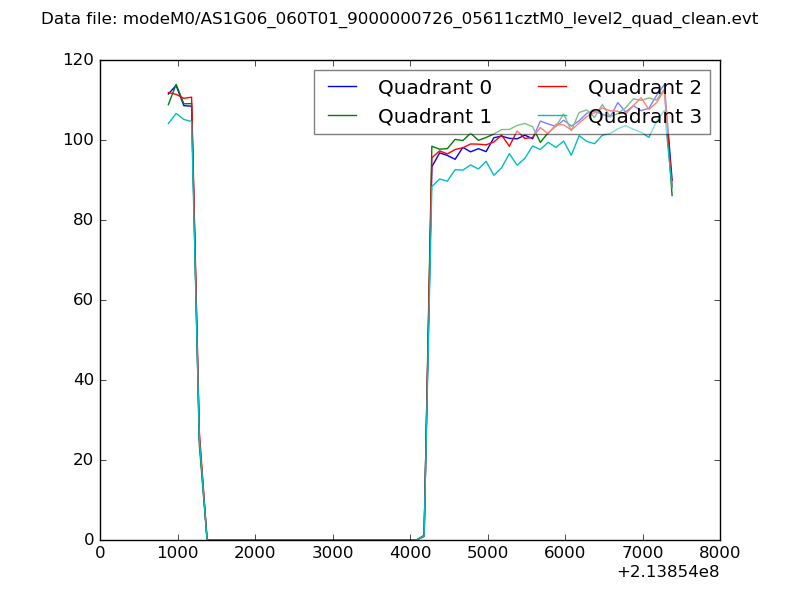 |
|
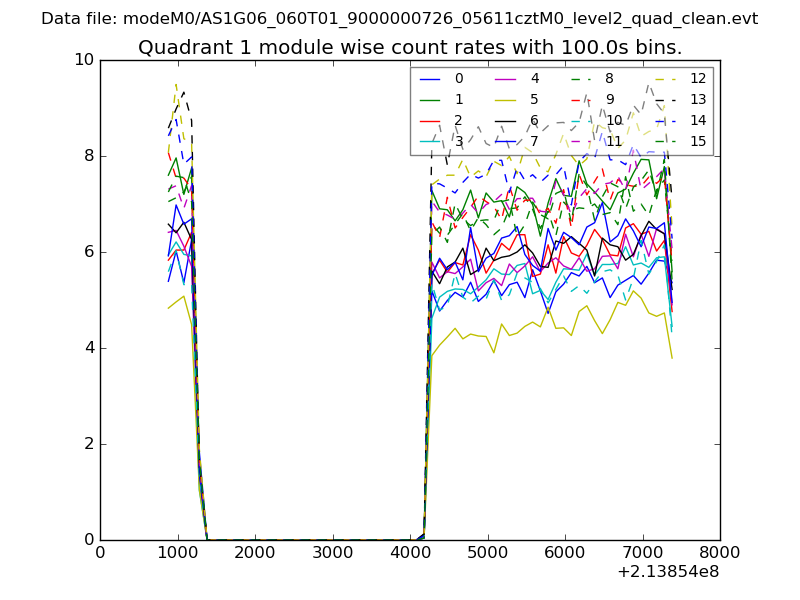
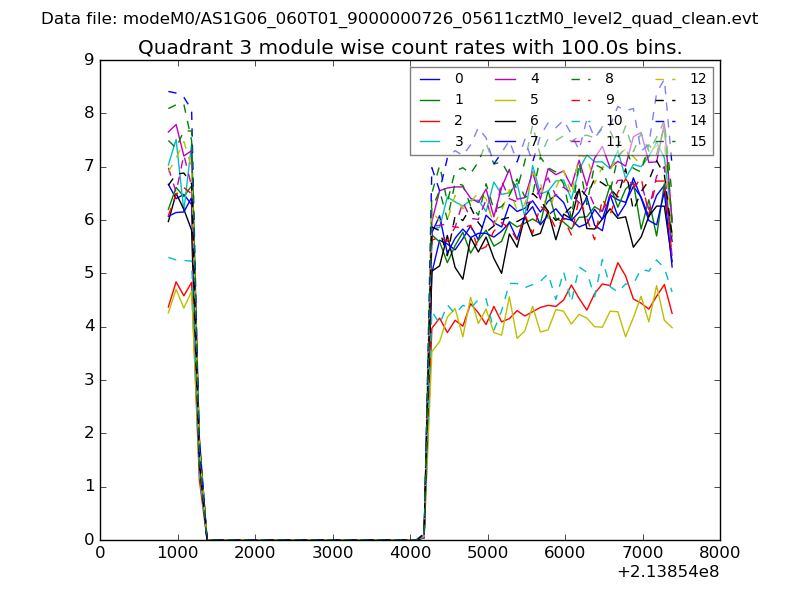
| Module-wise count rates for Quadrant A Data is divided into 100 sec bins |
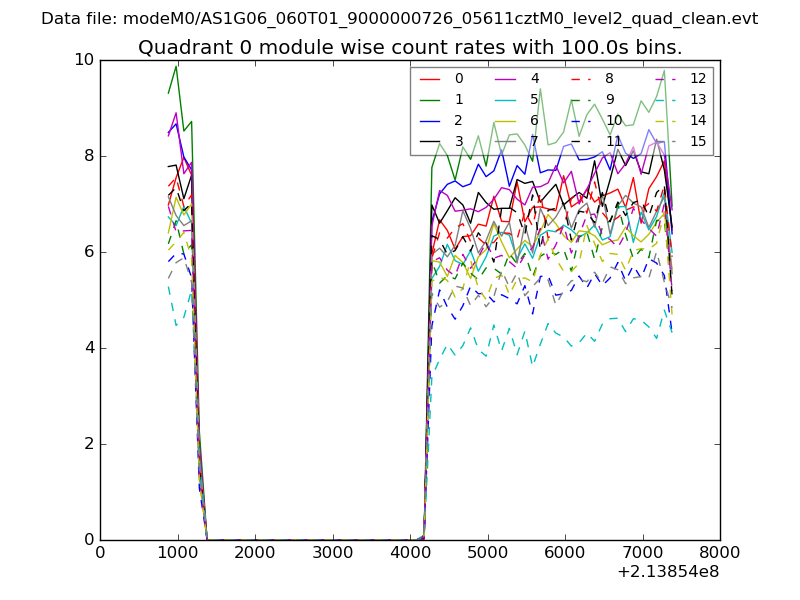 |
 |
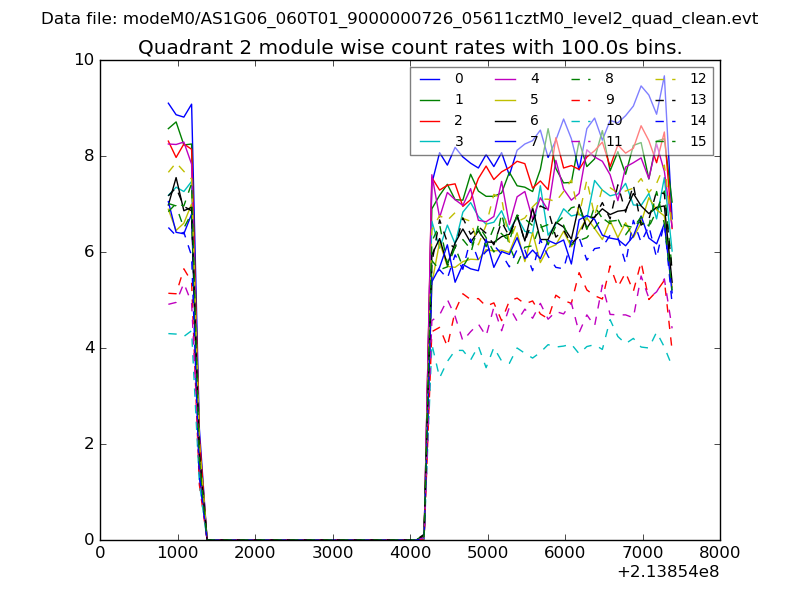
| Module-wise count rates for Quadrant B Data is divided into 100 sec bins |
 |
 |
| Module-wise count rates for Quadrant C Data is divided into 100 sec bins |
 |
 |
| Module-wise count rates for Quadrant D Data is divided into 100 sec bins |
 |
 |
| Parameter | Plot |
|---|---|
| CZT HV Monitor | 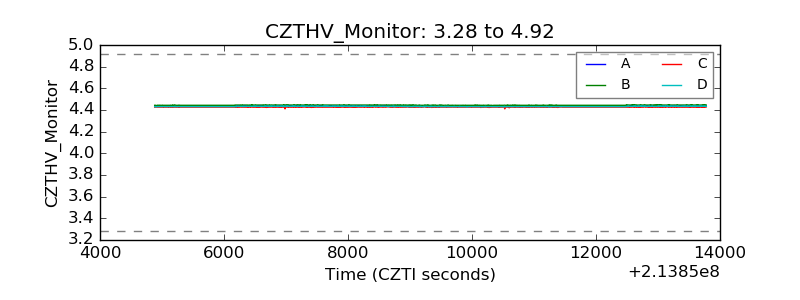 |
| D_VDD | 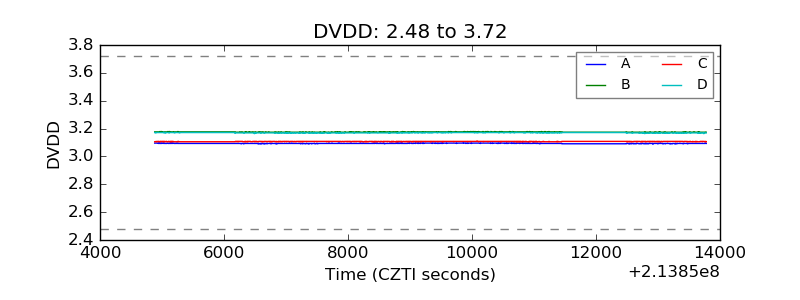 |
| Temperature 1 | 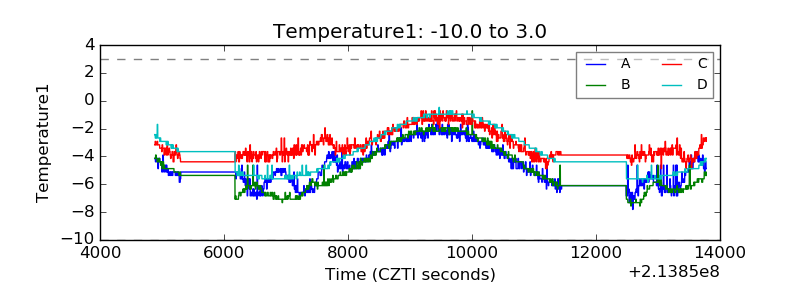 |
| Veto HV Monitor | 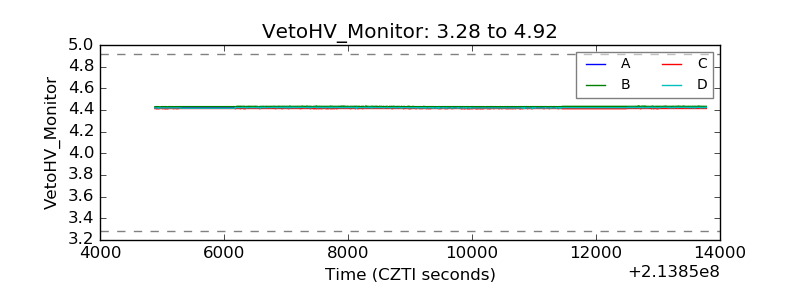 |
| Veto LLD | 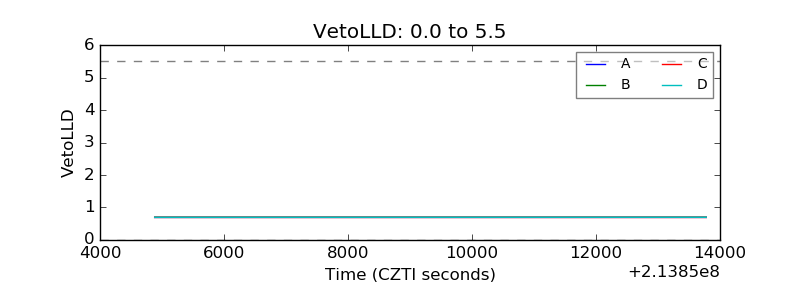 |
| Alpha Counter | 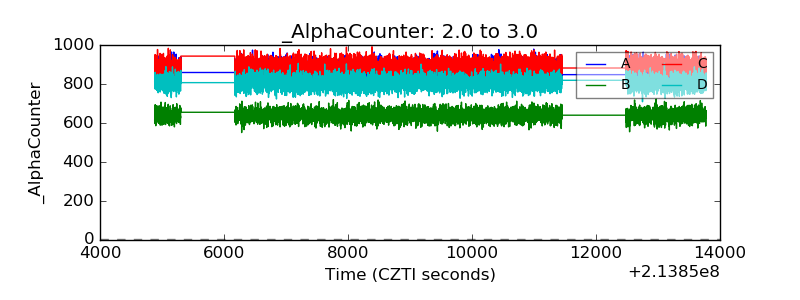 |
| _CPM_Rate | 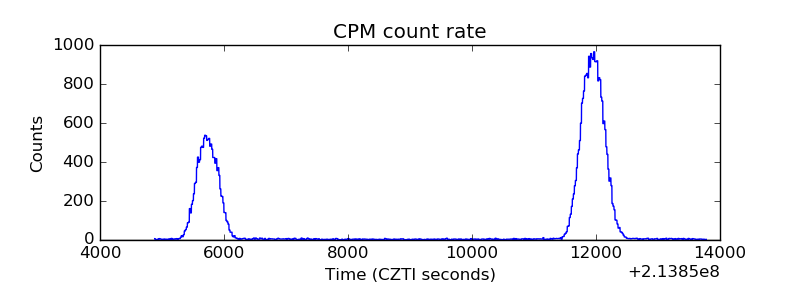 |
| CZT Counter | 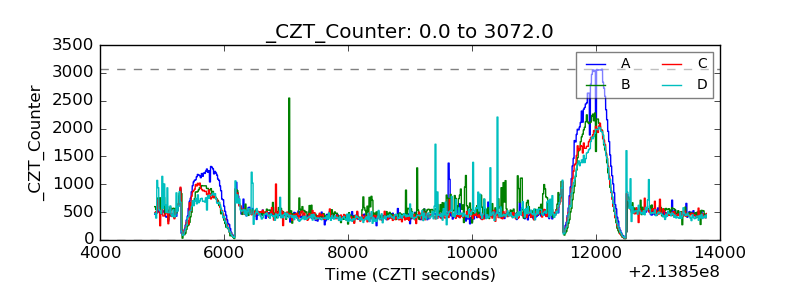 |
| +2.5 Volts monitor | 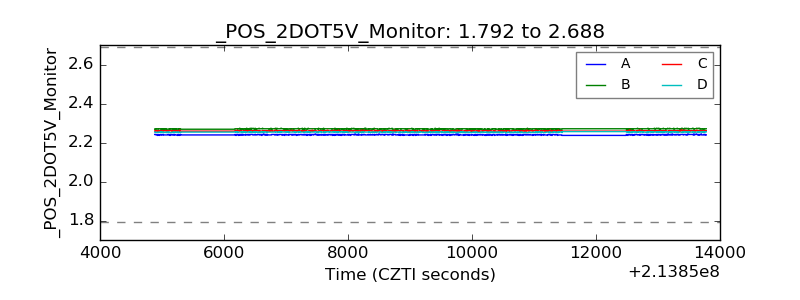 |
| +5 Volts monitor |  |
| _ROLL_ROT | 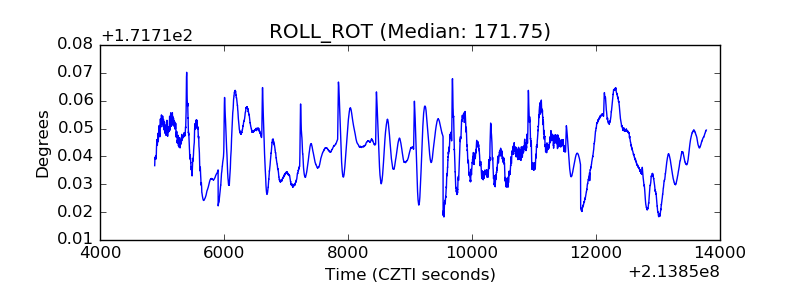 |
| _Roll_DEC | 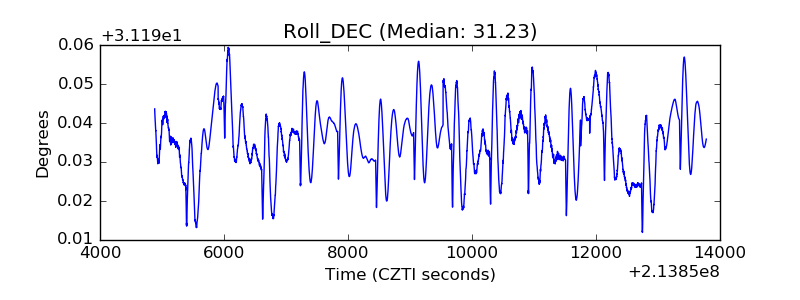 |
| _Roll_RA | 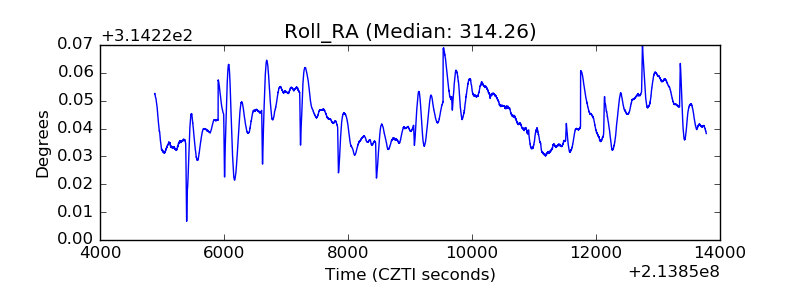 |
| Veto Counter | 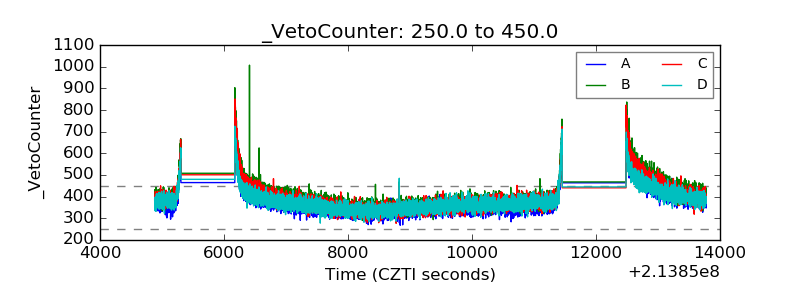 |