| Param | Original file | Final file |
|---|---|---|
| Filename | modeM0/AS1G06_060T01_9000000726_05613cztM0_level2.evt | modeM0/AS1G06_060T01_9000000726_05613cztM0_level2_quad_clean.evt |
| Size (bytes) | 446,155,200 | 64,880,640 |
| Size | 425.5 MB | 61.9 MB |
| Events in quadrant A | 3,144,612 | 381,078 |
| Events in quadrant B | 3,483,197 | 388,620 |
| Events in quadrant C | 3,037,822 | 381,068 |
| Events in quadrant D | 3,404,506 | 360,324 |
| Mode M9 | |||
|---|---|---|---|
| Quadrant | BADHDUFLAG | Total packets | Discarded packets |
| A | 0 | 15 | 0 |
| B | 0 | 15 | 0 |
| C | 0 | 15 | 0 |
| D | 0 | 16 | 0 |
| Mode SS | |||
|---|---|---|---|
| Quadrant | BADHDUFLAG | Total packets | Discarded packets |
| A | 0 | 132 | 0 |
| B | 0 | 132 | 0 |
| C | 0 | 132 | 0 |
| D | 0 | 132 | 0 |
| Mode M0 | |||
|---|---|---|---|
| Quadrant | BADHDUFLAG | Total packets | Discarded packets |
| A | 0 | 13480 | 3 |
| B | 0 | 14215 | 2 |
| C | 0 | 13345 | 2 |
| D | 0 | 14492 | 4 |
| Quadrant | Total seconds | Saturated seconds | Saturation percentage |
|---|---|---|---|
| A | 6498 | 79 | 1.215759% |
| B | 6498 | 84 | 1.292705% |
| C | 6498 | 57 | 0.877193% |
| D | 6497 | 99 | 1.523780% |
Noise dominated data is calculated using 1-second bins in cleaned event files. If a bin has >2000 counts, and if more than 50% of those come from <1% of pixels, then it is considered to be noise-dominated and hence unusable.
| Quadrant | # 1 sec bins | Bins with >0 counts | Bins with >2000 counts | High rate bins dominated by noise | Noise dominated (total time) | Noise dominated (detector-on time) | Marked lightcurve |
|---|---|---|---|---|---|---|---|
| A | 7608 | 6498 | 0 | 0 | 0.00% | 0.00% | 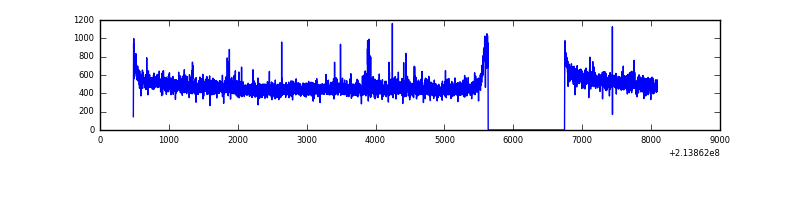 |
| B | 7608 | 6498 | 2 | 2 | 0.03% | 0.03% | 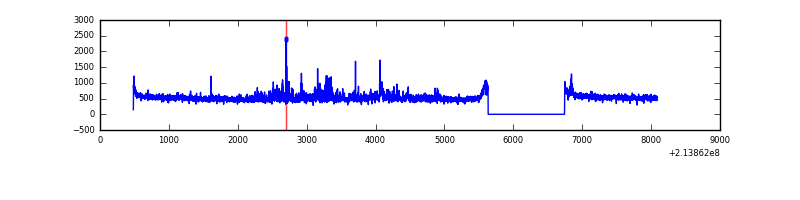 |
| C | 7608 | 6499 | 0 | 0 | 0.00% | 0.00% | 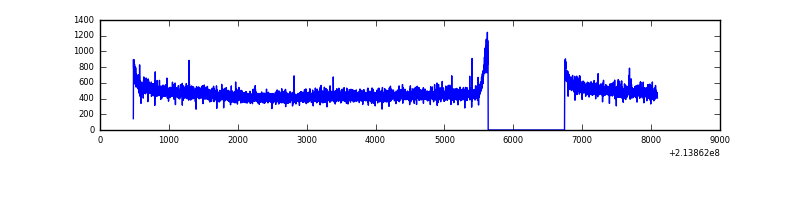 |
| D | 7608 | 6499 | 29 | 29 | 0.38% | 0.45% | 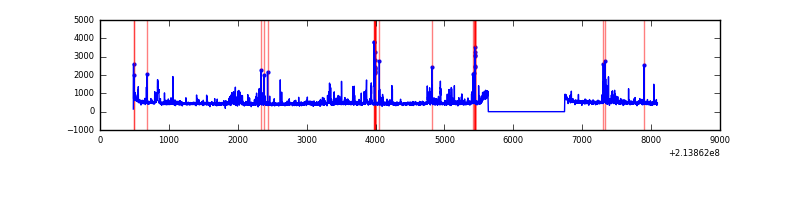 |
Top three noisy pixels from each quadrant. If the there are fewer than three noisy pixels in the level2.evt file, extra rows are filled as -1
| Pixel properties | Quadrant properties | ||||||
|---|---|---|---|---|---|---|---|
| Quadrant | DetID | PixID | Counts | Sigma | Mean | Median | Sigma |
| A | 10 | 133 | 23391 | 138.03 | 806 | 788 | 163.8 |
| A | 4 | 2 | 8206 | 45.3 | 806 | 788 | 163.8 |
| A | 12 | 194 | 7943 | 43.69 | 806 | 788 | 163.8 |
| B | 15 | 204 | 260360 | 1648.0 | 813 | 795 | 157.5 |
| B | 15 | 54 | 22663 | 138.84 | 813 | 795 | 157.5 |
| B | 0 | 219 | 22602 | 138.45 | 813 | 795 | 157.5 |
| C | 13 | 61 | 6242 | 30.34 | 776 | 781 | 180.0 |
| C | 12 | 4 | 5584 | 26.69 | 776 | 781 | 180.0 |
| C | 1 | 16 | 5160 | 24.33 | 776 | 781 | 180.0 |
| D | 2 | 136 | 227769 | 1211.09 | 770 | 745 | 187.5 |
| D | 2 | 152 | 131246 | 696.18 | 770 | 745 | 187.5 |
| D | 10 | 15 | 44461 | 233.21 | 770 | 745 | 187.5 |
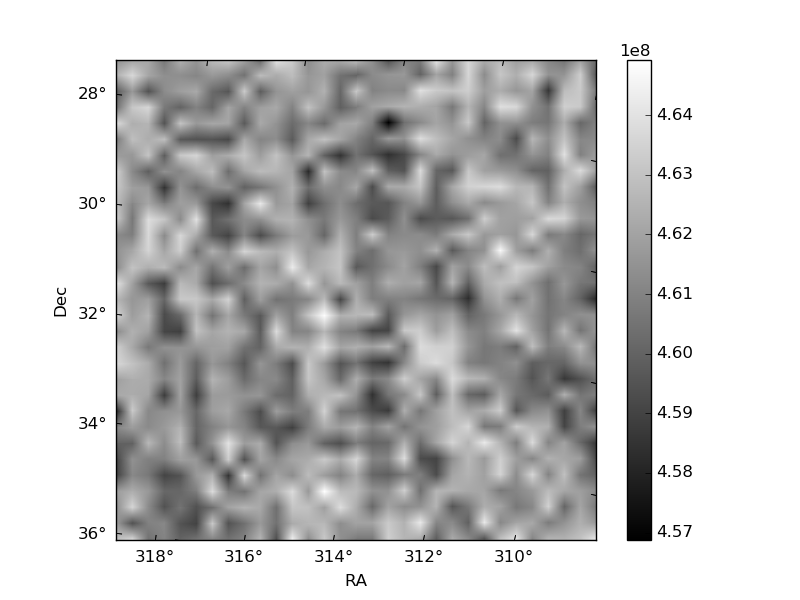
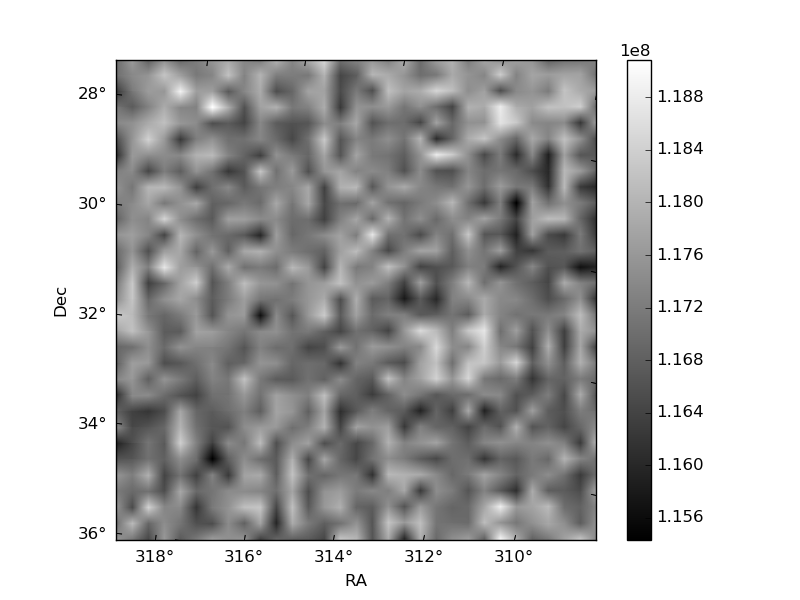
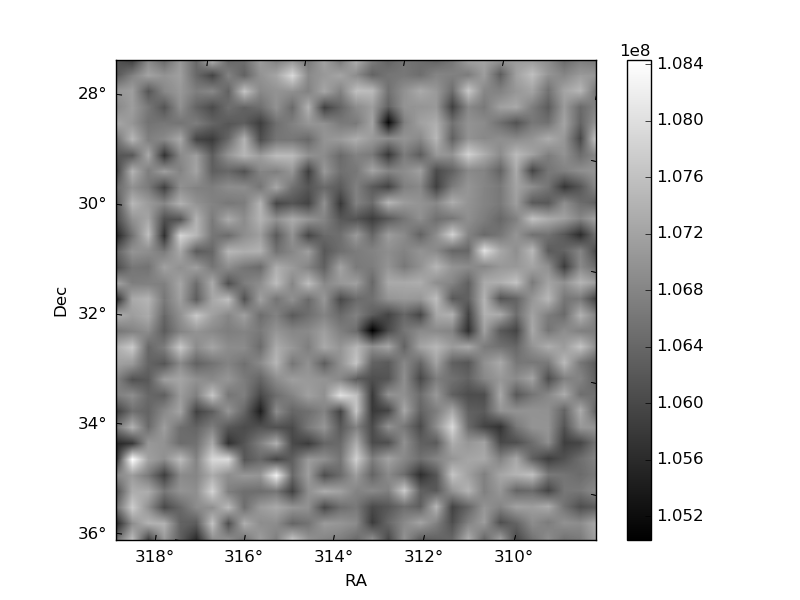
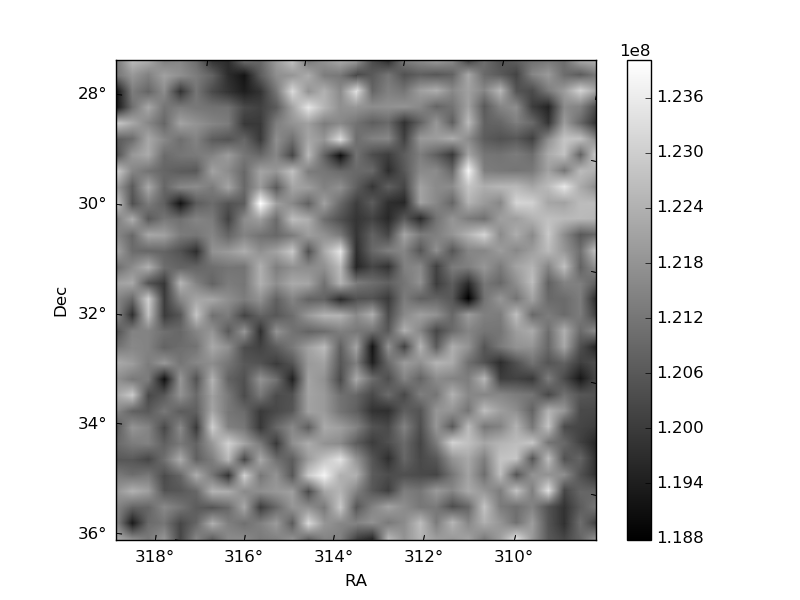
Histogram calculated using DETX and DETY for each event in the final _common_clean file
| Quadrant A | 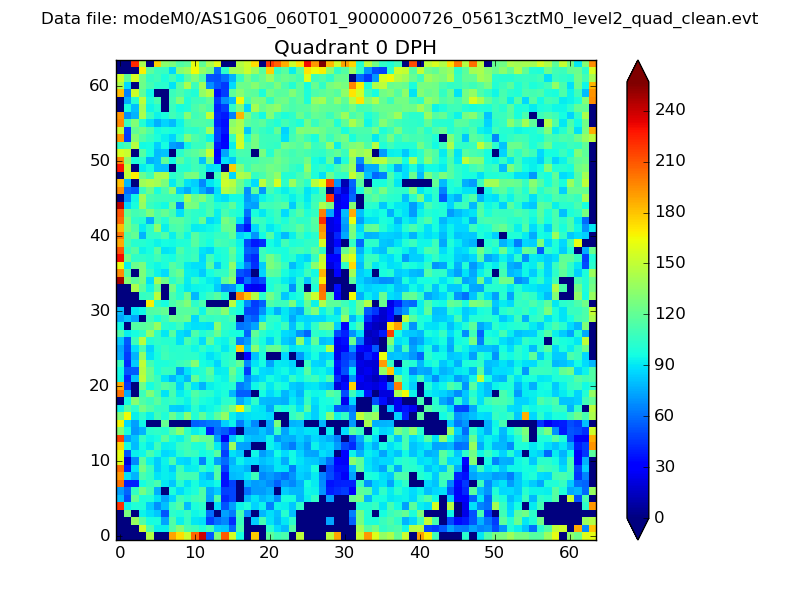 |
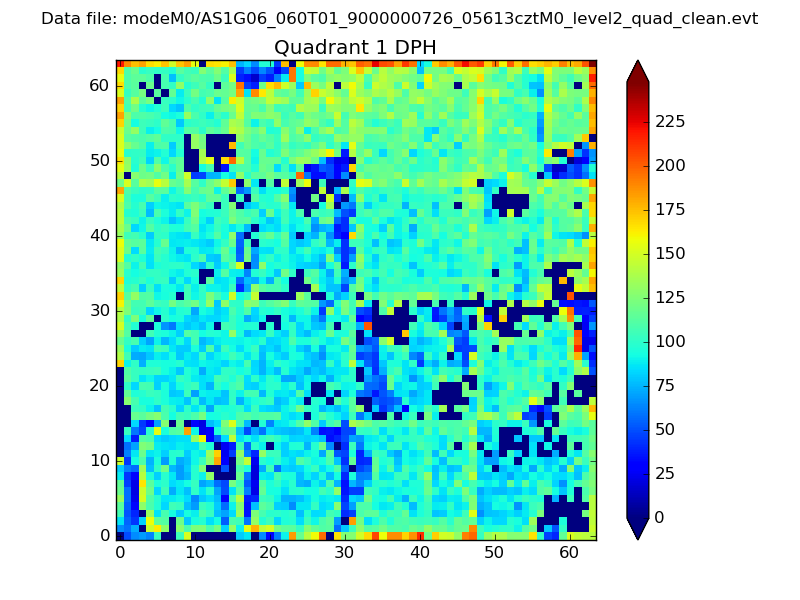 |
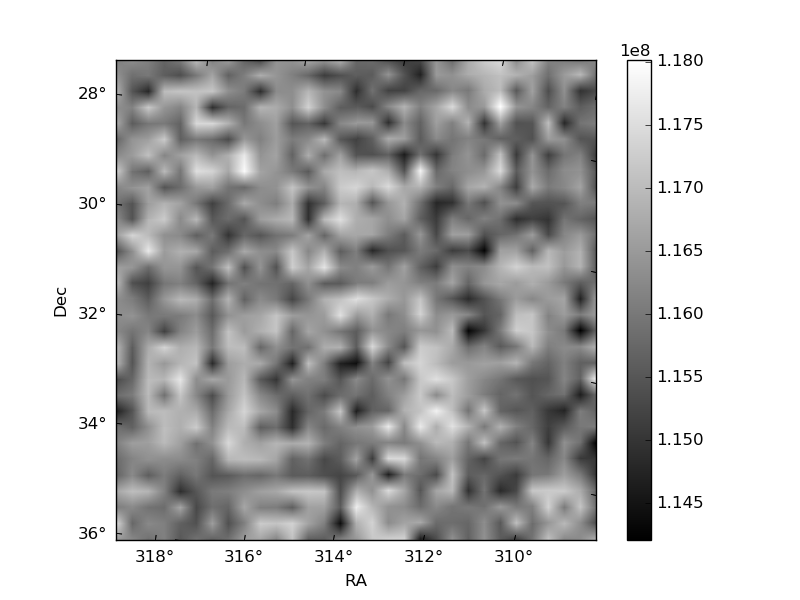
Quadrant B |
|---|---|---|---|
| Quadrant D | 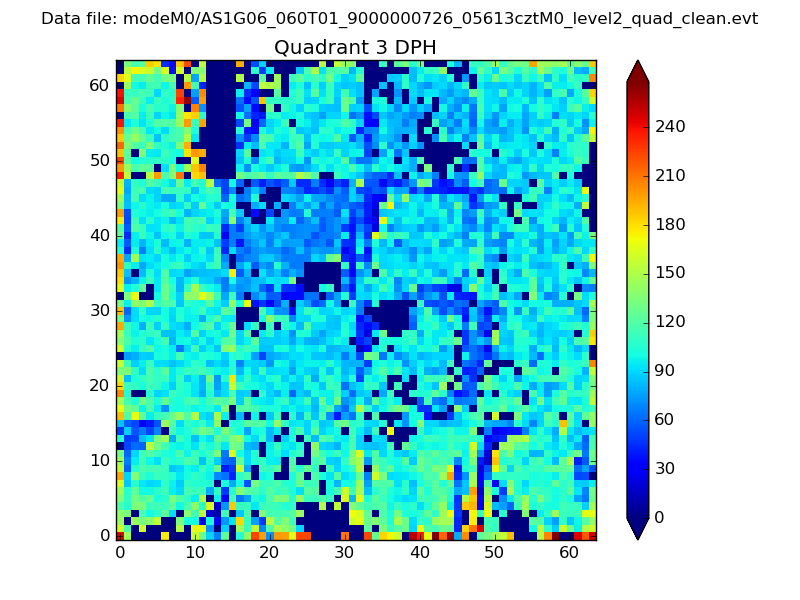 |
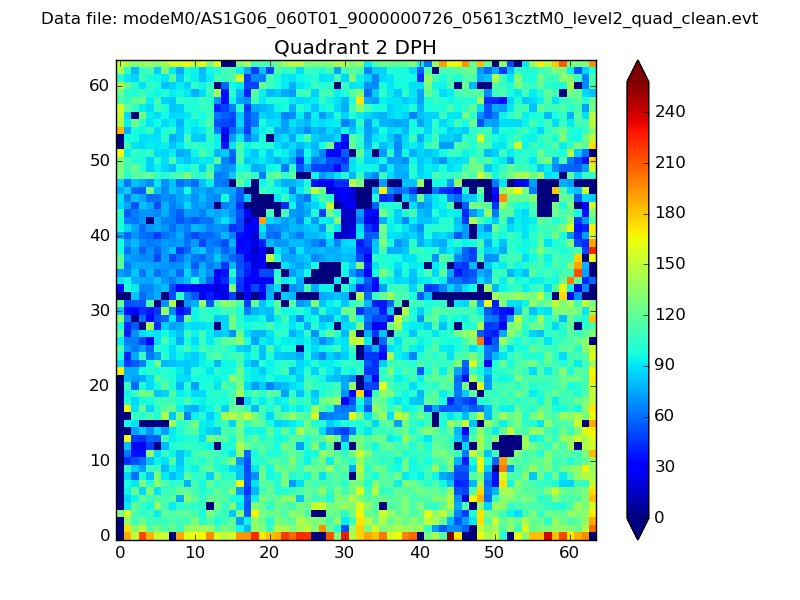 |
Quadrant C |
| Plot type | Count rate plots | Images |
|---|---|---|
| Comparison with Poisson distribution Blue bars denote a histogram of data divided into 1 sec bins. Red curve is a Poisson curve with rate = median count rate of data. |
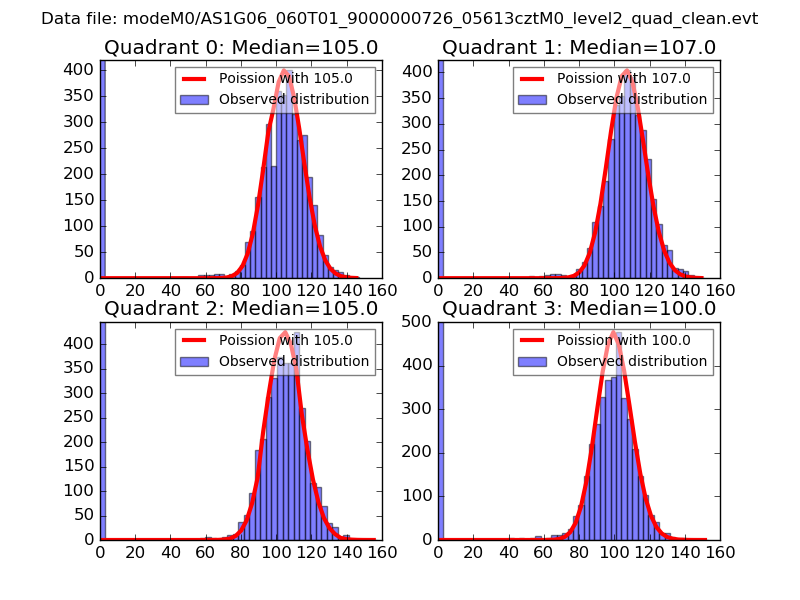 |
 |
| Quadrant-wise count rates Data is divided into 100 sec bins |
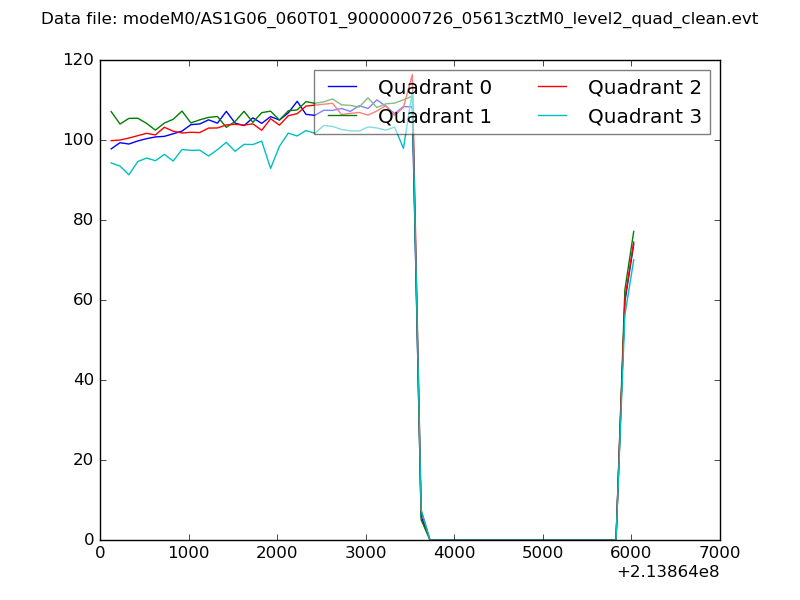 |
|
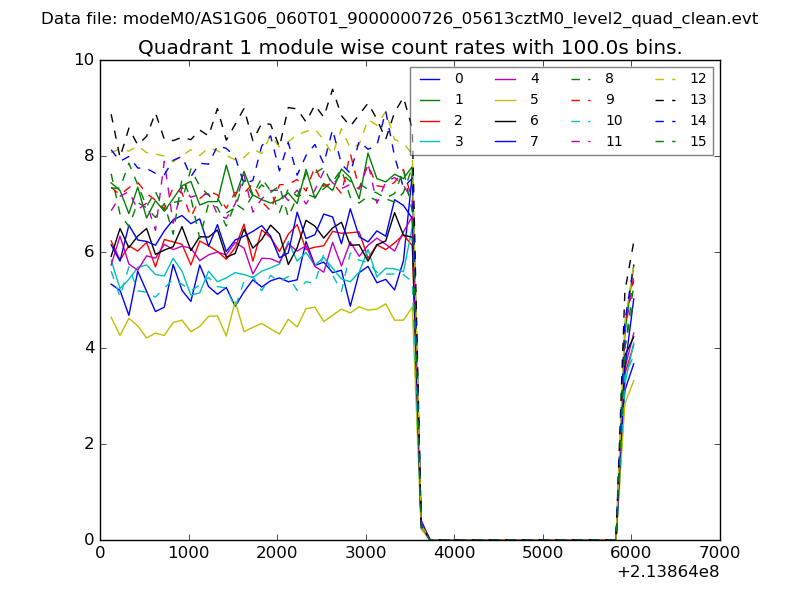
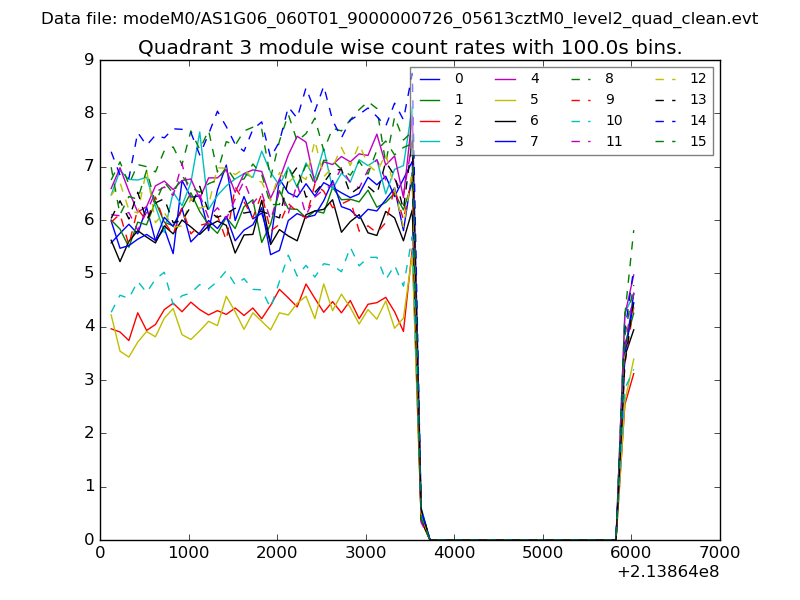
| Module-wise count rates for Quadrant A Data is divided into 100 sec bins |
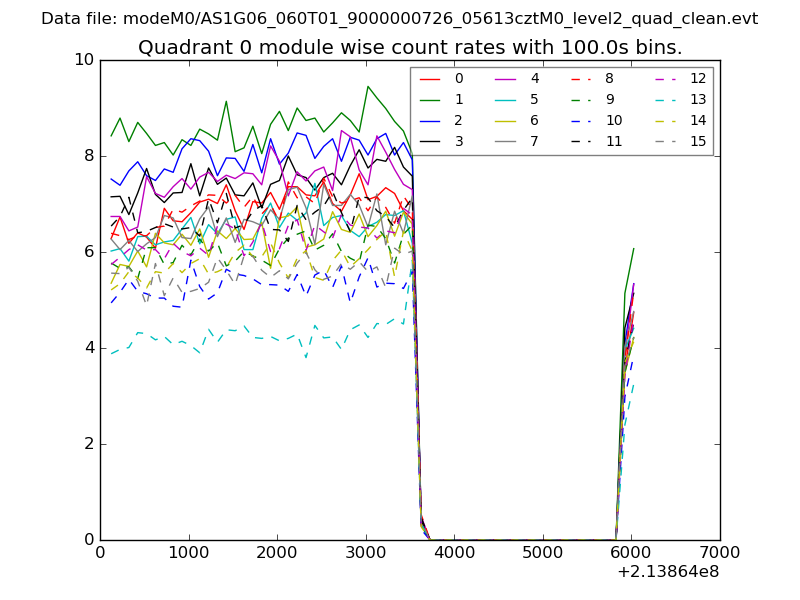 |
 |
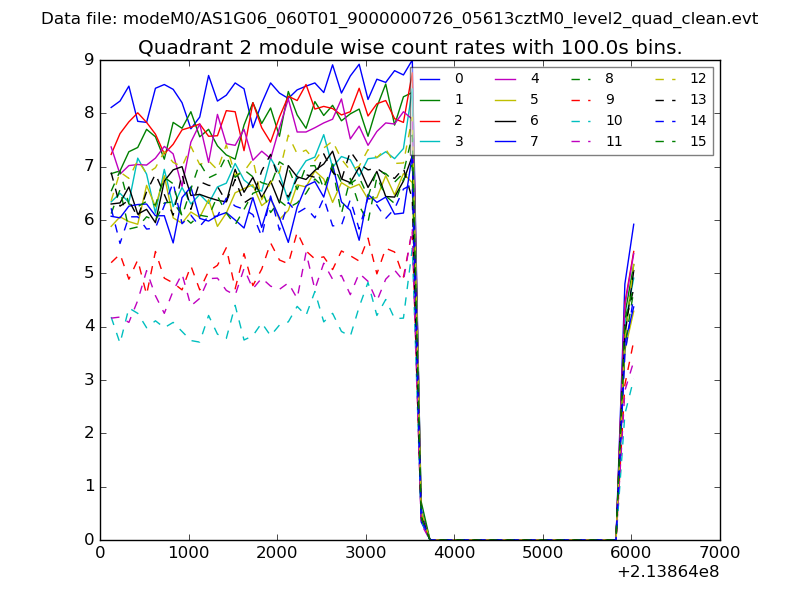
| Module-wise count rates for Quadrant B Data is divided into 100 sec bins |
 |
 |
| Module-wise count rates for Quadrant C Data is divided into 100 sec bins |
 |
 |
| Module-wise count rates for Quadrant D Data is divided into 100 sec bins |
 |
 |
| Parameter | Plot |
|---|---|
| CZT HV Monitor | 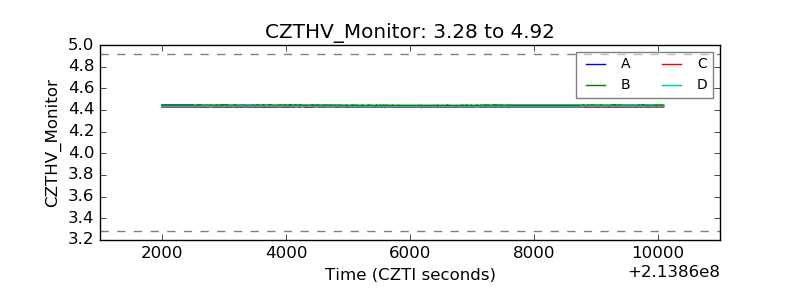 |
| D_VDD | 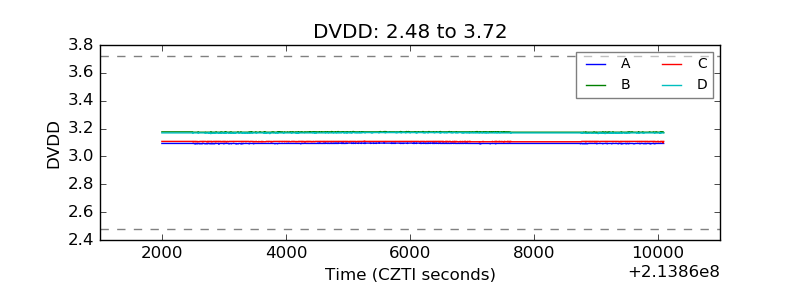 |
| Temperature 1 | 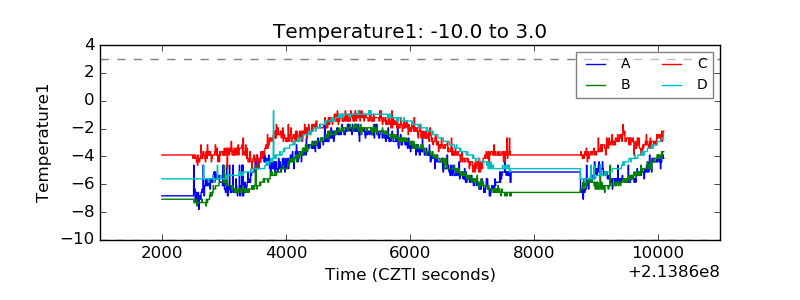 |
| Veto HV Monitor | 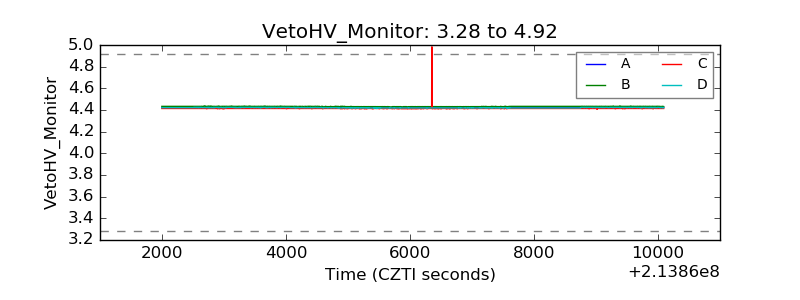 |
| Veto LLD | 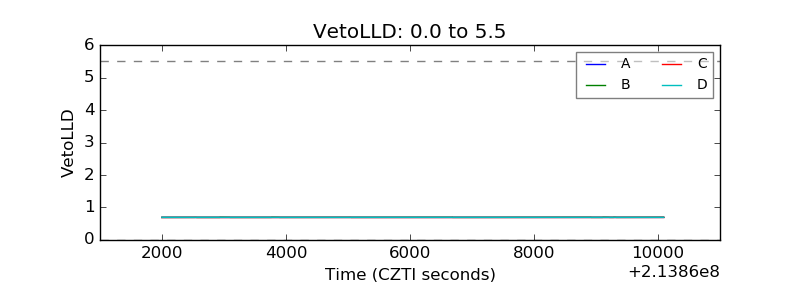 |
| Alpha Counter | 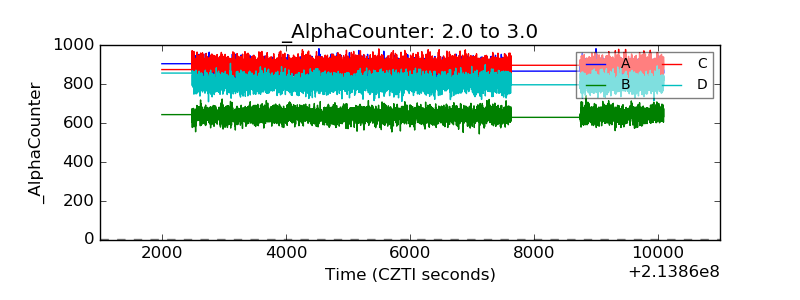 |
| _CPM_Rate | 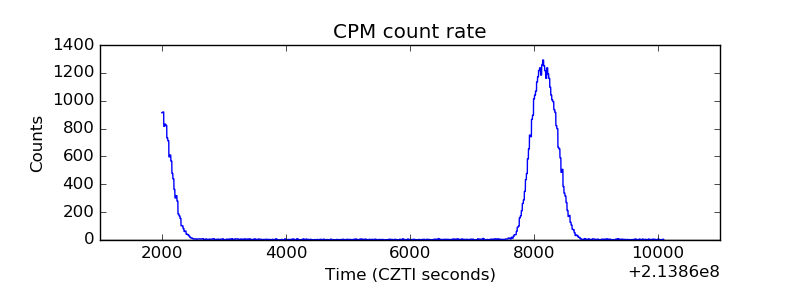 |
| CZT Counter | 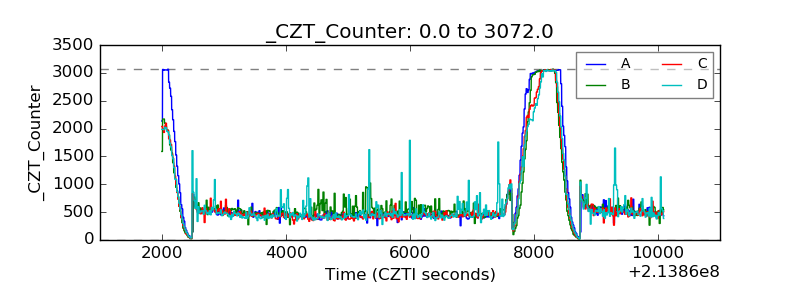 |
| +2.5 Volts monitor |  |
| +5 Volts monitor | 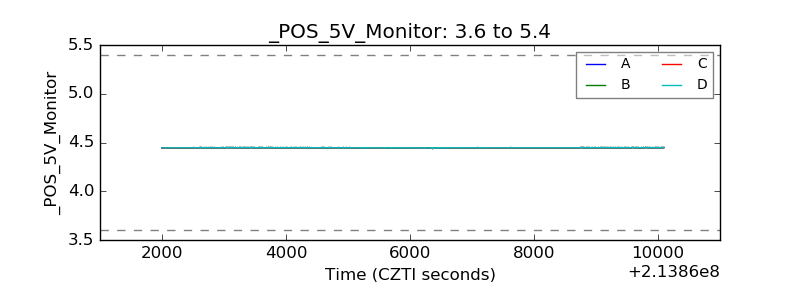 |
| _ROLL_ROT | 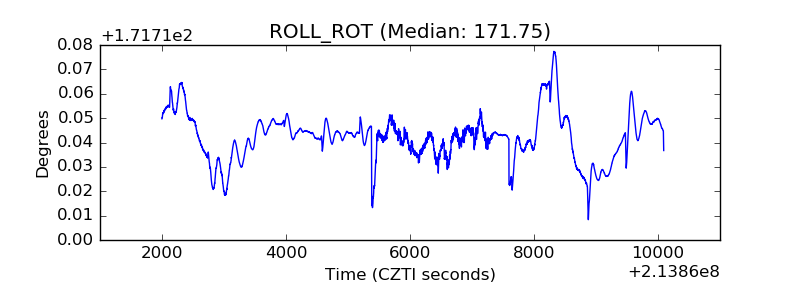 |
| _Roll_DEC | 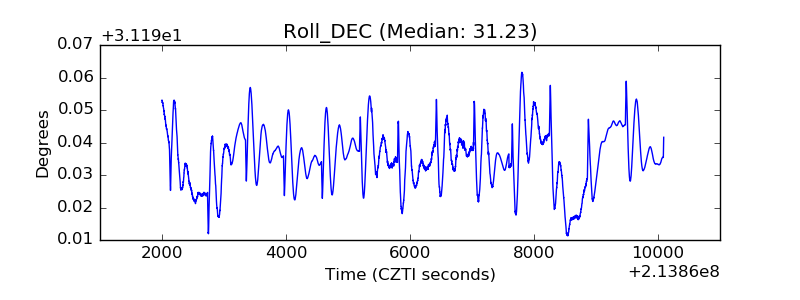 |
| _Roll_RA | 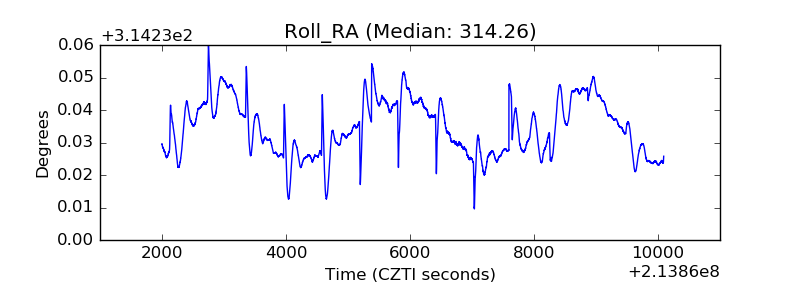 |
| Veto Counter | 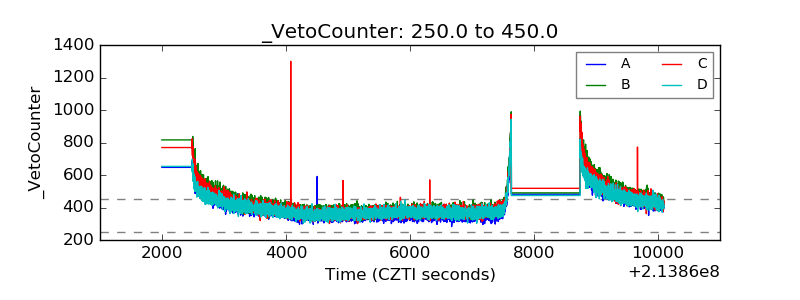 |