| Param | Original file | Final file |
|---|---|---|
| Filename | modeM0/AS1G06_060T01_9000000726_05615cztM0_level2.evt | modeM0/AS1G06_060T01_9000000726_05615cztM0_level2_quad_clean.evt |
| Size (bytes) | 477,483,840 | 83,168,640 |
| Size | 455.4 MB | 79.3 MB |
| Events in quadrant A | 3,342,811 | 530,257 |
| Events in quadrant B | 3,575,242 | 535,229 |
| Events in quadrant C | 3,218,499 | 515,853 |
| Events in quadrant D | 3,883,641 | 485,094 |
| Mode M9 | |||
|---|---|---|---|
| Quadrant | BADHDUFLAG | Total packets | Discarded packets |
| A | 0 | 24 | 0 |
| B | 0 | 24 | 0 |
| C | 0 | 24 | 0 |
| D | 0 | 24 | 0 |
| Mode SS | |||
|---|---|---|---|
| Quadrant | BADHDUFLAG | Total packets | Discarded packets |
| A | 0 | 134 | 0 |
| B | 0 | 134 | 0 |
| C | 0 | 134 | 0 |
| D | 0 | 134 | 0 |
| Mode M0 | |||
|---|---|---|---|
| Quadrant | BADHDUFLAG | Total packets | Discarded packets |
| A | 0 | 13947 | 3 |
| B | 0 | 14566 | 2 |
| C | 0 | 13686 | 2 |
| D | 0 | 15483 | 2 |
| Quadrant | Total seconds | Saturated seconds | Saturation percentage |
|---|---|---|---|
| A | 6479 | 165 | 2.546689% |
| B | 6479 | 172 | 2.654731% |
| C | 6479 | 117 | 1.805834% |
| D | 6479 | 268 | 4.136441% |
Noise dominated data is calculated using 1-second bins in cleaned event files. If a bin has >2000 counts, and if more than 50% of those come from <1% of pixels, then it is considered to be noise-dominated and hence unusable.
| Quadrant | # 1 sec bins | Bins with >0 counts | Bins with >2000 counts | High rate bins dominated by noise | Noise dominated (total time) | Noise dominated (detector-on time) | Marked lightcurve |
|---|---|---|---|---|---|---|---|
| A | 8929 | 6481 | 7 | 7 | 0.08% | 0.11% | 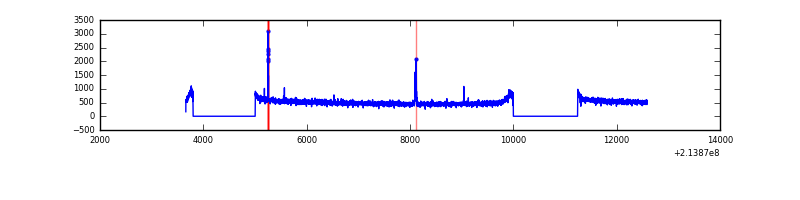 |
| B | 8929 | 6481 | 1 | 1 | 0.01% | 0.02% |  |
| C | 8929 | 6481 | 5 | 5 | 0.06% | 0.08% | 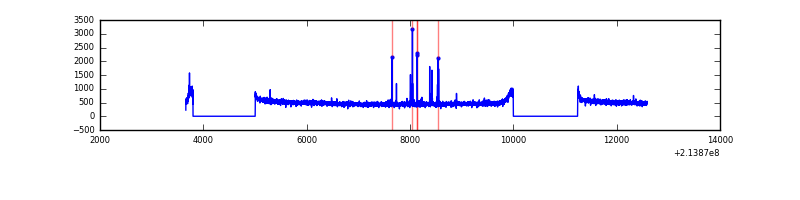 |
| D | 8929 | 6481 | 126 | 126 | 1.41% | 1.94% | 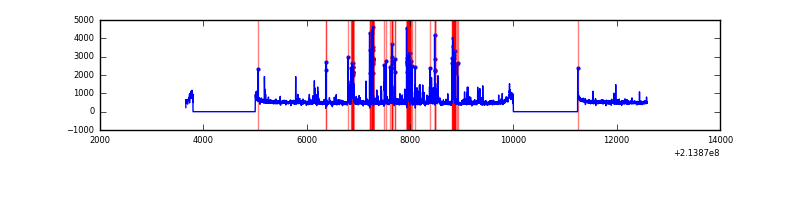 |
Top three noisy pixels from each quadrant. If the there are fewer than three noisy pixels in the level2.evt file, extra rows are filled as -1
| Pixel properties | Quadrant properties | ||||||
|---|---|---|---|---|---|---|---|
| Quadrant | DetID | PixID | Counts | Sigma | Mean | Median | Sigma |
| A | 0 | 50 | 50719 | 287.01 | 851 | 833 | 173.8 |
| A | 13 | 14 | 12934 | 69.62 | 851 | 833 | 173.8 |
| A | 0 | 226 | 8480 | 44.0 | 851 | 833 | 173.8 |
| B | 15 | 204 | 113018 | 691.38 | 853 | 834 | 162.3 |
| B | 4 | 81 | 67915 | 413.41 | 853 | 834 | 162.3 |
| B | 0 | 214 | 44750 | 270.65 | 853 | 834 | 162.3 |
| C | 1 | 16 | 47299 | 248.39 | 811 | 814 | 187.1 |
| C | 12 | 4 | 7464 | 35.53 | 811 | 814 | 187.1 |
| C | 13 | 61 | 6432 | 30.02 | 811 | 814 | 187.1 |
| D | 2 | 136 | 287199 | 1447.3 | 813 | 787 | 197.9 |
| D | 10 | 15 | 254009 | 1279.58 | 813 | 787 | 197.9 |
| D | 2 | 152 | 128101 | 643.34 | 813 | 787 | 197.9 |
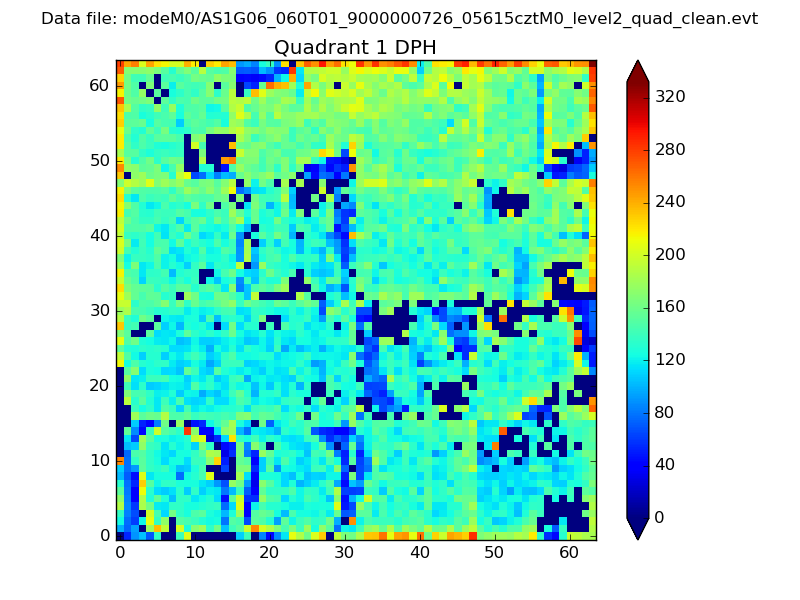
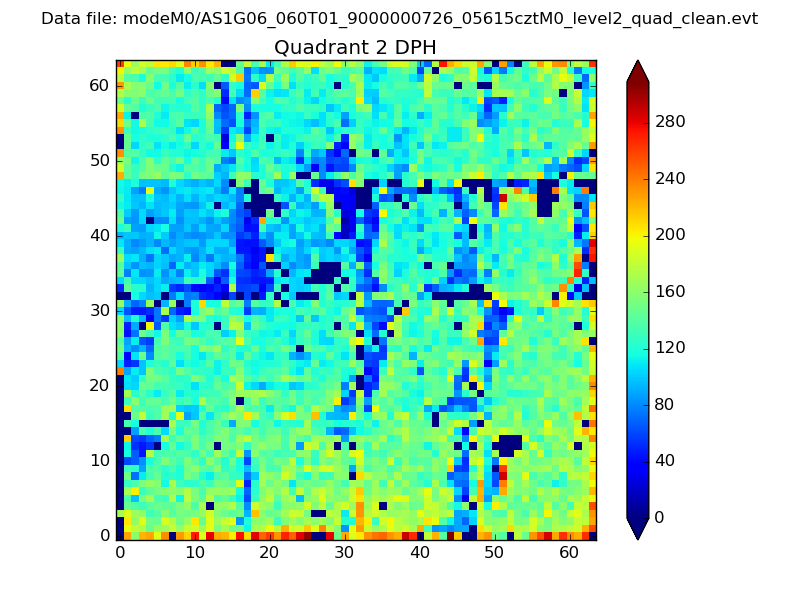
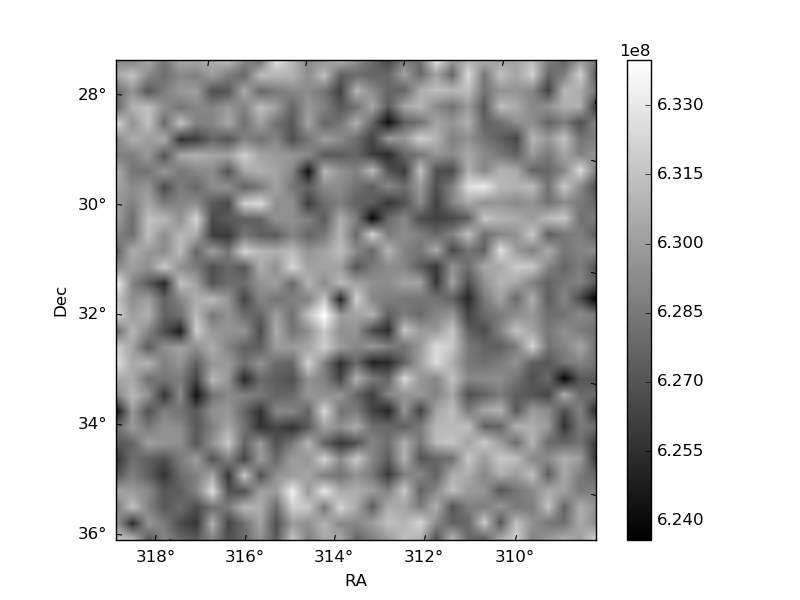
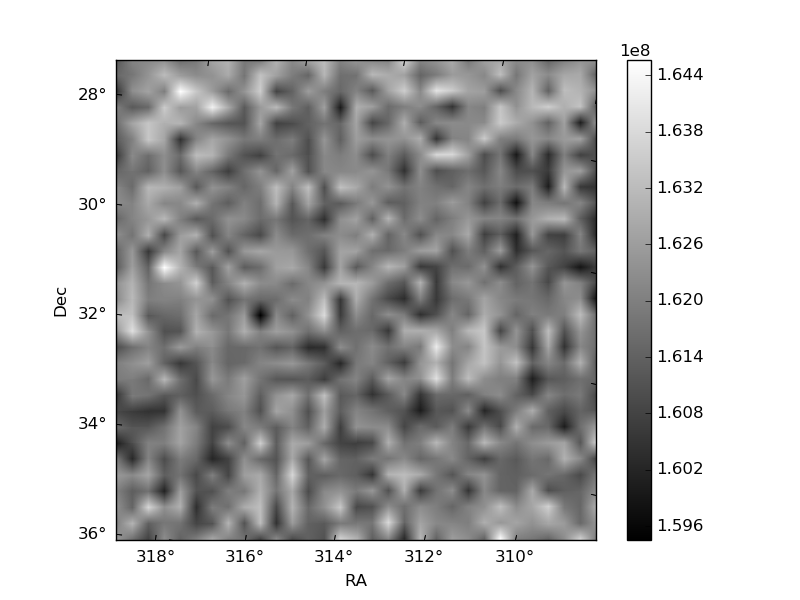
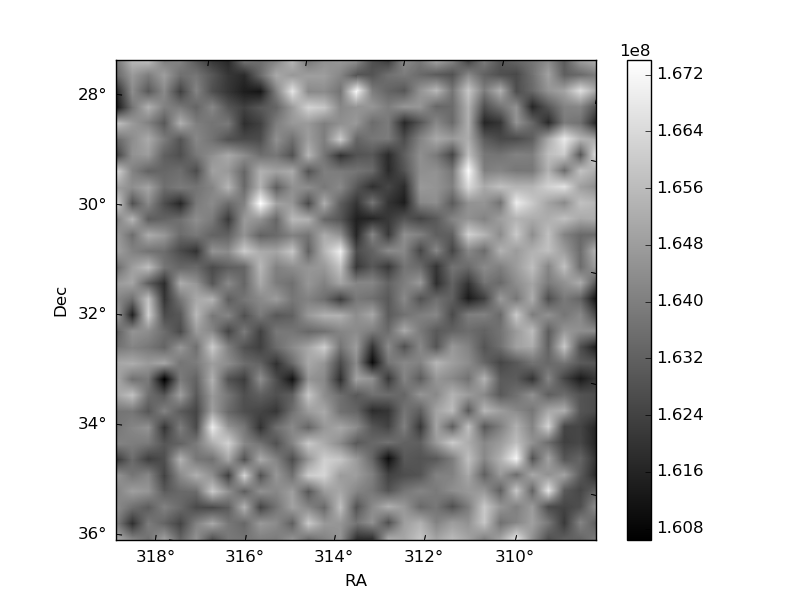
Histogram calculated using DETX and DETY for each event in the final _common_clean file
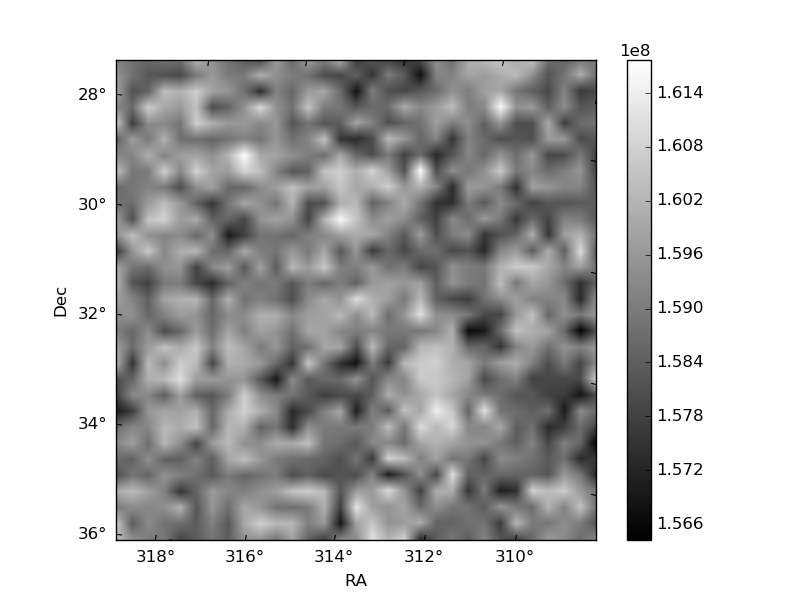
| Quadrant A | 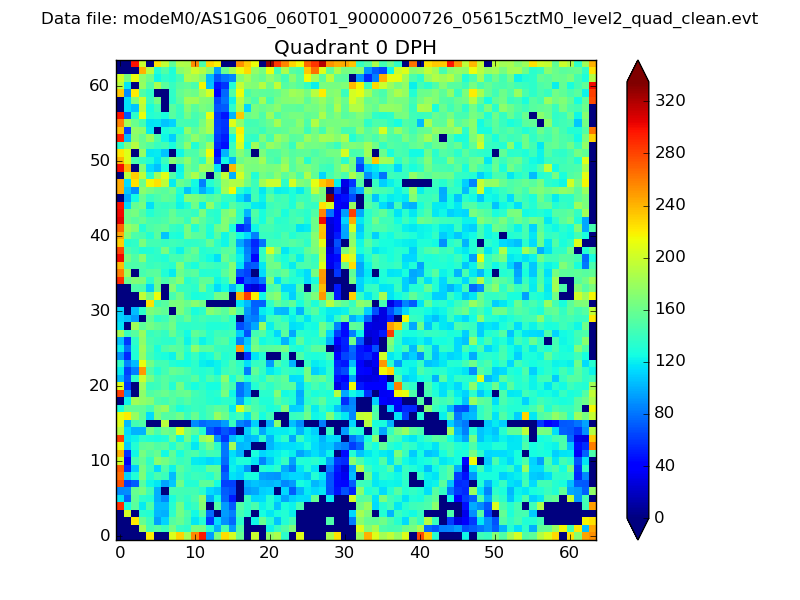 |
 |
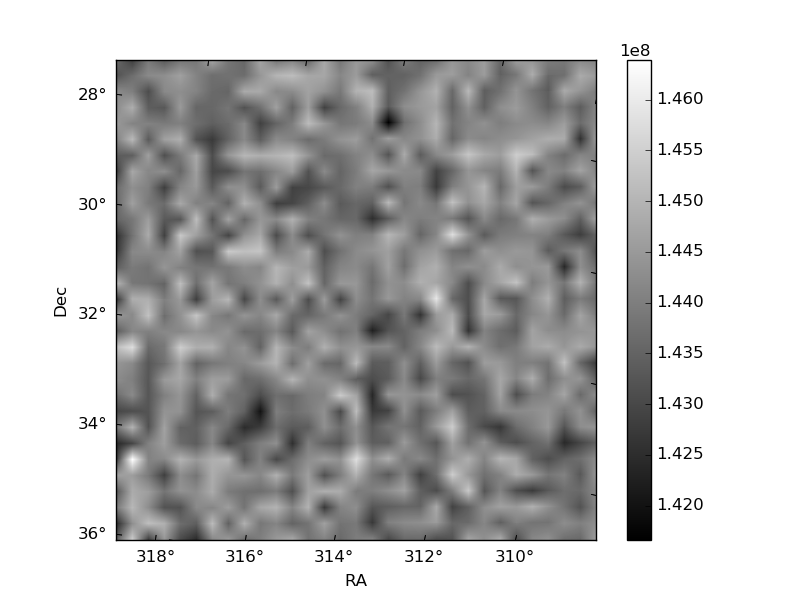
Quadrant B |
|---|---|---|---|
| Quadrant D | 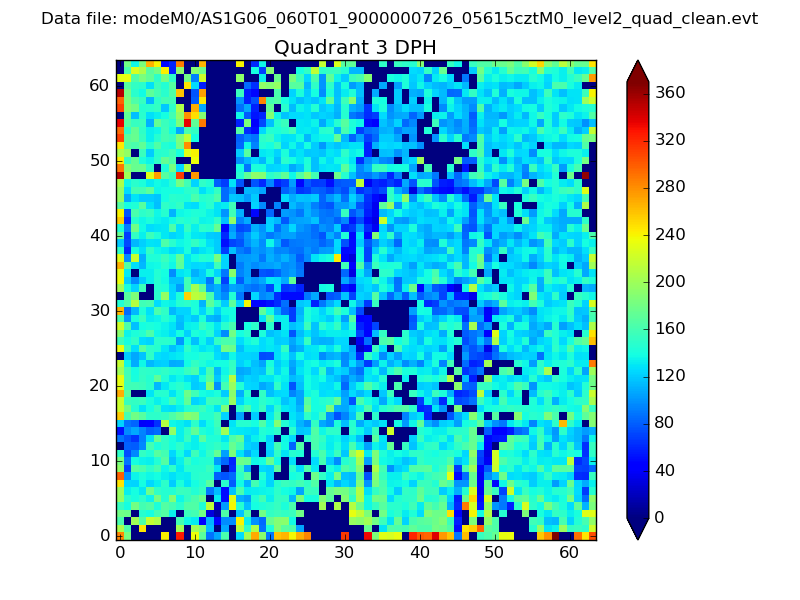 |
 |
Quadrant C |
| Plot type | Count rate plots | Images |
|---|---|---|
| Comparison with Poisson distribution Blue bars denote a histogram of data divided into 1 sec bins. Red curve is a Poisson curve with rate = median count rate of data. |
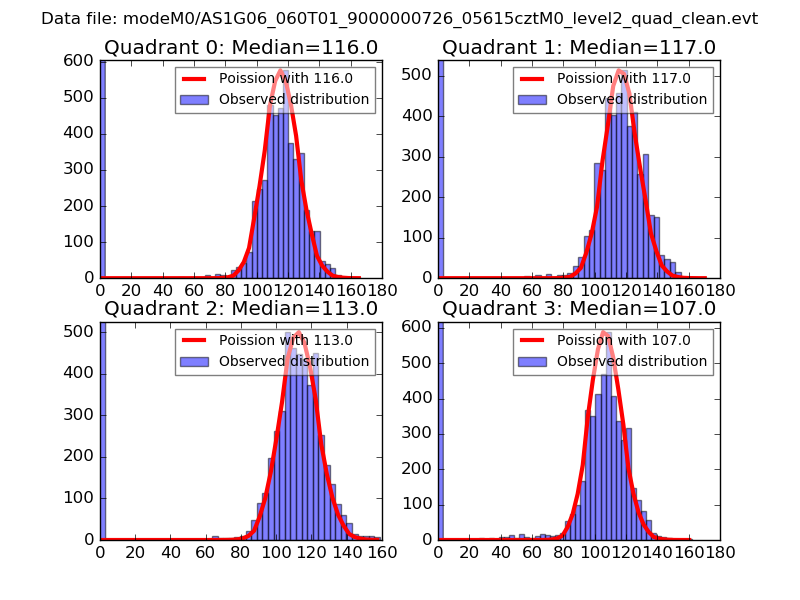 |
 |
| Quadrant-wise count rates Data is divided into 100 sec bins |
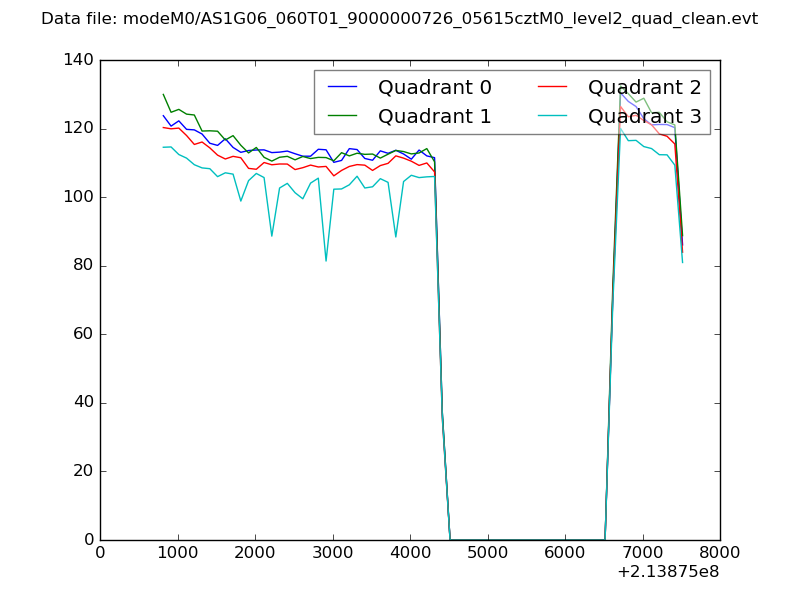 |
|
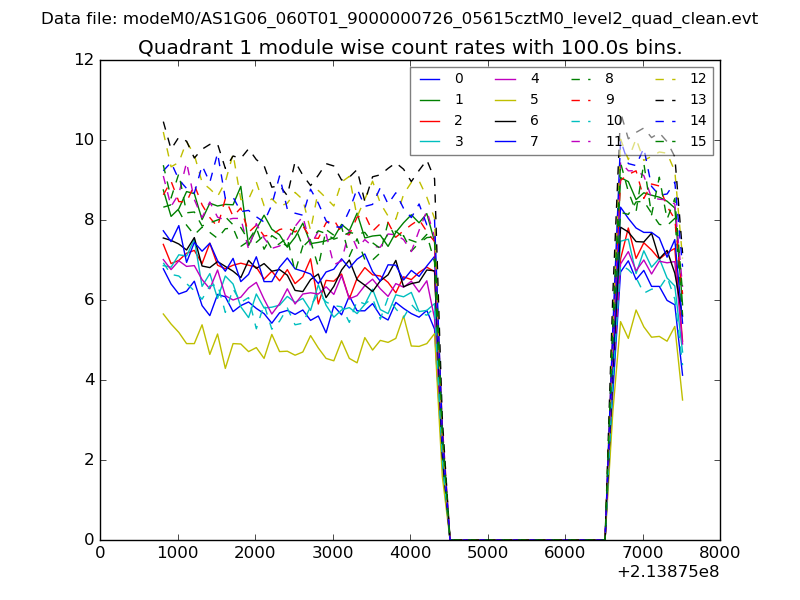
| Module-wise count rates for Quadrant A Data is divided into 100 sec bins |
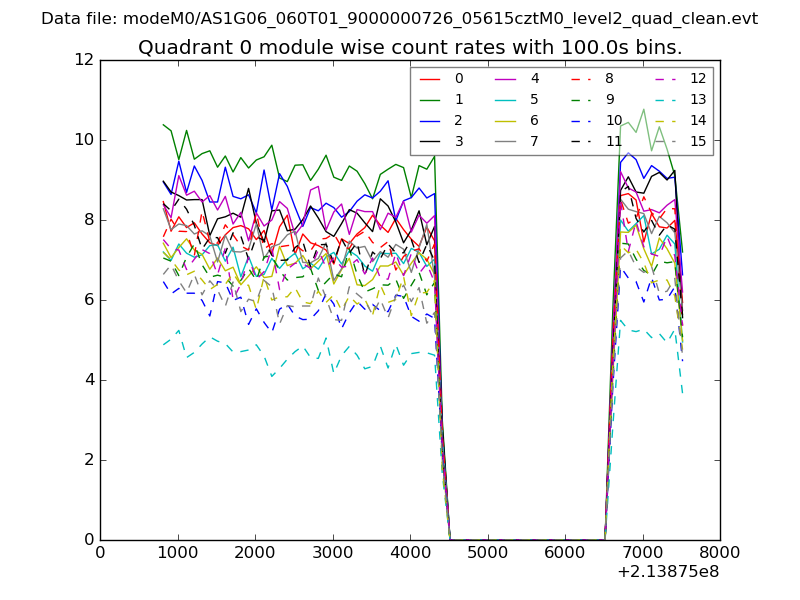 |
 |
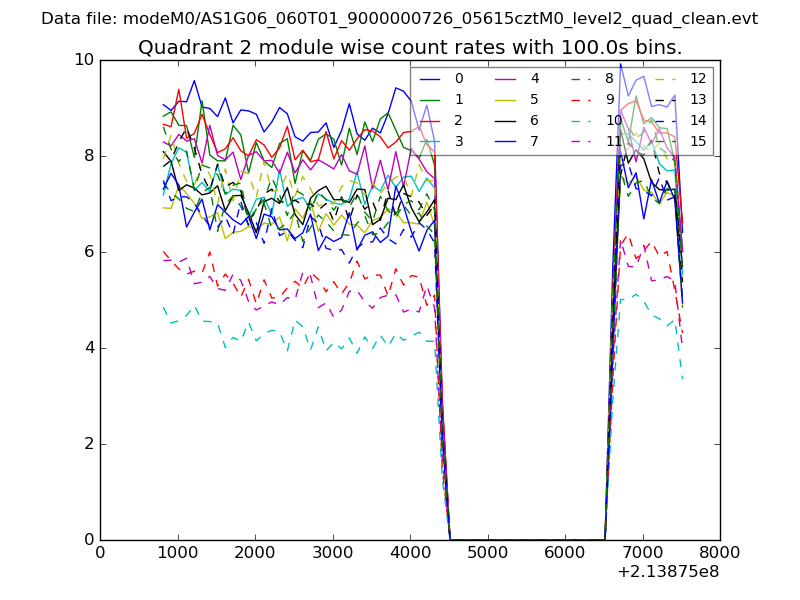
| Module-wise count rates for Quadrant B Data is divided into 100 sec bins |
 |
 |
| Module-wise count rates for Quadrant C Data is divided into 100 sec bins |
 |
 |
| Module-wise count rates for Quadrant D Data is divided into 100 sec bins |
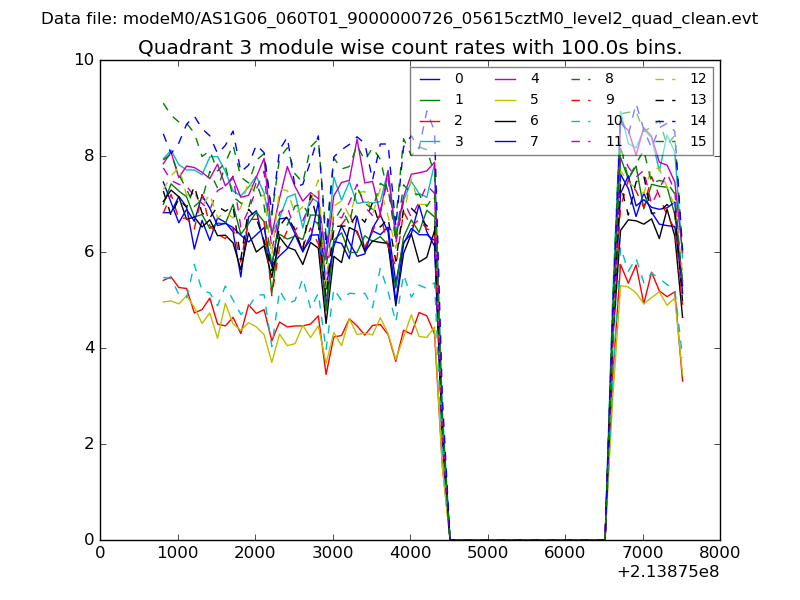 |
 |
| Parameter | Plot |
|---|---|
| CZT HV Monitor | 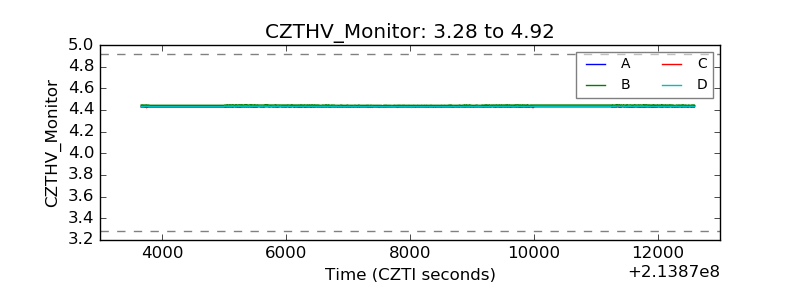 |
| D_VDD | 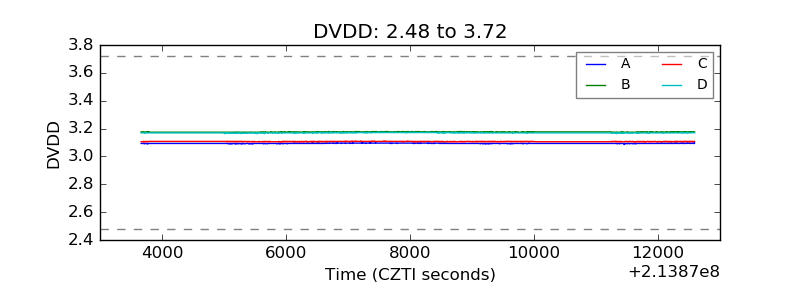 |
| Temperature 1 | 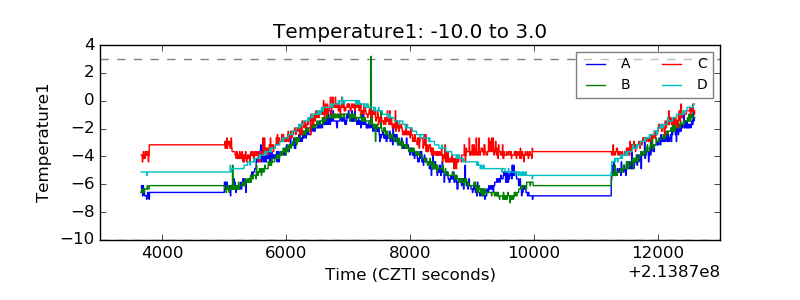 |
| Veto HV Monitor | 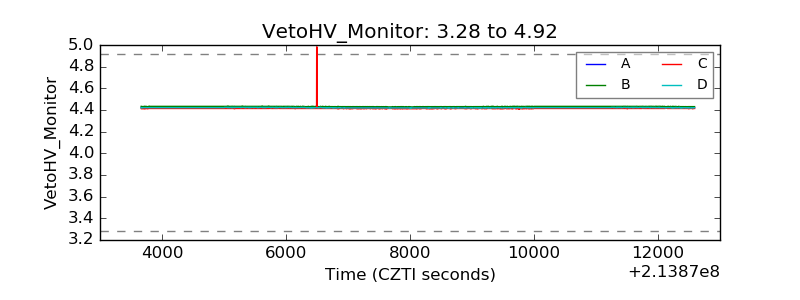 |
| Veto LLD | 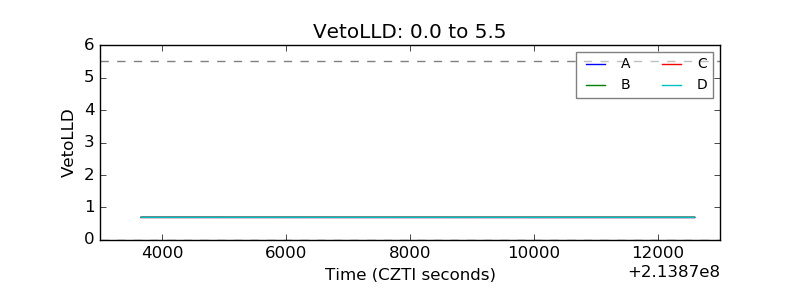 |
| Alpha Counter | 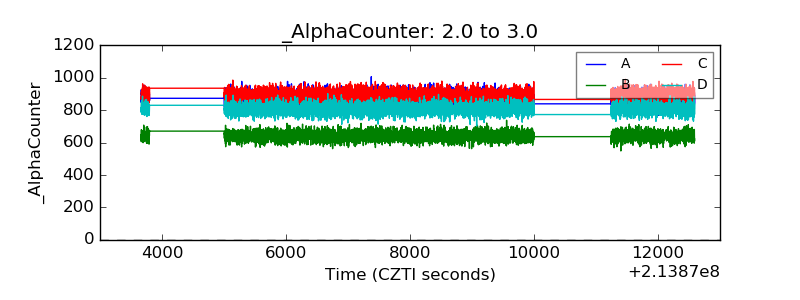 |
| _CPM_Rate | 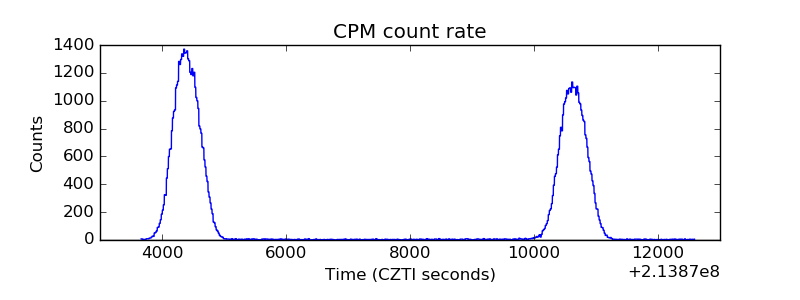 |
| CZT Counter | 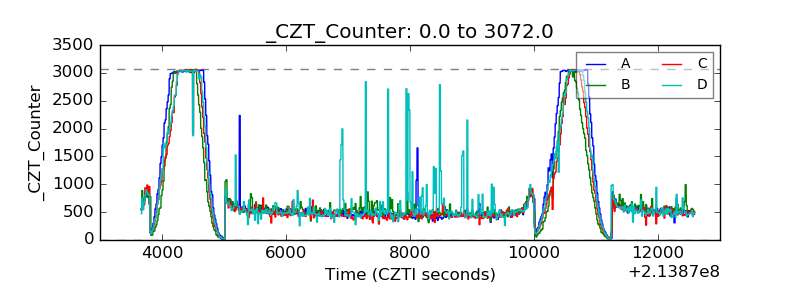 |
| +2.5 Volts monitor |  |
| +5 Volts monitor |  |
| _ROLL_ROT | 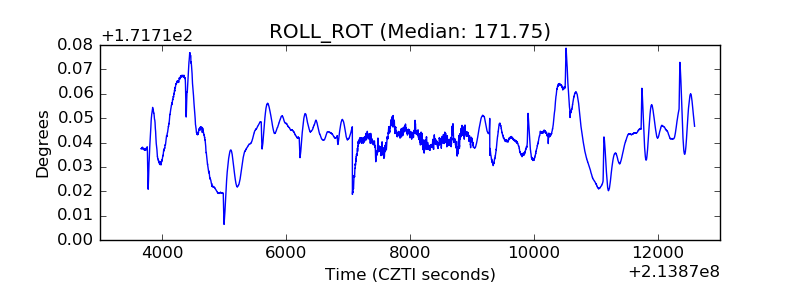 |
| _Roll_DEC | 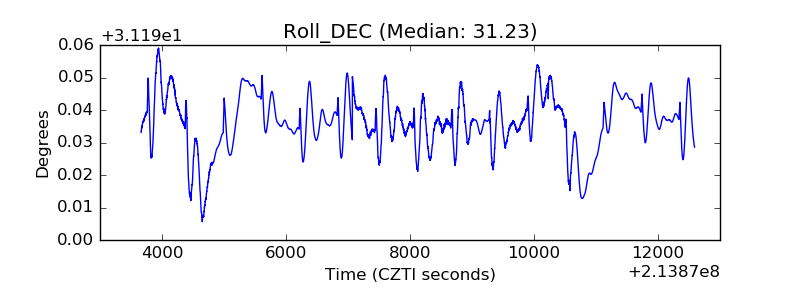 |
| _Roll_RA | 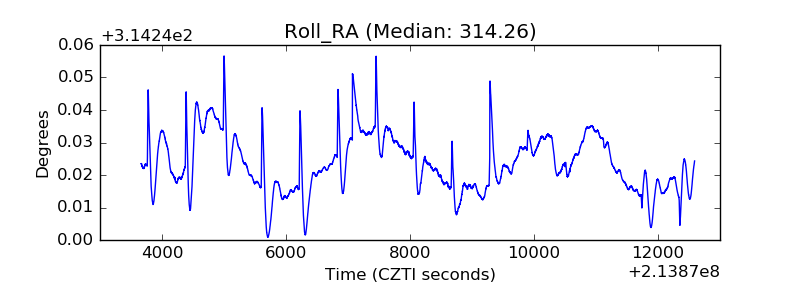 |
| Veto Counter | 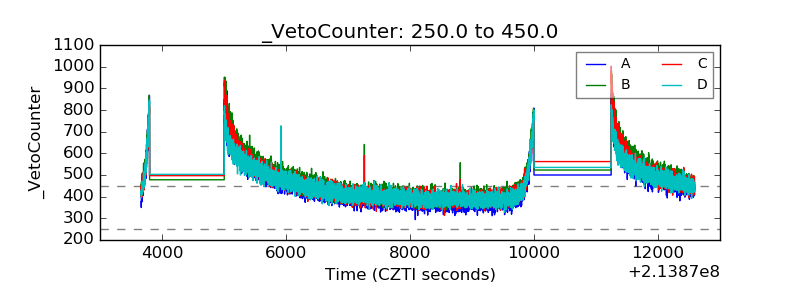 |