| Param | Original file | Final file |
|---|---|---|
| Filename | modeM0/AS1G06_060T01_9000000726_05616cztM0_level2.evt | modeM0/AS1G06_060T01_9000000726_05616cztM0_level2_quad_clean.evt |
| Size (bytes) | 469,880,640 | 88,945,920 |
| Size | 448.1 MB | 84.8 MB |
| Events in quadrant A | 3,191,532 | 576,774 |
| Events in quadrant B | 3,606,794 | 578,631 |
| Events in quadrant C | 3,311,691 | 560,269 |
| Events in quadrant D | 3,688,134 | 534,034 |
| Mode M9 | |||
|---|---|---|---|
| Quadrant | BADHDUFLAG | Total packets | Discarded packets |
| A | 0 | 12 | 0 |
| B | 0 | 12 | 0 |
| C | 0 | 12 | 0 |
| D | 0 | 13 | 0 |
| Mode SS | |||
|---|---|---|---|
| Quadrant | BADHDUFLAG | Total packets | Discarded packets |
| A | 0 | 130 | 0 |
| B | 0 | 130 | 0 |
| C | 0 | 130 | 0 |
| D | 0 | 130 | 0 |
| Mode M0 | |||
|---|---|---|---|
| Quadrant | BADHDUFLAG | Total packets | Discarded packets |
| A | 0 | 13484 | 3 |
| B | 0 | 14868 | 2 |
| C | 0 | 13981 | 2 |
| D | 0 | 14926 | 2 |
| Quadrant | Total seconds | Saturated seconds | Saturation percentage |
|---|---|---|---|
| A | 6358 | 117 | 1.840201% |
| B | 6358 | 143 | 2.249135% |
| C | 6358 | 124 | 1.950299% |
| D | 6358 | 212 | 3.334382% |
Noise dominated data is calculated using 1-second bins in cleaned event files. If a bin has >2000 counts, and if more than 50% of those come from <1% of pixels, then it is considered to be noise-dominated and hence unusable.
| Quadrant | # 1 sec bins | Bins with >0 counts | Bins with >2000 counts | High rate bins dominated by noise | Noise dominated (total time) | Noise dominated (detector-on time) | Marked lightcurve |
|---|---|---|---|---|---|---|---|
| A | 7578 | 6359 | 0 | 0 | 0.00% | 0.00% | 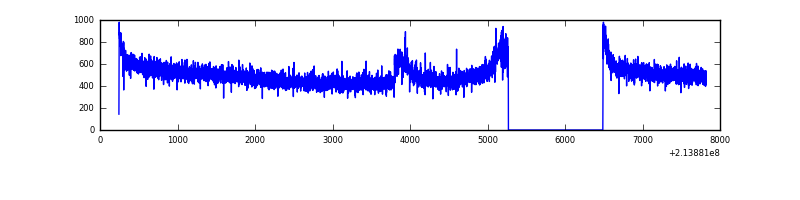 |
| B | 7578 | 6359 | 7 | 7 | 0.09% | 0.11% | 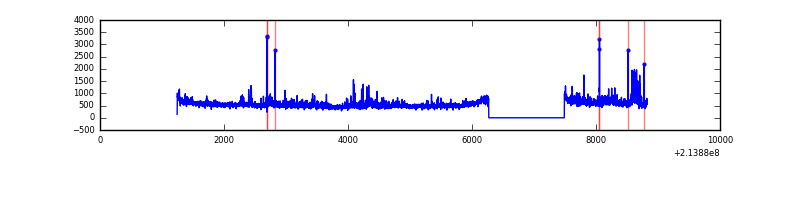 |
| C | 7578 | 6359 | 18 | 18 | 0.24% | 0.28% | 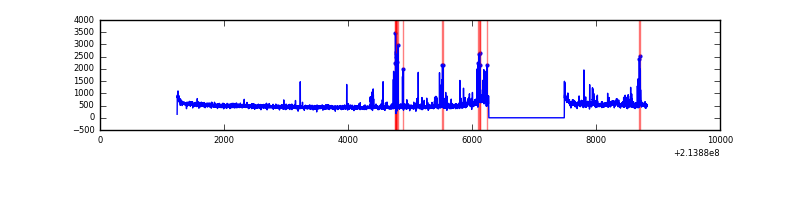 |
| D | 7578 | 6359 | 103 | 103 | 1.36% | 1.62% | 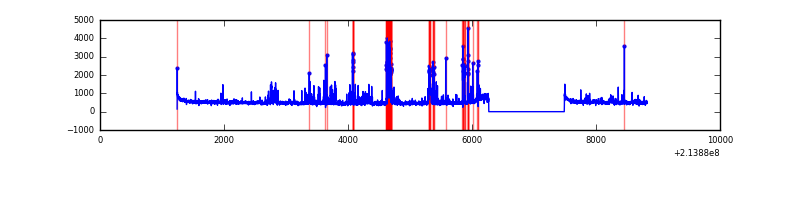 |
Top three noisy pixels from each quadrant. If the there are fewer than three noisy pixels in the level2.evt file, extra rows are filled as -1
| Pixel properties | Quadrant properties | ||||||
|---|---|---|---|---|---|---|---|
| Quadrant | DetID | PixID | Counts | Sigma | Mean | Median | Sigma |
| A | 0 | 149 | 45680 | 272.61 | 813 | 798 | 164.6 |
| A | 0 | 226 | 11658 | 65.96 | 813 | 798 | 164.6 |
| A | 12 | 194 | 8203 | 44.98 | 813 | 798 | 164.6 |
| B | 15 | 204 | 152002 | 968.3 | 812 | 792 | 156.2 |
| B | 0 | 214 | 110865 | 704.87 | 812 | 792 | 156.2 |
| B | 11 | 51 | 98456 | 625.41 | 812 | 792 | 156.2 |
| C | 1 | 16 | 223941 | 1252.41 | 773 | 777 | 178.2 |
| C | 14 | 67 | 62990 | 349.14 | 773 | 777 | 178.2 |
| C | 12 | 4 | 6815 | 33.88 | 773 | 777 | 178.2 |
| D | 2 | 136 | 482572 | 2541.42 | 781 | 759 | 189.6 |
| D | 2 | 152 | 77845 | 406.61 | 781 | 759 | 189.6 |
| D | 8 | 195 | 57058 | 296.96 | 781 | 759 | 189.6 |
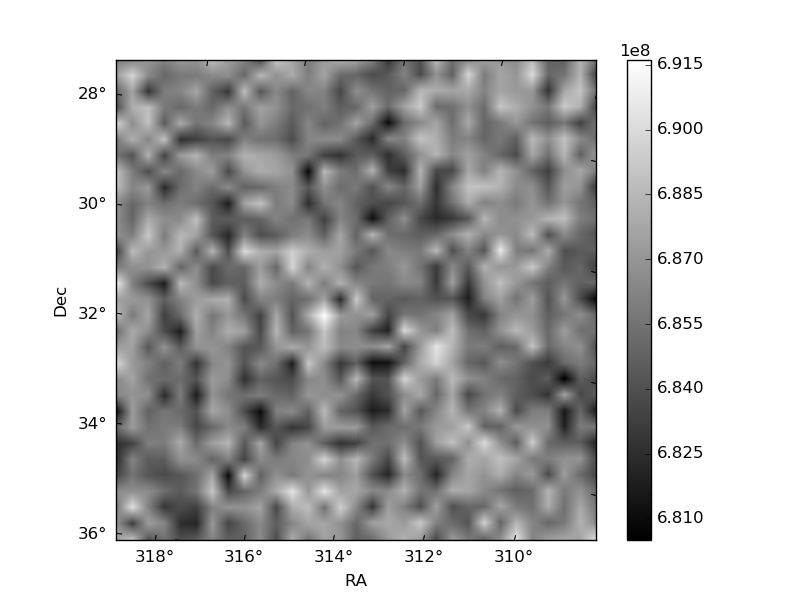
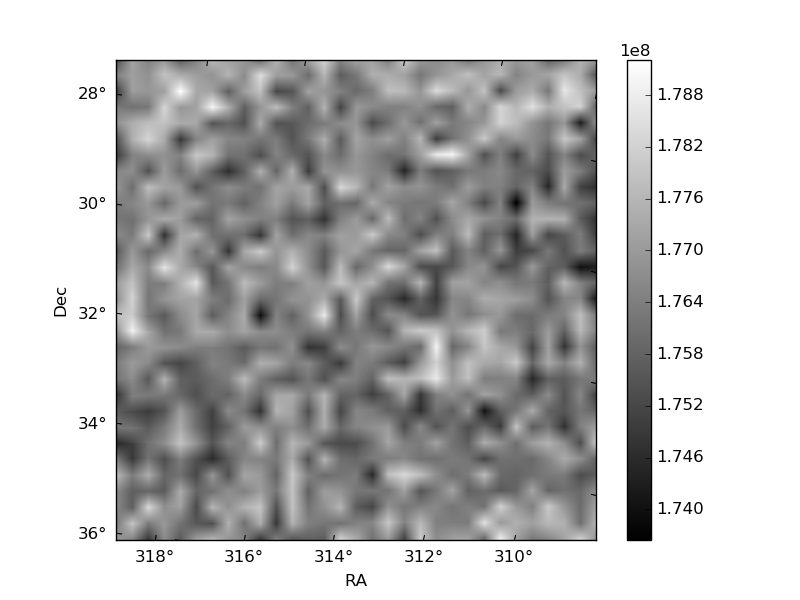
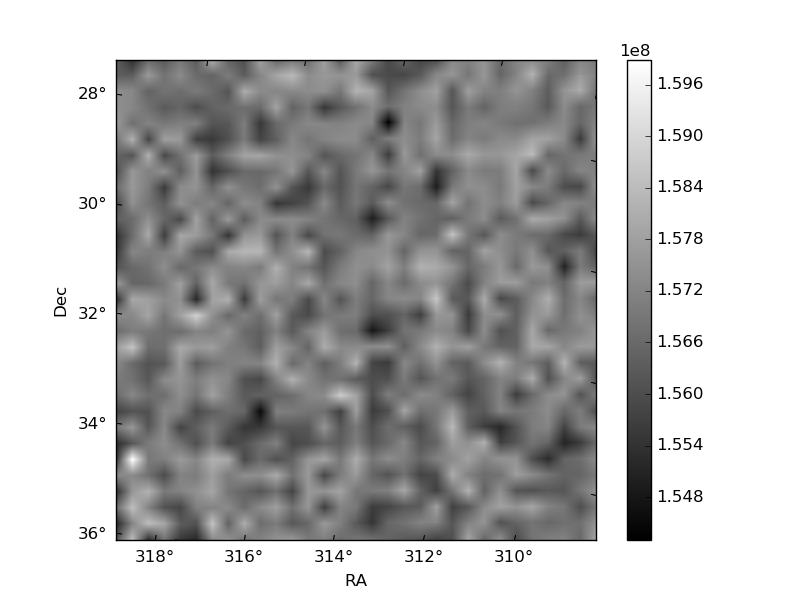
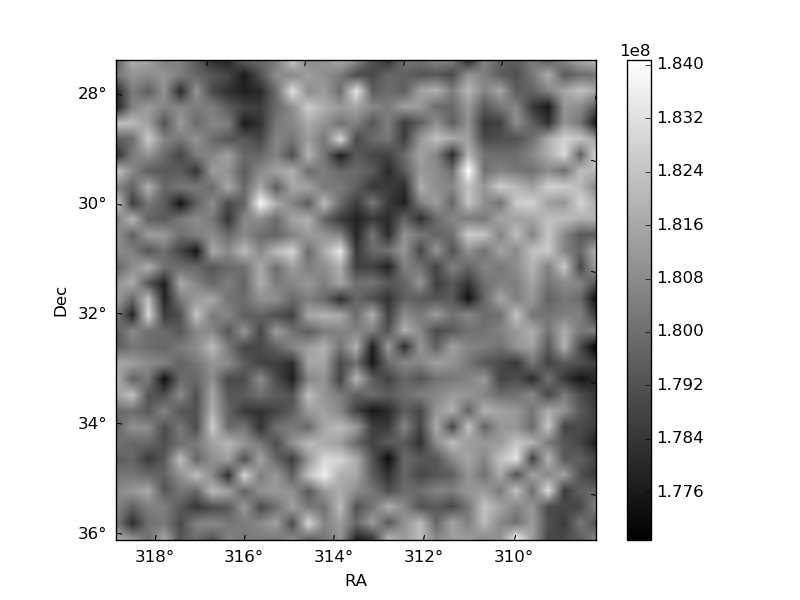
Histogram calculated using DETX and DETY for each event in the final _common_clean file
| Quadrant A | 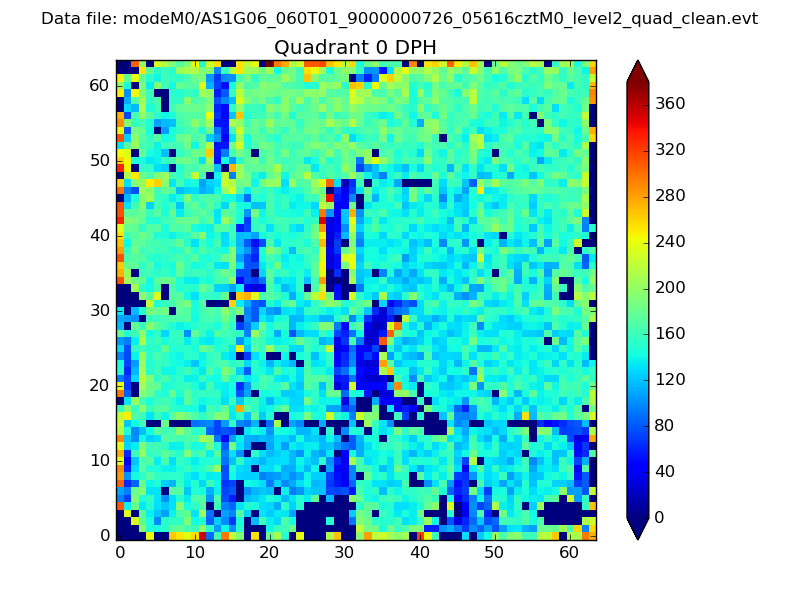 |
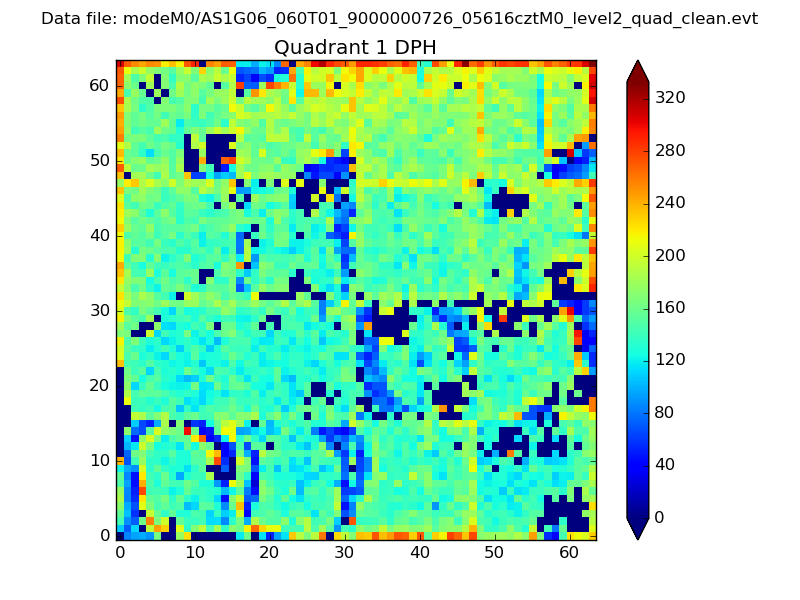 |
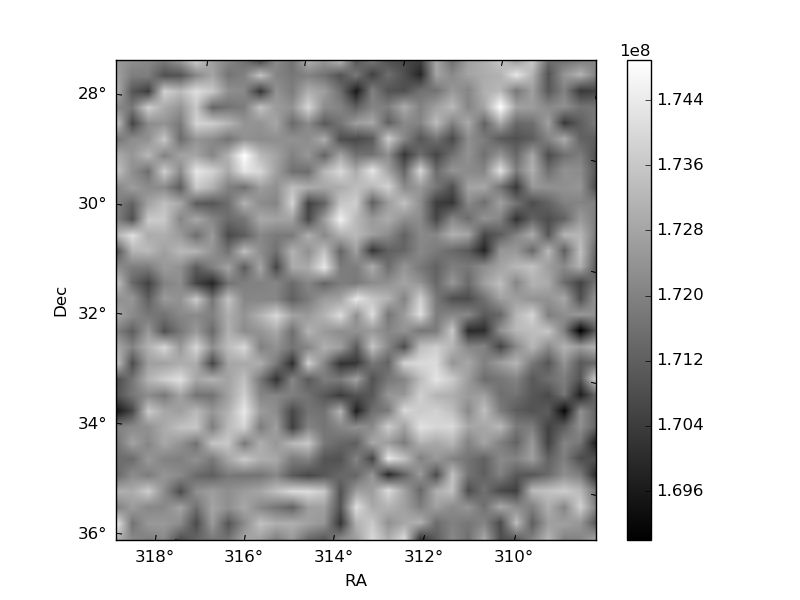
Quadrant B |
|---|---|---|---|
| Quadrant D | 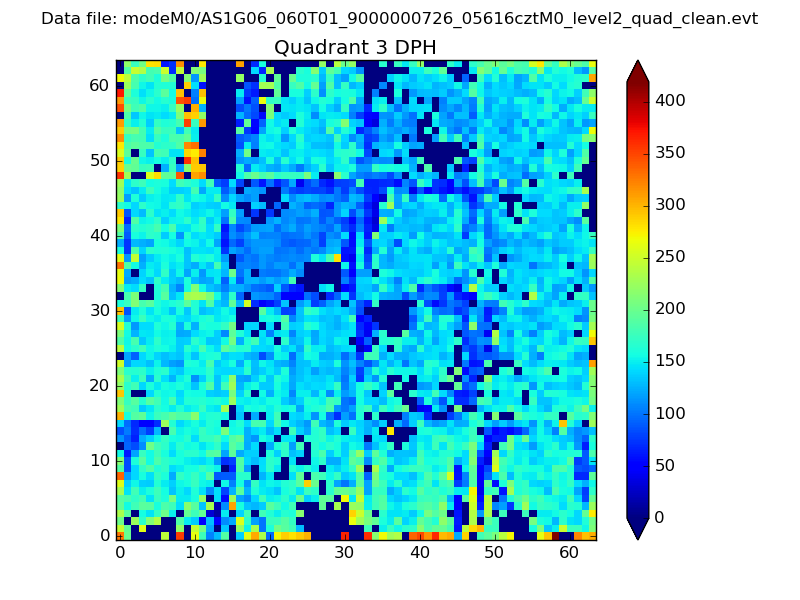 |
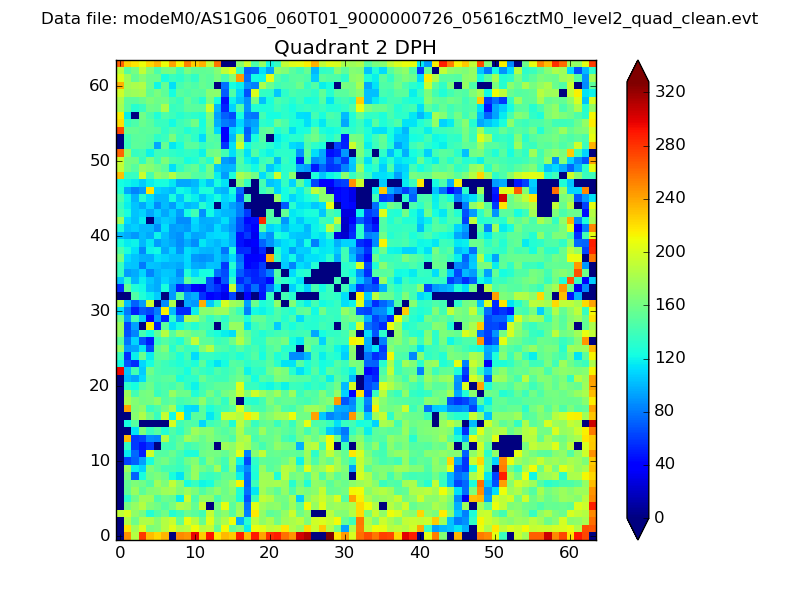 |
Quadrant C |
| Plot type | Count rate plots | Images |
|---|---|---|
| Comparison with Poisson distribution Blue bars denote a histogram of data divided into 1 sec bins. Red curve is a Poisson curve with rate = median count rate of data. |
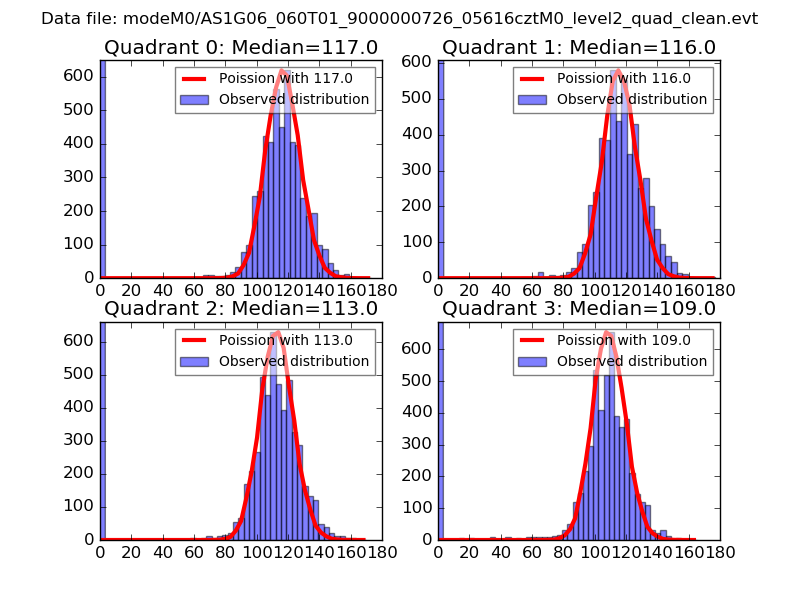 |
 |
| Quadrant-wise count rates Data is divided into 100 sec bins |
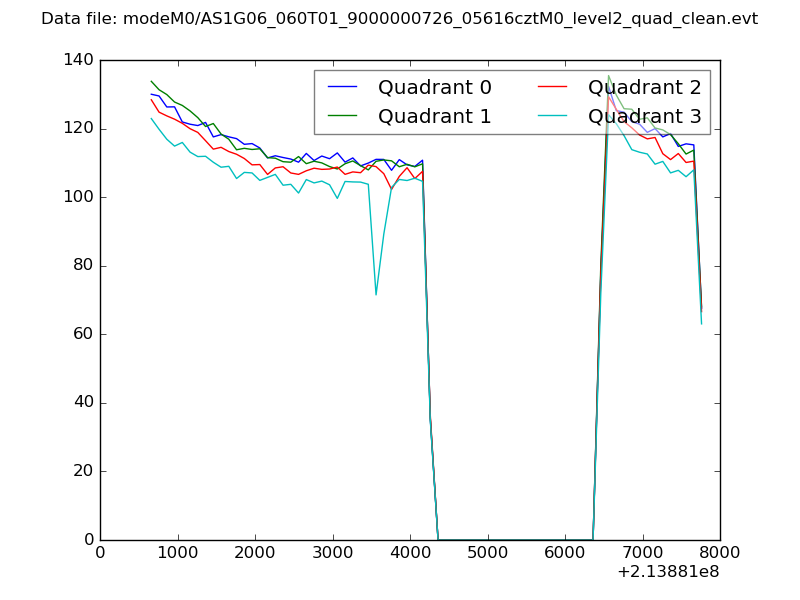 |
|
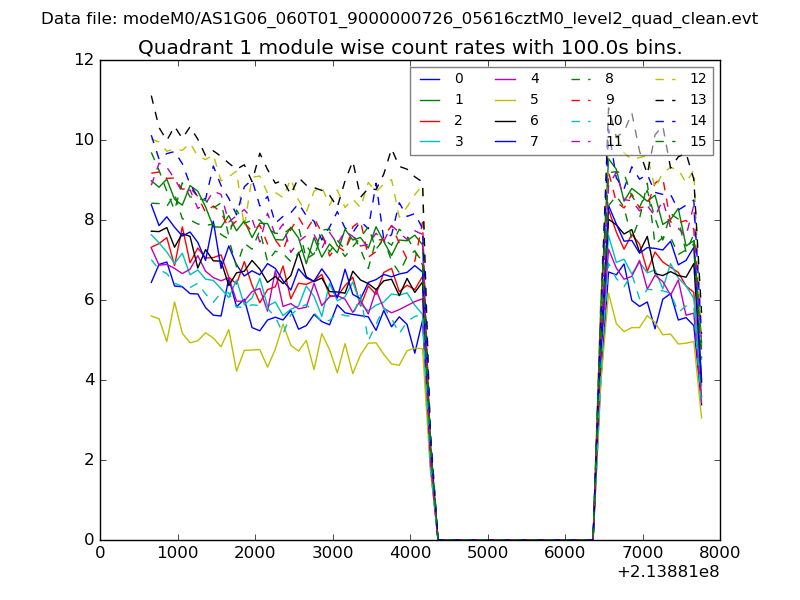
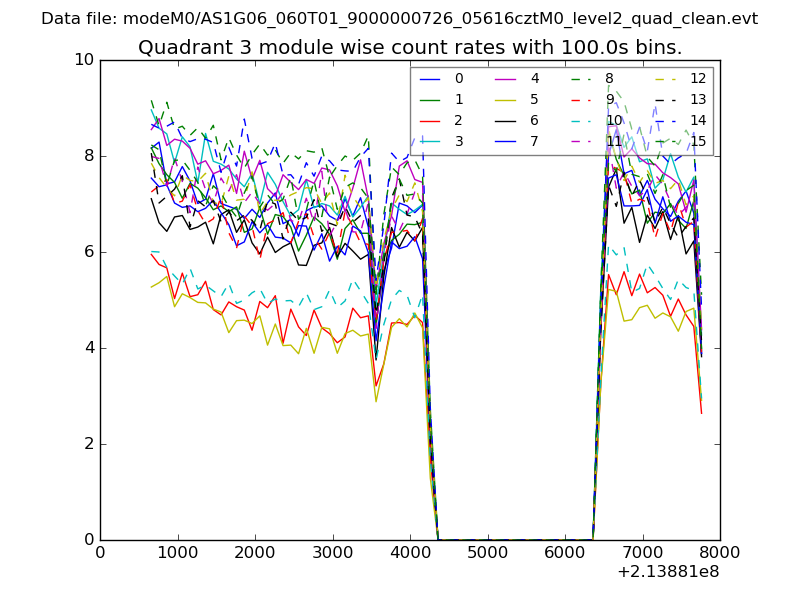
| Module-wise count rates for Quadrant A Data is divided into 100 sec bins |
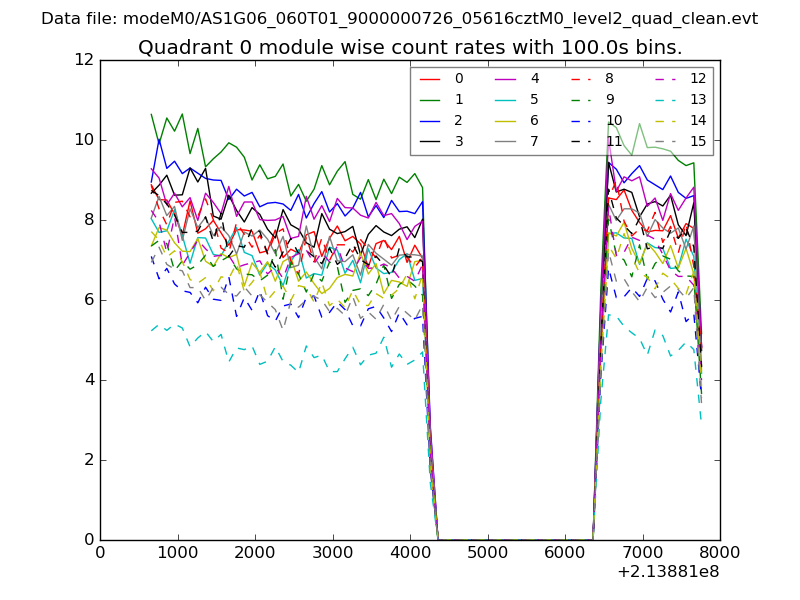 |
 |
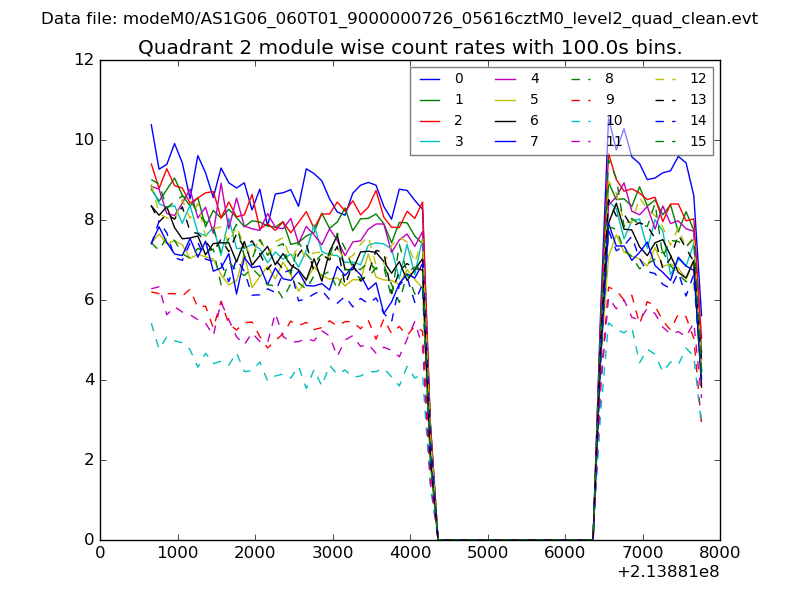
| Module-wise count rates for Quadrant B Data is divided into 100 sec bins |
 |
 |
| Module-wise count rates for Quadrant C Data is divided into 100 sec bins |
 |
 |
| Module-wise count rates for Quadrant D Data is divided into 100 sec bins |
 |
 |
| Parameter | Plot |
|---|---|
| CZT HV Monitor | 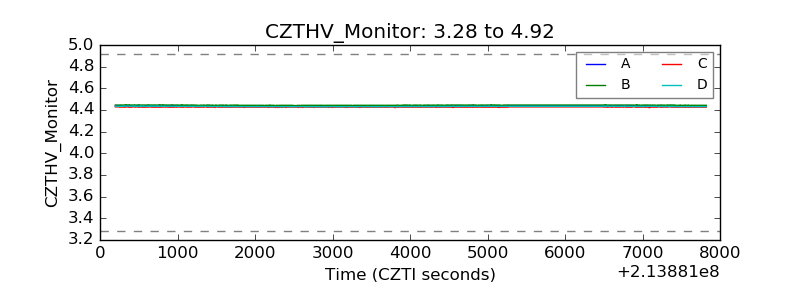 |
| D_VDD | 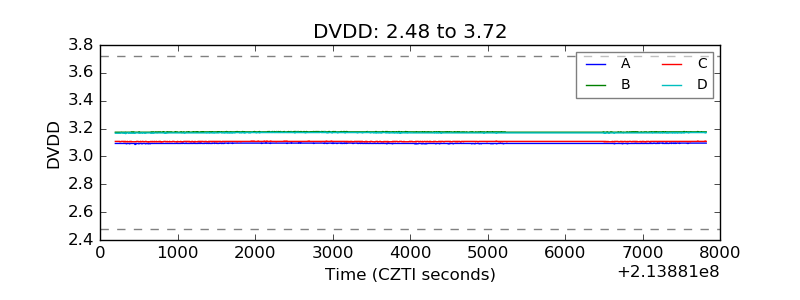 |
| Temperature 1 | 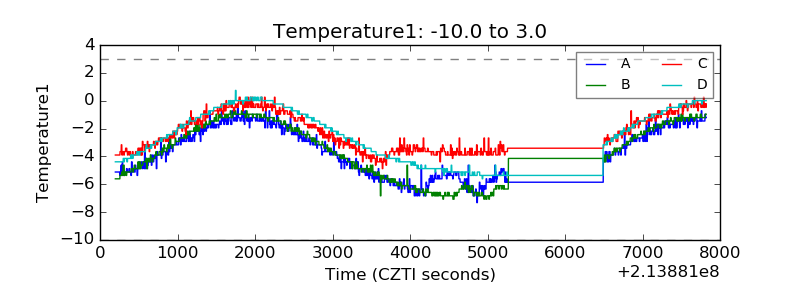 |
| Veto HV Monitor | 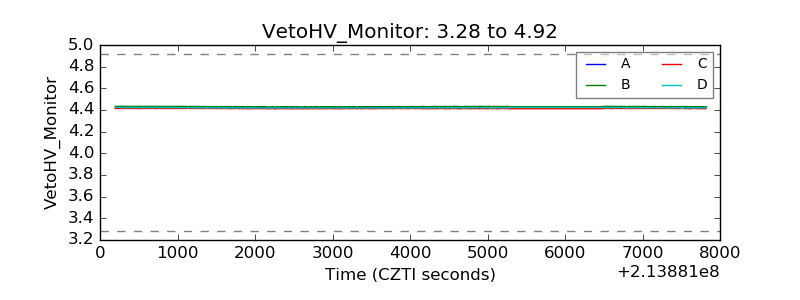 |
| Veto LLD | 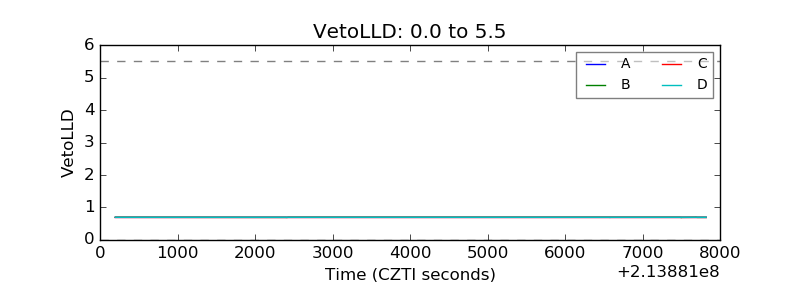 |
| Alpha Counter | 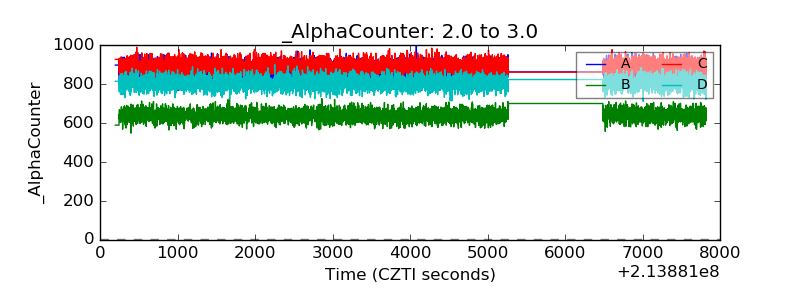 |
| _CPM_Rate | 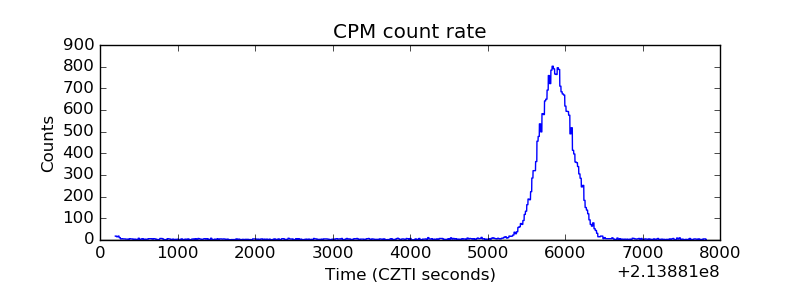 |
| CZT Counter | 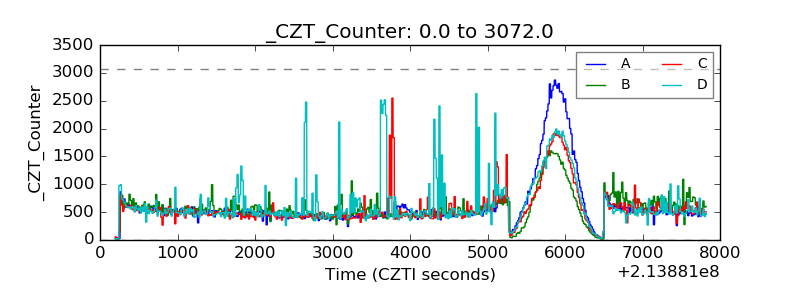 |
| +2.5 Volts monitor |  |
| +5 Volts monitor |  |
| _ROLL_ROT |  |
| _Roll_DEC |  |
| _Roll_RA | 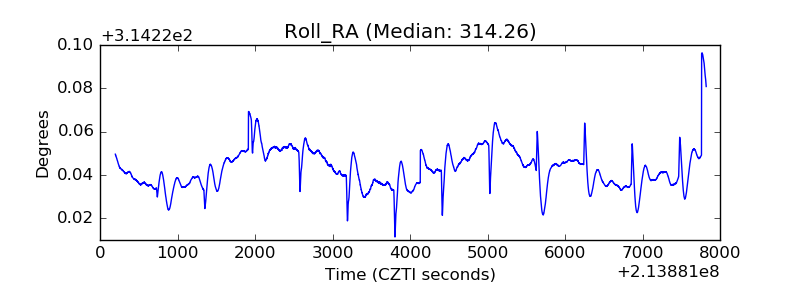 |
| Veto Counter | 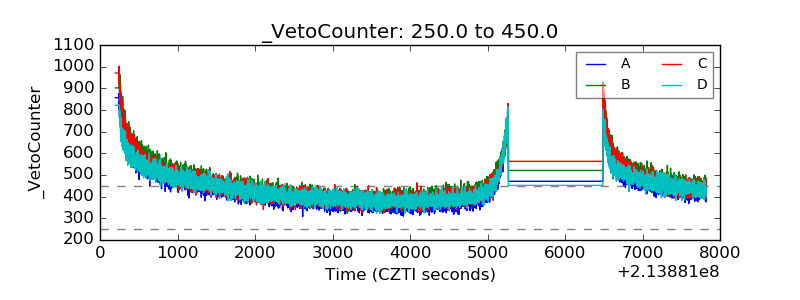 |