| Param | Original file | Final file |
|---|---|---|
| Filename | modeM0/AS1G06_060T01_9000000726_05617cztM0_level2.evt | modeM0/AS1G06_060T01_9000000726_05617cztM0_level2_quad_clean.evt |
| Size (bytes) | 457,136,640 | 84,816,000 |
| Size | 436.0 MB | 80.9 MB |
| Events in quadrant A | 3,018,942 | 541,418 |
| Events in quadrant B | 3,827,376 | 540,995 |
| Events in quadrant C | 3,178,573 | 529,508 |
| Events in quadrant D | 3,385,538 | 511,074 |
| Mode M9 | |||
|---|---|---|---|
| Quadrant | BADHDUFLAG | Total packets | Discarded packets |
| A | 0 | 11 | 0 |
| B | 0 | 11 | 0 |
| C | 0 | 11 | 0 |
| D | 0 | 11 | 0 |
| Mode SS | |||
|---|---|---|---|
| Quadrant | BADHDUFLAG | Total packets | Discarded packets |
| A | 0 | 128 | 0 |
| B | 0 | 128 | 0 |
| C | 0 | 128 | 0 |
| D | 0 | 128 | 0 |
| Mode M0 | |||
|---|---|---|---|
| Quadrant | BADHDUFLAG | Total packets | Discarded packets |
| A | 0 | 13197 | 2 |
| B | 0 | 15601 | 1 |
| C | 0 | 13681 | 1 |
| D | 0 | 14252 | 1 |
| Quadrant | Total seconds | Saturated seconds | Saturation percentage |
|---|---|---|---|
| A | 6389 | 143 | 2.238222% |
| B | 6389 | 183 | 2.864298% |
| C | 6389 | 109 | 1.706057% |
| D | 6389 | 120 | 1.878228% |
Noise dominated data is calculated using 1-second bins in cleaned event files. If a bin has >2000 counts, and if more than 50% of those come from <1% of pixels, then it is considered to be noise-dominated and hence unusable.
| Quadrant | # 1 sec bins | Bins with >0 counts | Bins with >2000 counts | High rate bins dominated by noise | Noise dominated (total time) | Noise dominated (detector-on time) | Marked lightcurve |
|---|---|---|---|---|---|---|---|
| A | 7464 | 6390 | 0 | 0 | 0.00% | 0.00% | 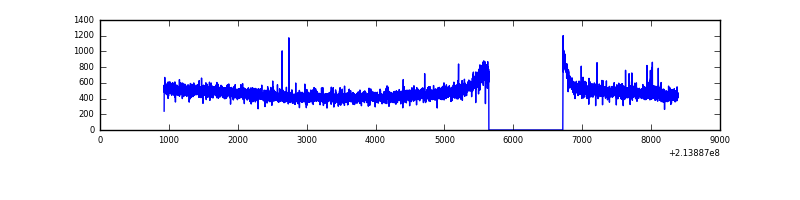 |
| B | 7464 | 6390 | 46 | 46 | 0.62% | 0.72% | 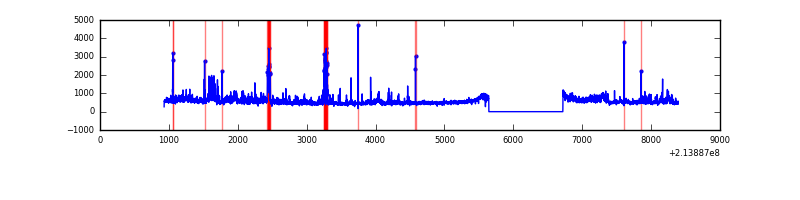 |
| C | 7464 | 6390 | 12 | 12 | 0.16% | 0.19% | 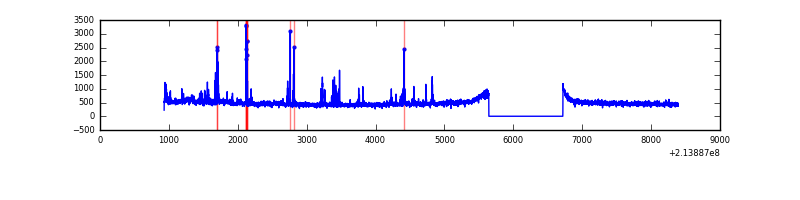 |
| D | 7464 | 6390 | 10 | 10 | 0.13% | 0.16% | 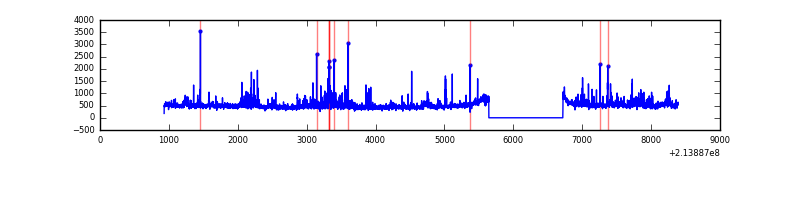 |
Top three noisy pixels from each quadrant. If the there are fewer than three noisy pixels in the level2.evt file, extra rows are filled as -1
| Pixel properties | Quadrant properties | ||||||
|---|---|---|---|---|---|---|---|
| Quadrant | DetID | PixID | Counts | Sigma | Mean | Median | Sigma |
| A | 12 | 194 | 7835 | 44.42 | 779 | 761 | 159.2 |
| A | 0 | 226 | 7676 | 43.42 | 779 | 761 | 159.2 |
| A | 13 | 251 | 7146 | 40.09 | 779 | 761 | 159.2 |
| B | 15 | 204 | 405569 | 2731.9 | 775 | 757 | 148.2 |
| B | 4 | 81 | 119585 | 801.91 | 775 | 757 | 148.2 |
| B | 4 | 48 | 93170 | 623.65 | 775 | 757 | 148.2 |
| C | 1 | 16 | 147411 | 846.53 | 749 | 753 | 173.2 |
| C | 14 | 67 | 80493 | 460.27 | 749 | 753 | 173.2 |
| C | 9 | 232 | 24937 | 139.59 | 749 | 753 | 173.2 |
| D | 2 | 136 | 278036 | 1491.75 | 759 | 736 | 185.9 |
| D | 2 | 152 | 52642 | 279.23 | 759 | 736 | 185.9 |
| D | 10 | 15 | 46951 | 248.62 | 759 | 736 | 185.9 |
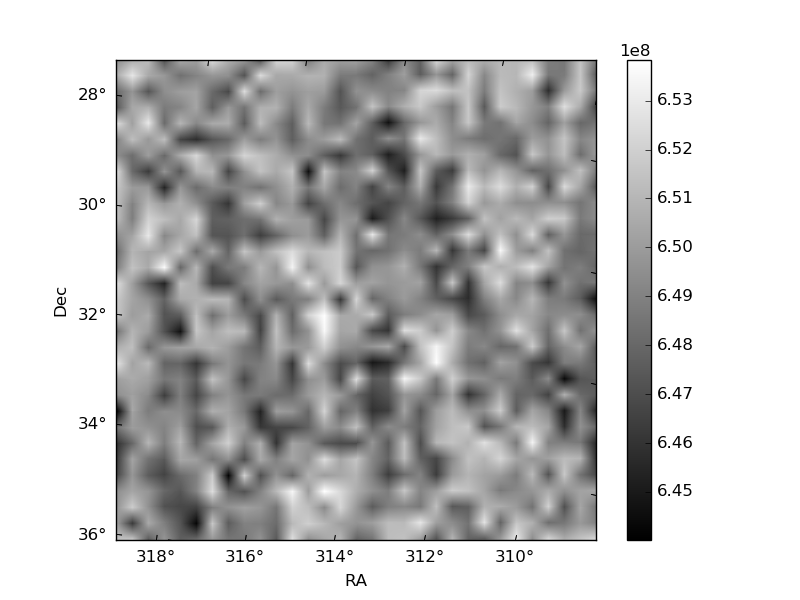
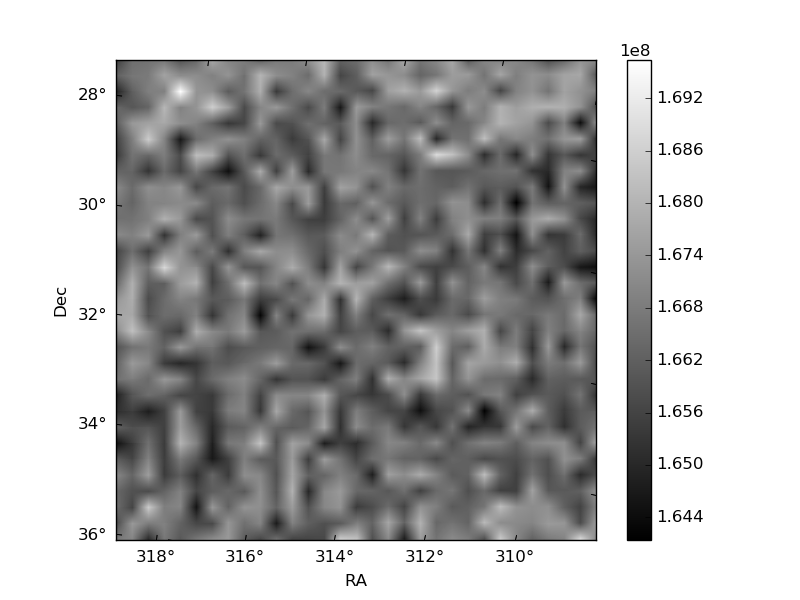
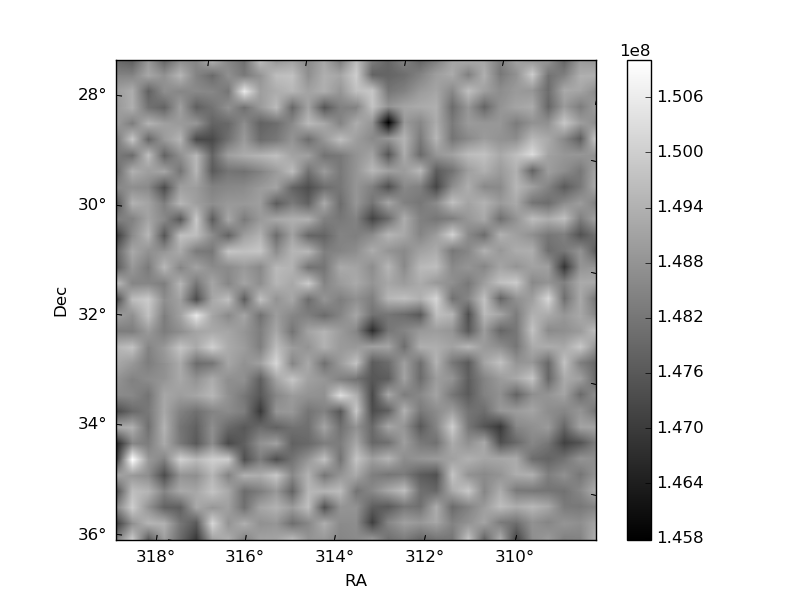
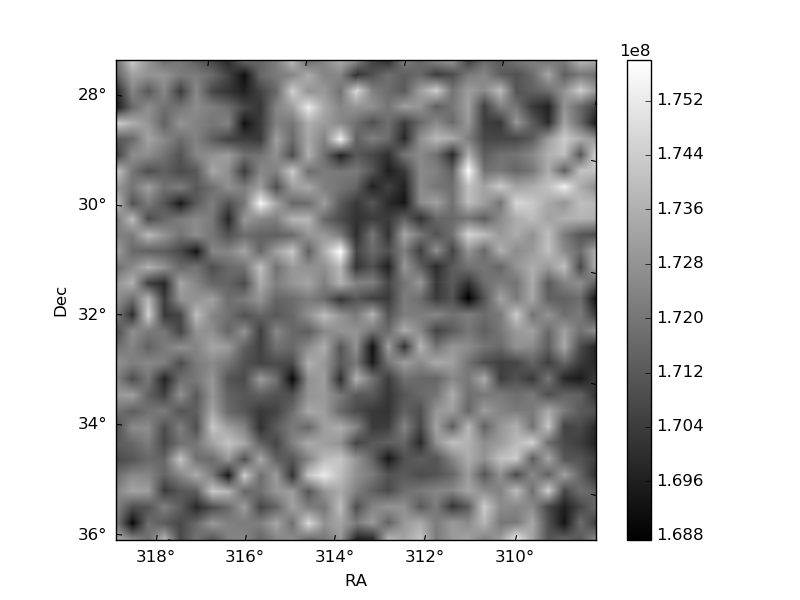
Histogram calculated using DETX and DETY for each event in the final _common_clean file
| Quadrant A | 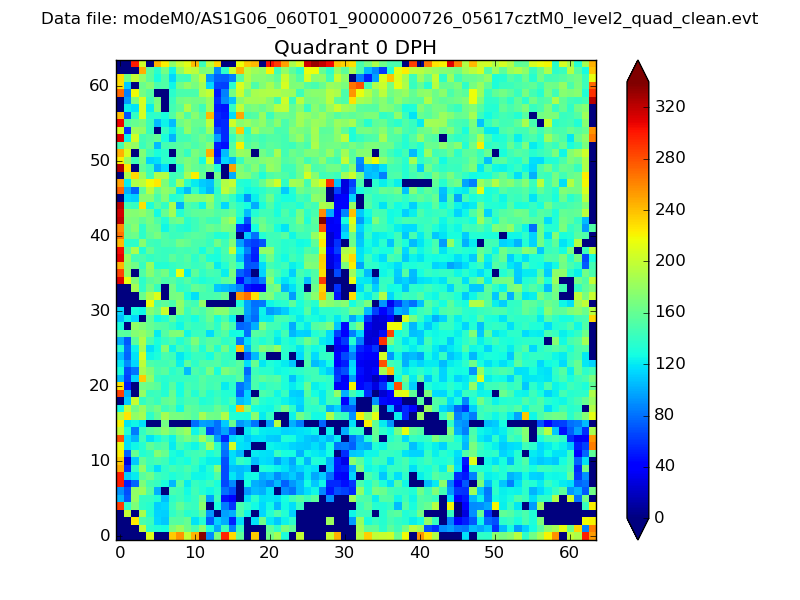 |
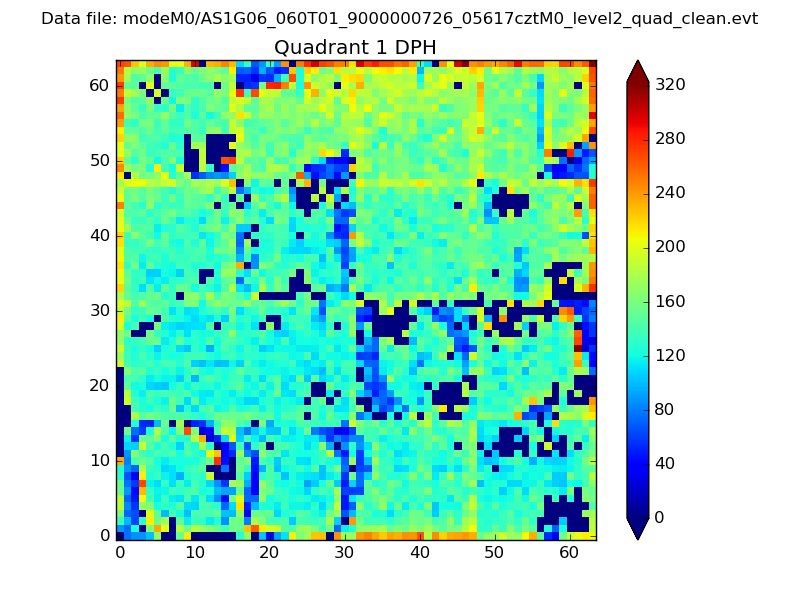 |
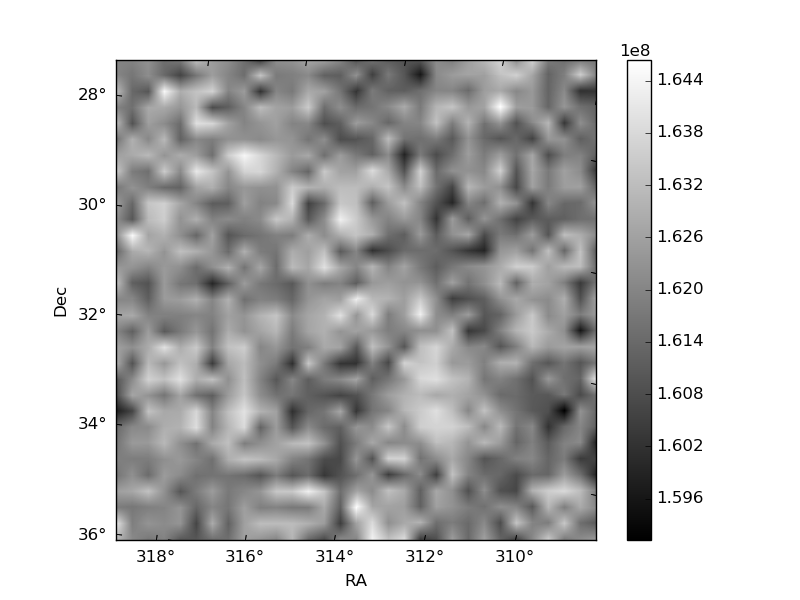
Quadrant B |
|---|---|---|---|
| Quadrant D | 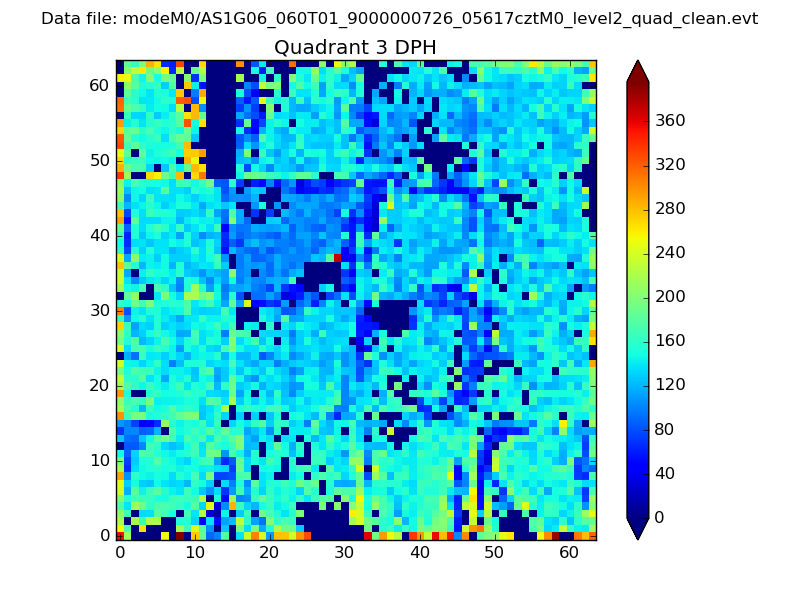 |
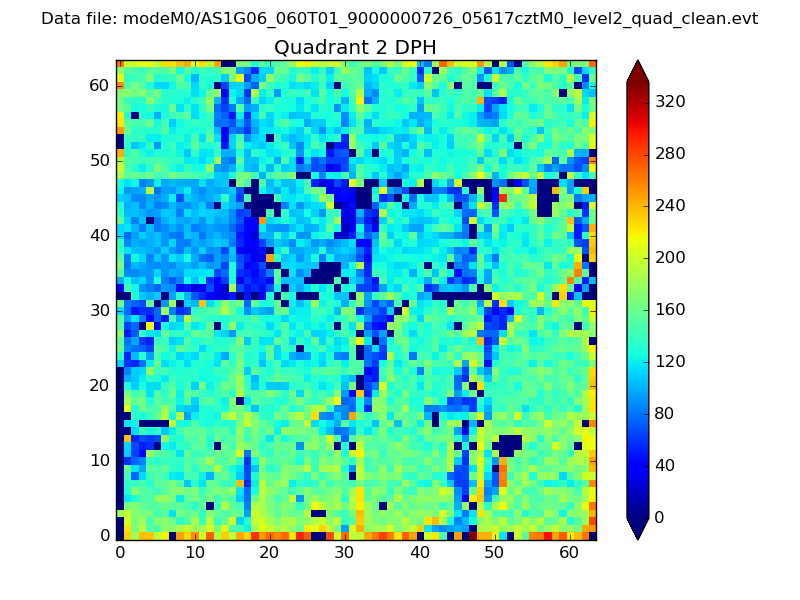 |
Quadrant C |
| Plot type | Count rate plots | Images |
|---|---|---|
| Comparison with Poisson distribution Blue bars denote a histogram of data divided into 1 sec bins. Red curve is a Poisson curve with rate = median count rate of data. |
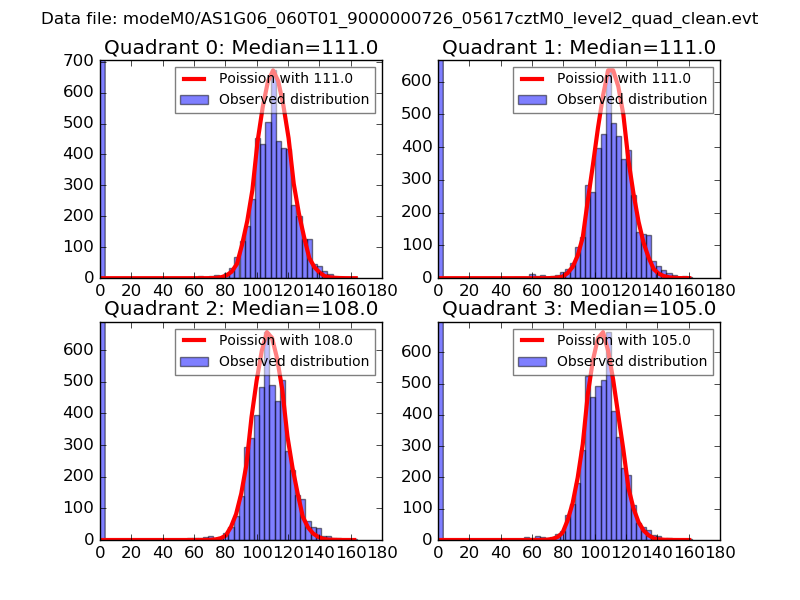 |
 |
| Quadrant-wise count rates Data is divided into 100 sec bins |
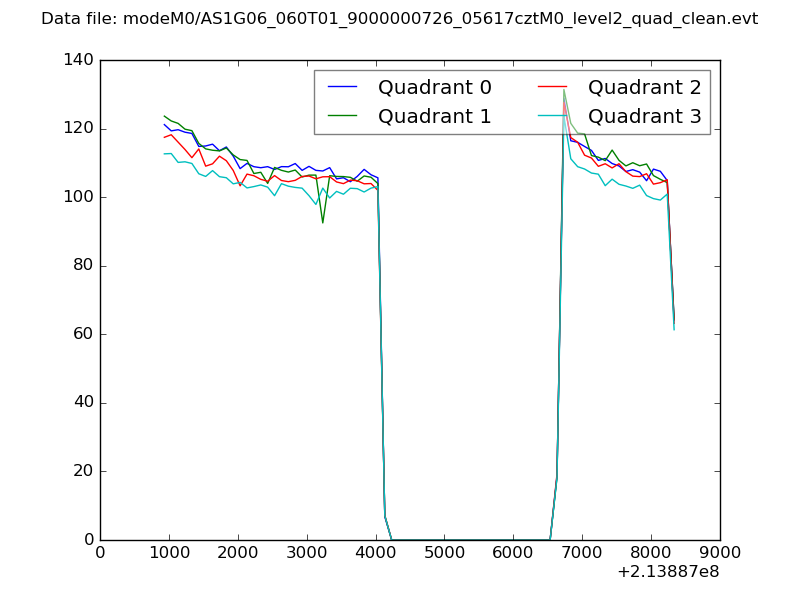 |
|
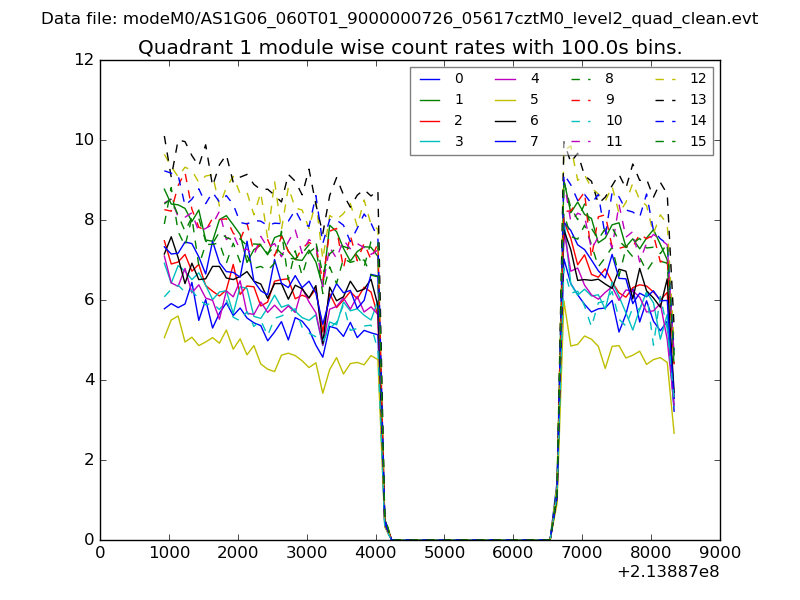
| Module-wise count rates for Quadrant A Data is divided into 100 sec bins |
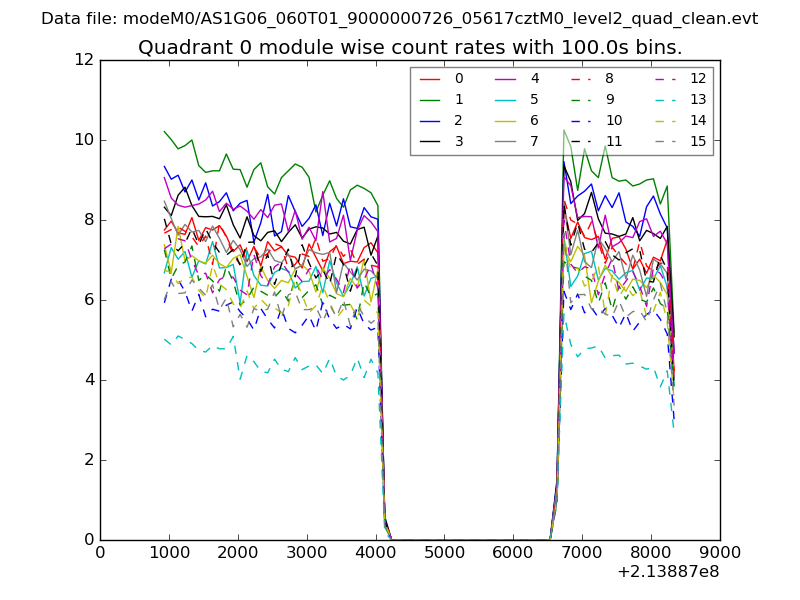 |
 |
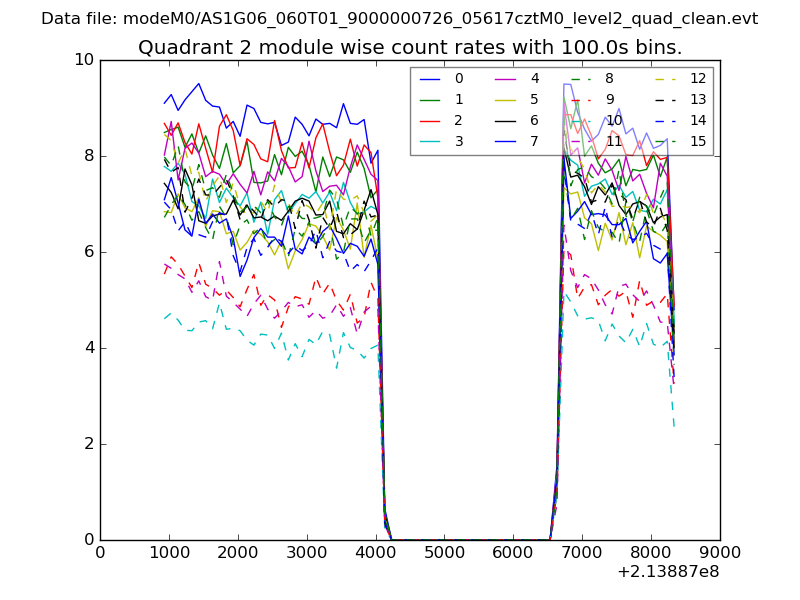
| Module-wise count rates for Quadrant B Data is divided into 100 sec bins |
 |
 |
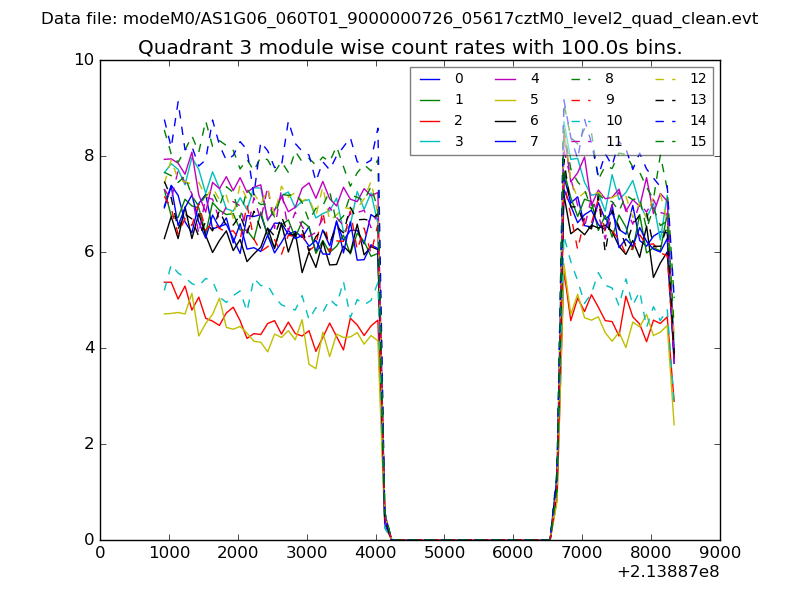
| Module-wise count rates for Quadrant C Data is divided into 100 sec bins |
 |
 |
| Module-wise count rates for Quadrant D Data is divided into 100 sec bins |
 |
 |
| Parameter | Plot |
|---|---|
| CZT HV Monitor | 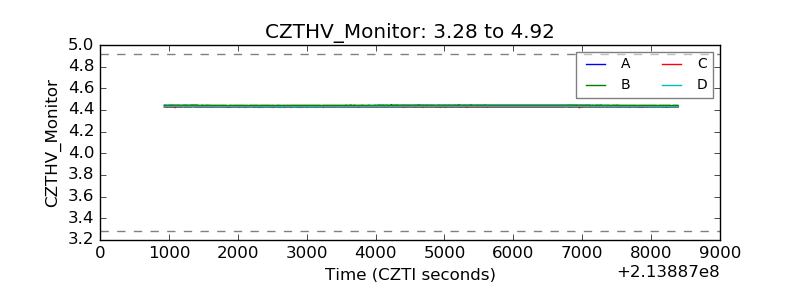 |
| D_VDD | 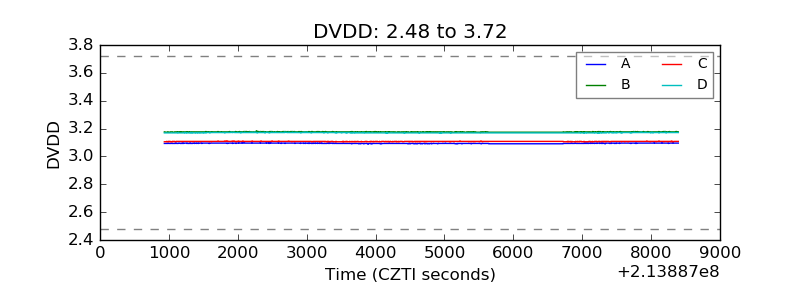 |
| Temperature 1 | 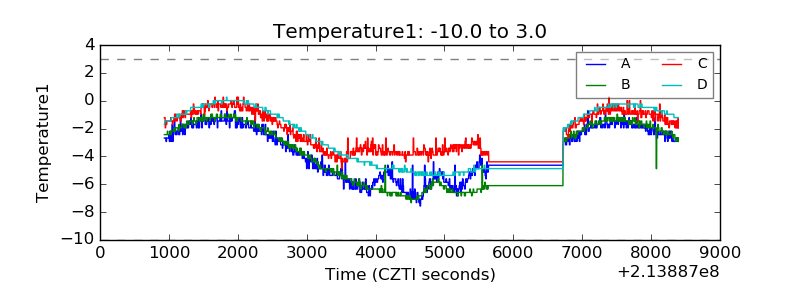 |
| Veto HV Monitor | 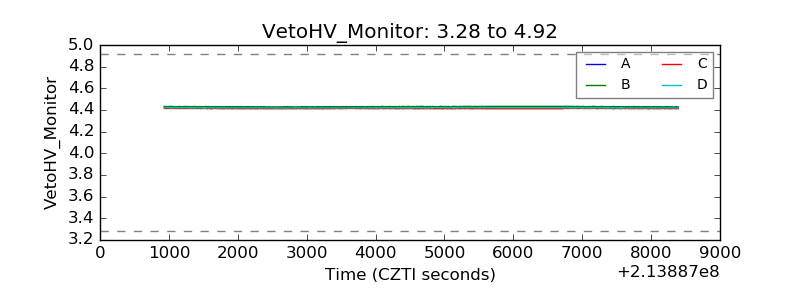 |
| Veto LLD | 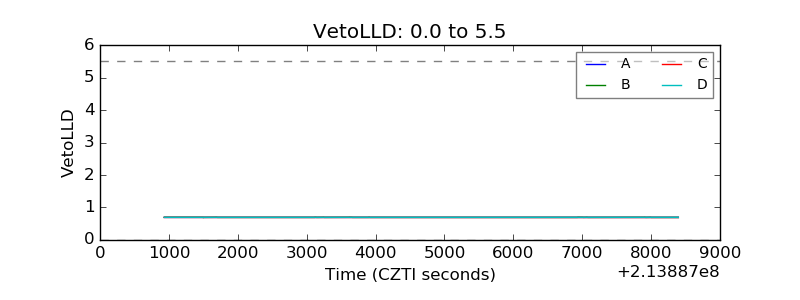 |
| Alpha Counter | 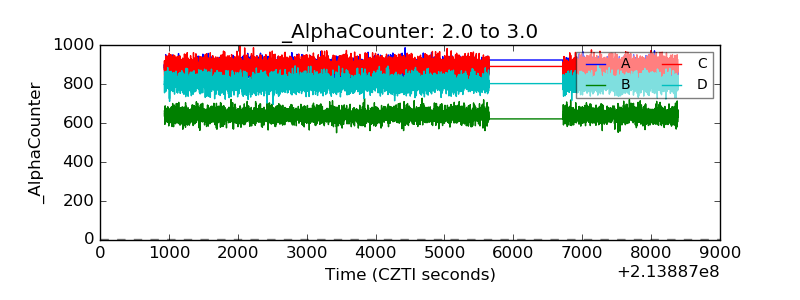 |
| _CPM_Rate | 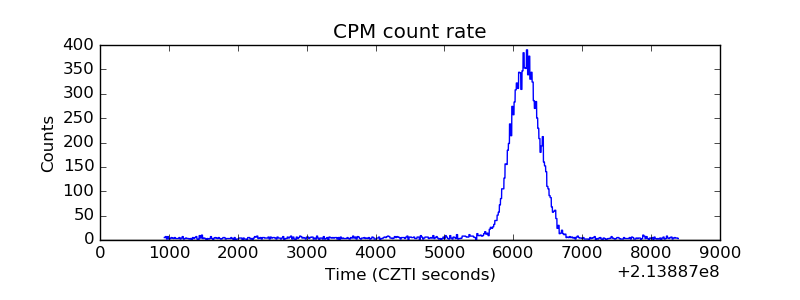 |
| CZT Counter | 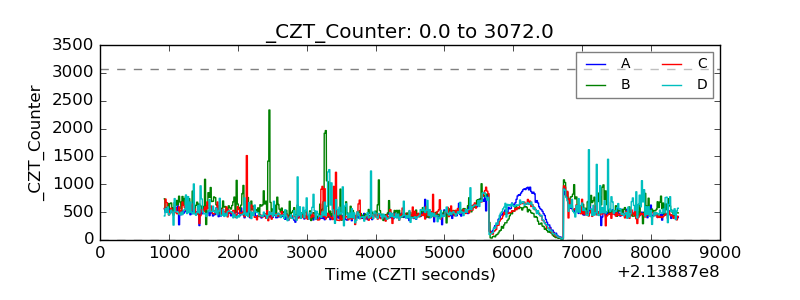 |
| +2.5 Volts monitor |  |
| +5 Volts monitor |  |
| _ROLL_ROT | 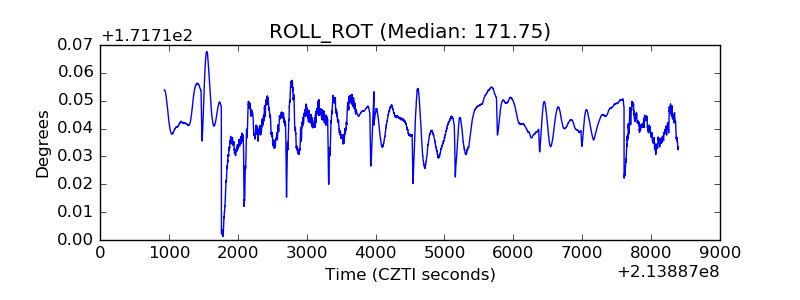 |
| _Roll_DEC | 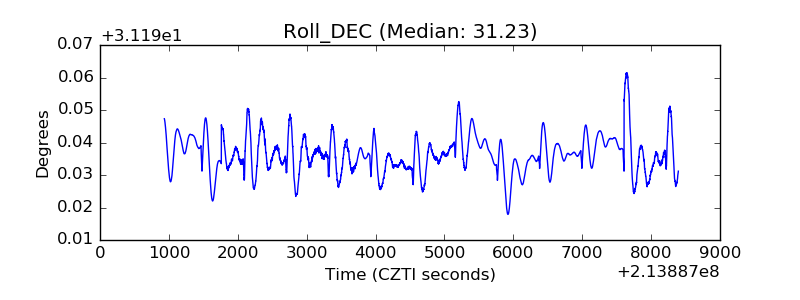 |
| _Roll_RA | 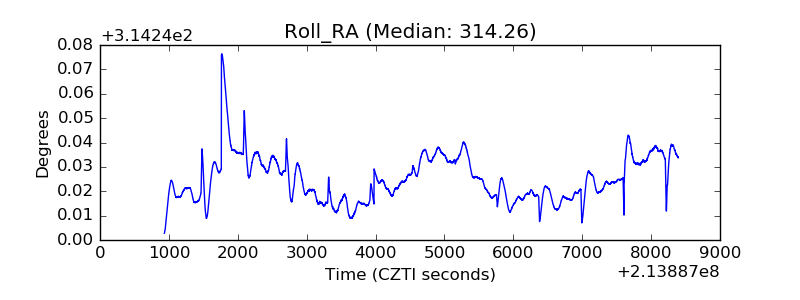 |
| Veto Counter | 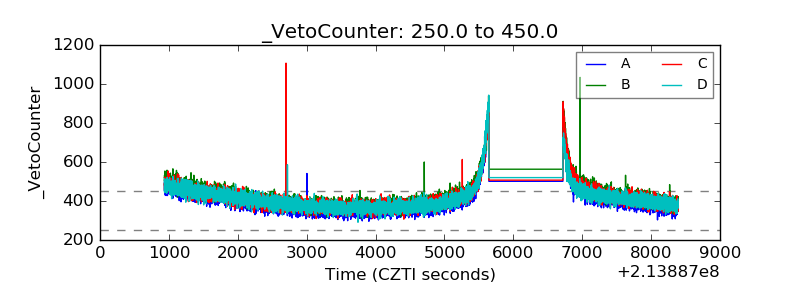 |