| Param | Original file | Final file |
|---|---|---|
| Filename | modeM0/AS1G06_032T02_9000000730_05625cztM0_level2.evt | modeM0/AS1G06_032T02_9000000730_05625cztM0_level2_quad_clean.evt |
| Size (bytes) | 469,016,640 | 72,008,640 |
| Size | 447.3 MB | 68.7 MB |
| Events in quadrant A | 3,298,301 | 427,116 |
| Events in quadrant B | 4,000,560 | 418,901 |
| Events in quadrant C | 3,218,378 | 431,258 |
| Events in quadrant D | 3,209,102 | 413,958 |
| Mode SS | |||
|---|---|---|---|
| Quadrant | BADHDUFLAG | Total packets | Discarded packets |
| A | 0 | 152 | 4 |
| B | 0 | 152 | 6 |
| C | 0 | 152 | 6 |
| D | 0 | 152 | 10 |
| Mode M0 | |||
|---|---|---|---|
| Quadrant | BADHDUFLAG | Total packets | Discarded packets |
| A | 0 | 15307 | 845 |
| B | 0 | 17449 | 1138 |
| C | 0 | 15261 | 889 |
| D | 0 | 15451 | 930 |
| Mode M9 | |||
|---|---|---|---|
| Quadrant | BADHDUFLAG | Total packets | Discarded packets |
| A | 0 | 18 | 0 |
| B | 0 | 18 | 2 |
| C | 0 | 18 | 0 |
| D | 0 | 18 | 0 |
| Quadrant | Total seconds | Saturated seconds | Saturation percentage |
|---|---|---|---|
| A | 7032 | 89 | 1.265643% |
| B | 6989 | 120 | 1.716984% |
| C | 7007 | 74 | 1.056087% |
| D | 7017 | 64 | 0.912071% |
Noise dominated data is calculated using 1-second bins in cleaned event files. If a bin has >2000 counts, and if more than 50% of those come from <1% of pixels, then it is considered to be noise-dominated and hence unusable.
| Quadrant | # 1 sec bins | Bins with >0 counts | Bins with >2000 counts | High rate bins dominated by noise | Noise dominated (total time) | Noise dominated (detector-on time) | Marked lightcurve |
|---|---|---|---|---|---|---|---|
| A | 9205 | 7406 | 0 | 0 | 0.00% | 0.00% | 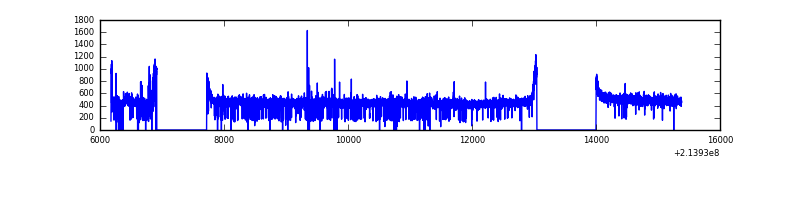 |
| B | 9205 | 7398 | 6 | 6 | 0.07% | 0.08% | 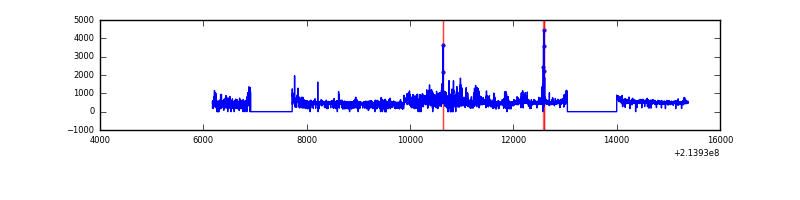 |
| C | 9205 | 7411 | 1 | 1 | 0.01% | 0.01% | 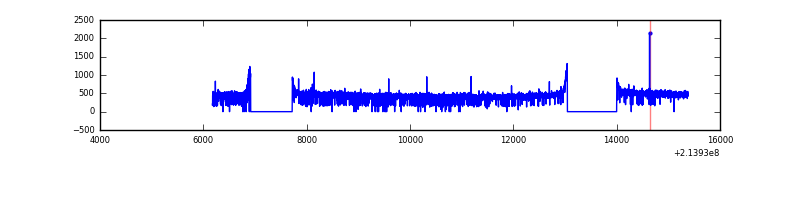 |
| D | 9205 | 7413 | 7 | 7 | 0.08% | 0.09% | 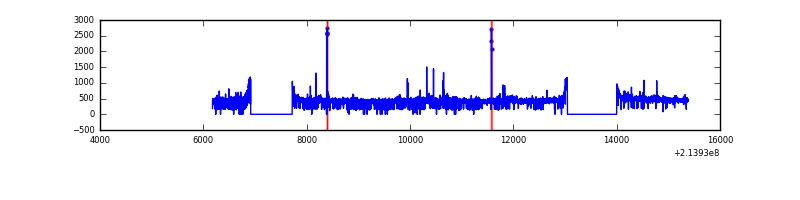 |
Top three noisy pixels from each quadrant. If the there are fewer than three noisy pixels in the level2.evt file, extra rows are filled as -1
| Pixel properties | Quadrant properties | ||||||
|---|---|---|---|---|---|---|---|
| Quadrant | DetID | PixID | Counts | Sigma | Mean | Median | Sigma |
| A | 7 | 16 | 20213 | 112.23 | 842 | 823 | 172.8 |
| A | 0 | 50 | 14668 | 80.13 | 842 | 823 | 172.8 |
| A | 13 | 6 | 10023 | 53.25 | 842 | 823 | 172.8 |
| B | 15 | 204 | 602466 | 3682.72 | 845 | 825 | 163.4 |
| B | 0 | 214 | 70350 | 425.57 | 845 | 825 | 163.4 |
| B | 11 | 51 | 37389 | 223.81 | 845 | 825 | 163.4 |
| C | 1 | 16 | 10009 | 47.69 | 819 | 824 | 192.6 |
| C | 12 | 4 | 6732 | 30.68 | 819 | 824 | 192.6 |
| C | 13 | 61 | 6664 | 30.33 | 819 | 824 | 192.6 |
| D | 2 | 152 | 30240 | 147.4 | 814 | 788 | 199.8 |
| D | 12 | 233 | 26438 | 128.37 | 814 | 788 | 199.8 |
| D | 10 | 15 | 22904 | 110.68 | 814 | 788 | 199.8 |
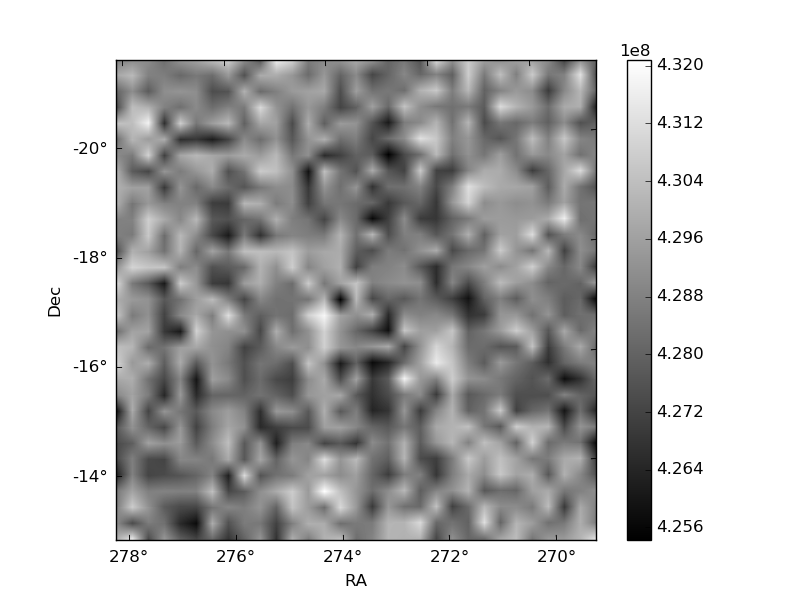
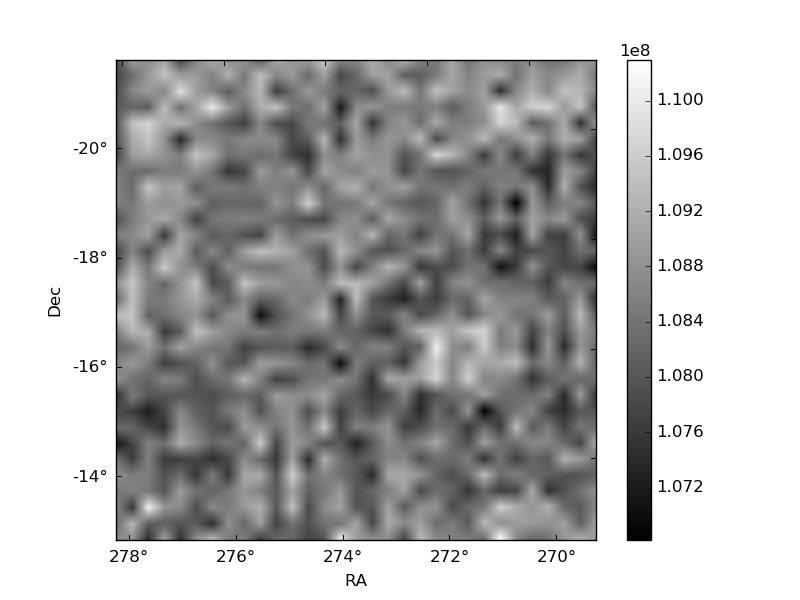
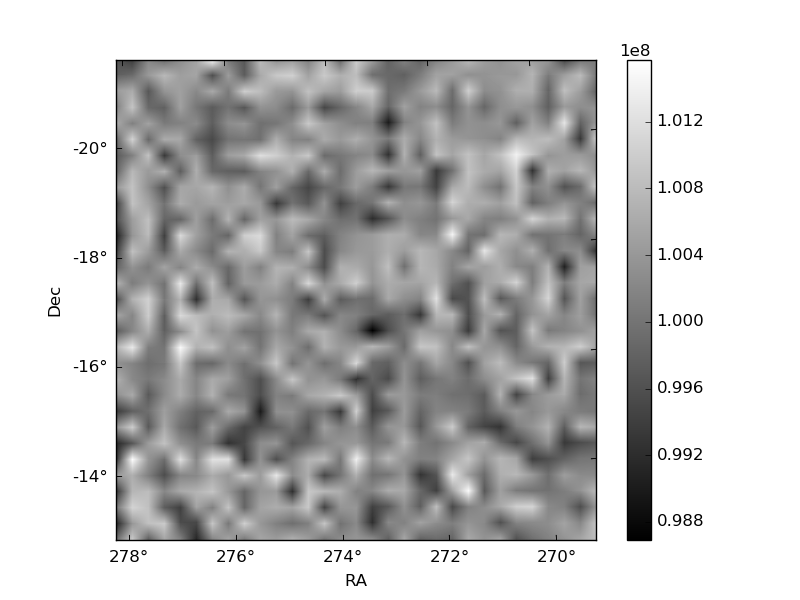
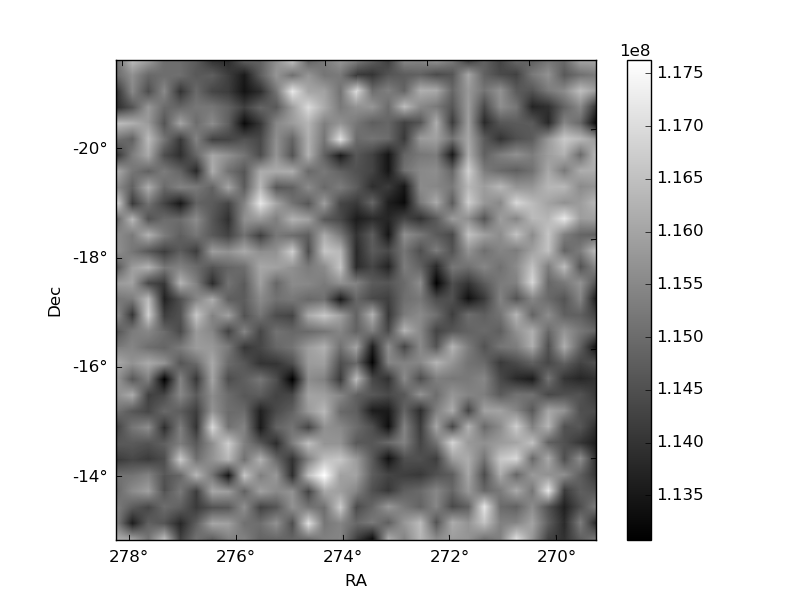
Histogram calculated using DETX and DETY for each event in the final _common_clean file
| Quadrant A | 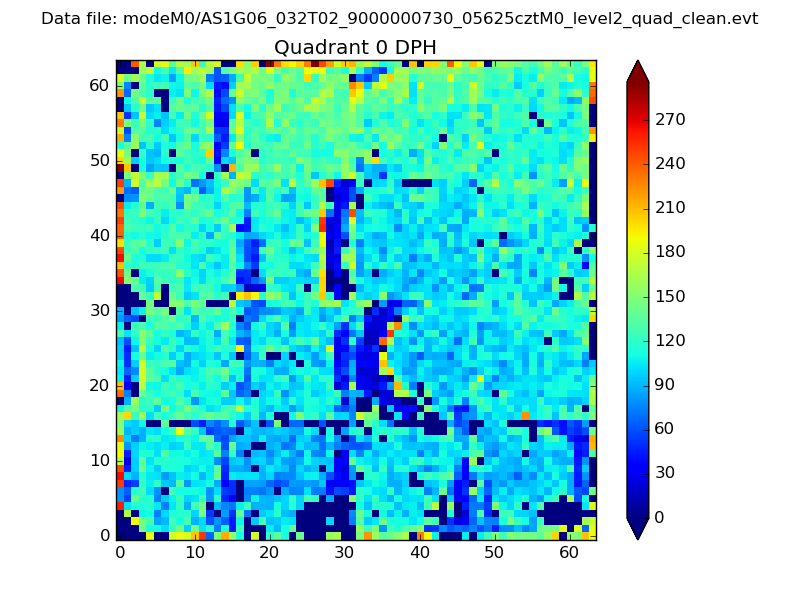 |
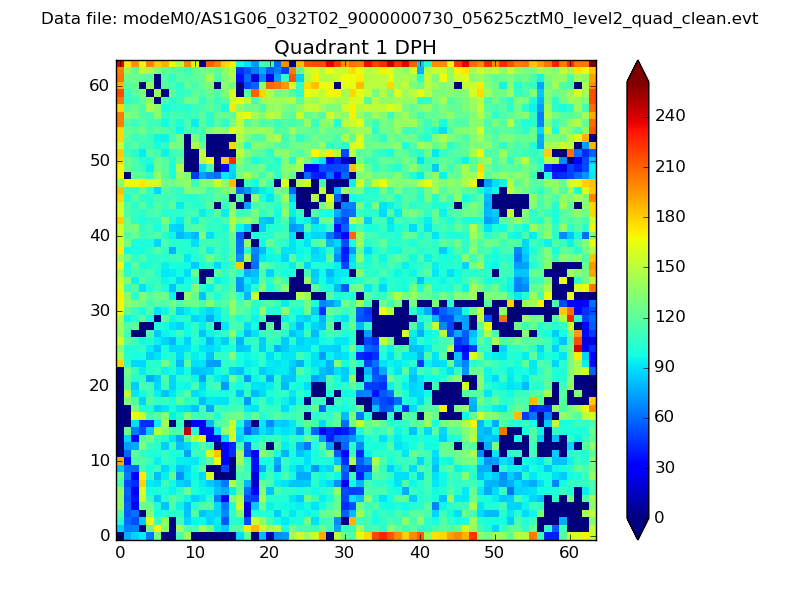 |
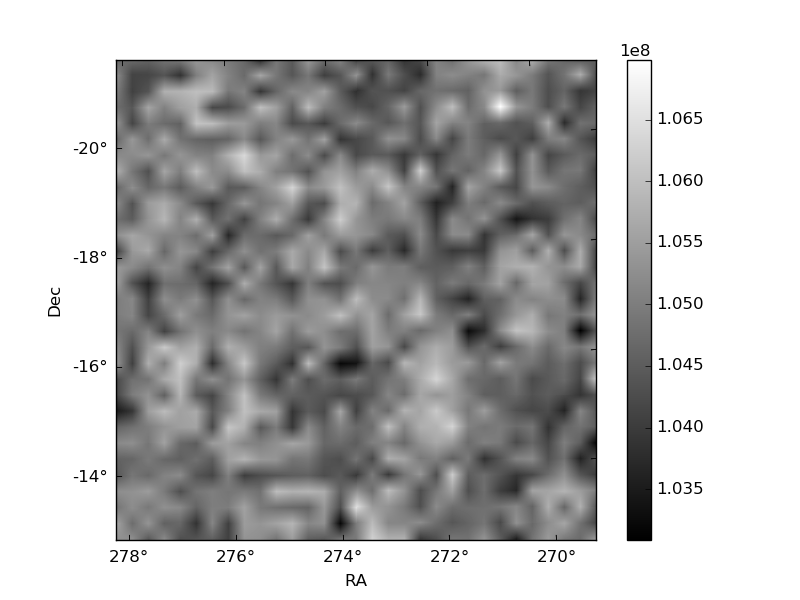
Quadrant B |
|---|---|---|---|
| Quadrant D | 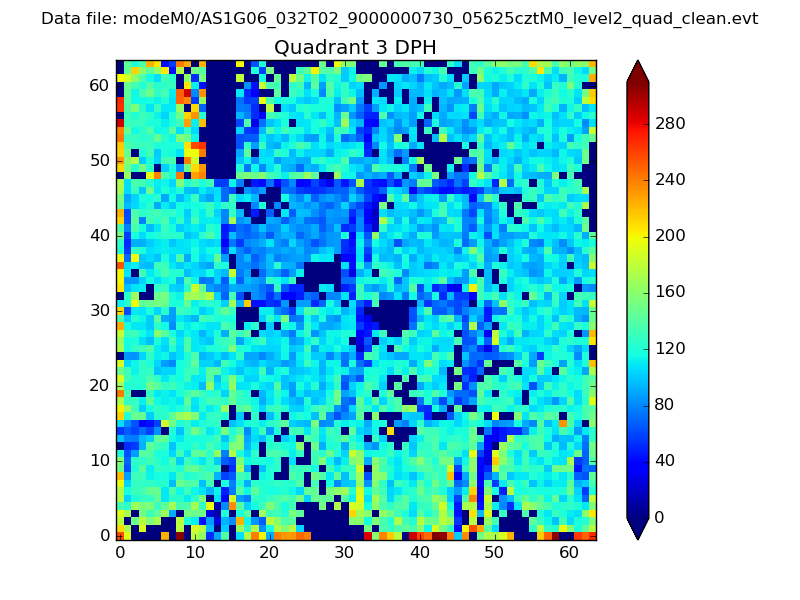 |
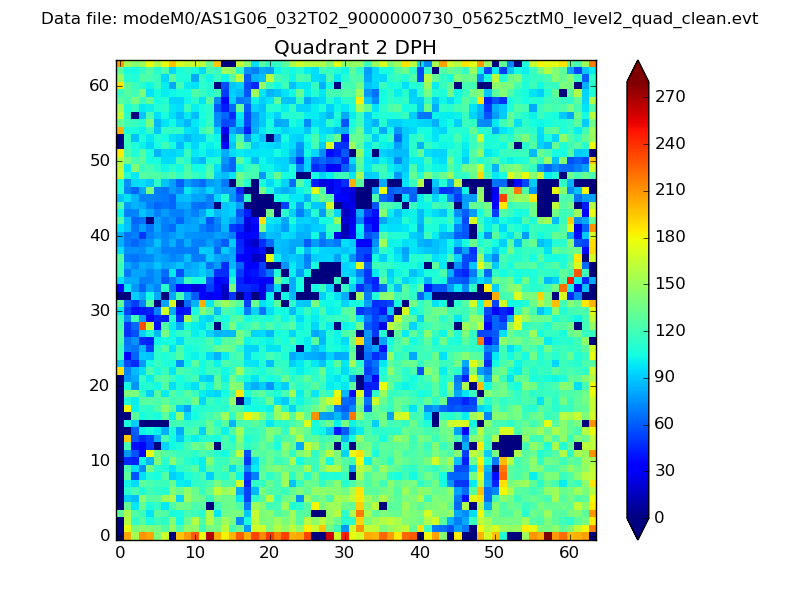 |
Quadrant C |
| Plot type | Count rate plots | Images |
|---|---|---|
| Comparison with Poisson distribution Blue bars denote a histogram of data divided into 1 sec bins. Red curve is a Poisson curve with rate = median count rate of data. |
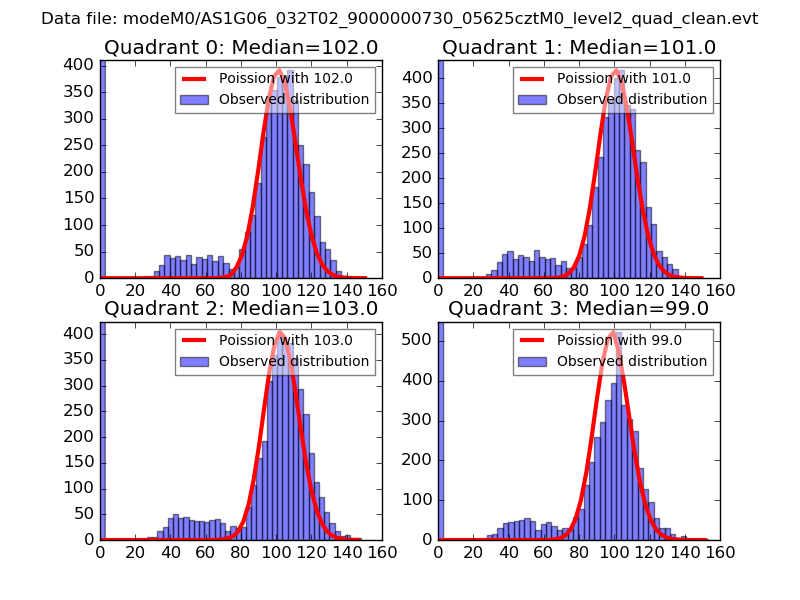 |
 |
| Quadrant-wise count rates Data is divided into 100 sec bins |
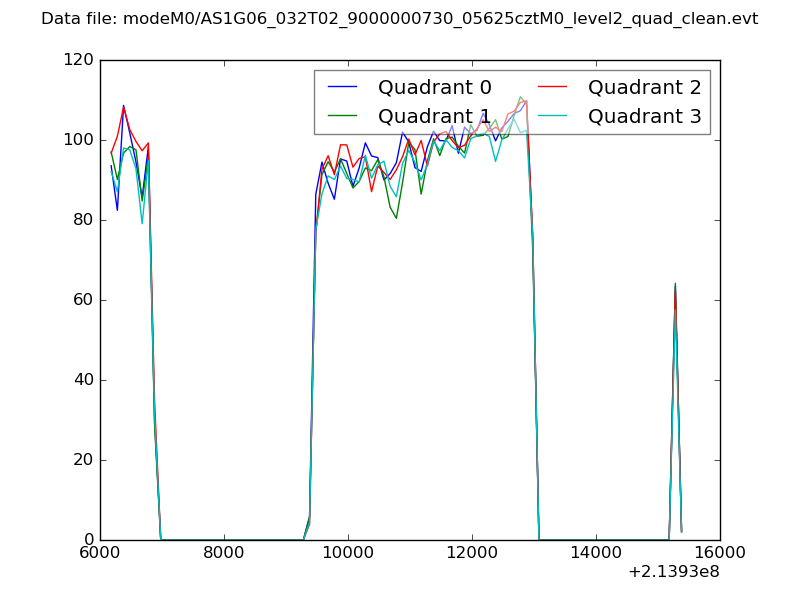 |
|
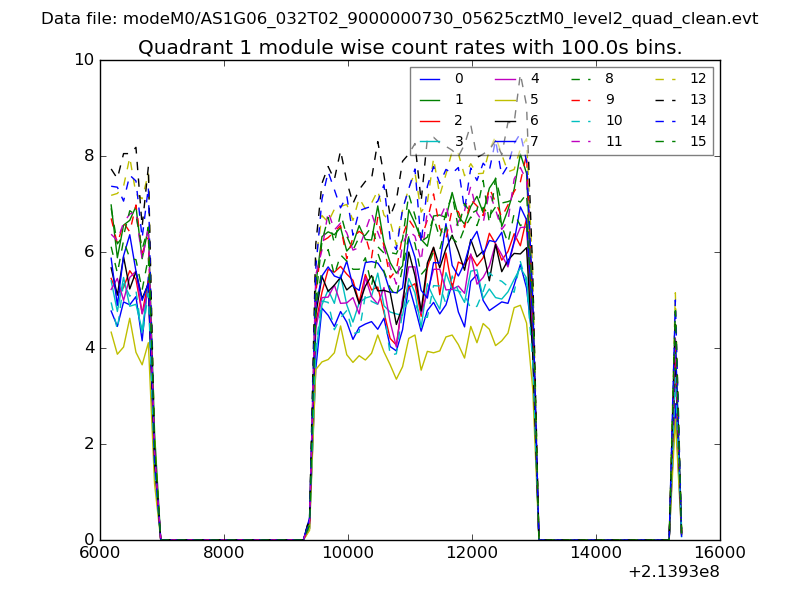
| Module-wise count rates for Quadrant A Data is divided into 100 sec bins |
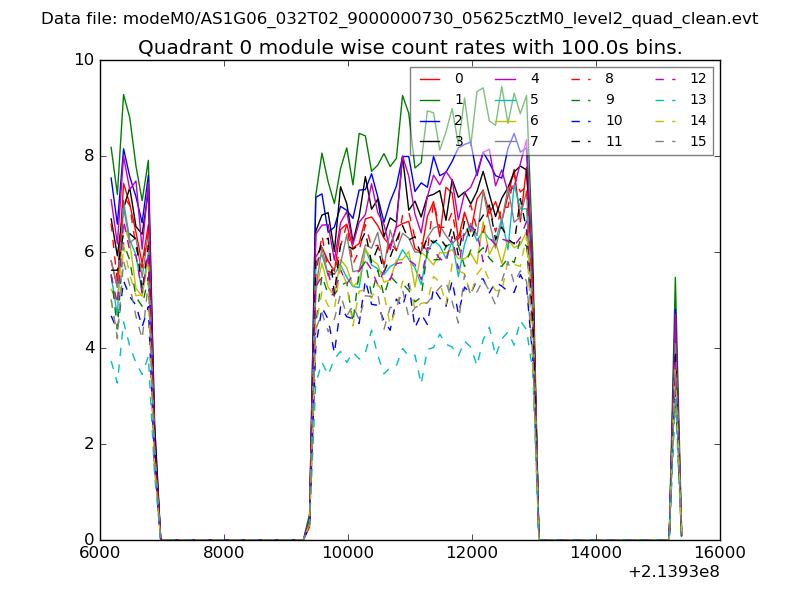 |
 |
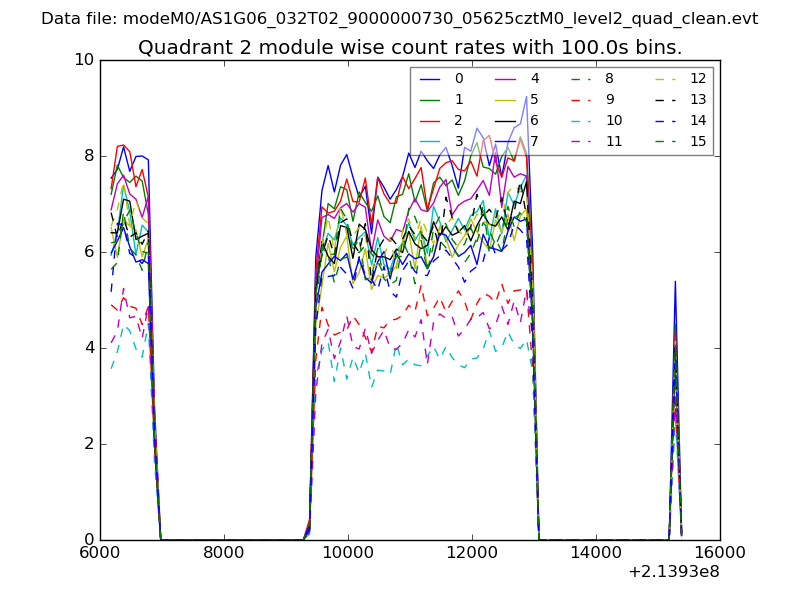
| Module-wise count rates for Quadrant B Data is divided into 100 sec bins |
 |
 |
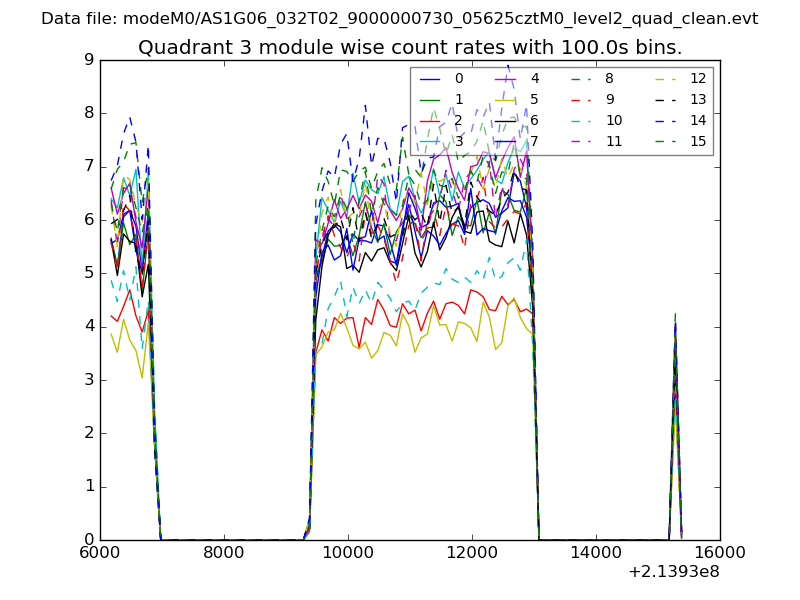
| Module-wise count rates for Quadrant C Data is divided into 100 sec bins |
 |
 |
| Module-wise count rates for Quadrant D Data is divided into 100 sec bins |
 |
 |
| Parameter | Plot |
|---|---|
| CZT HV Monitor | 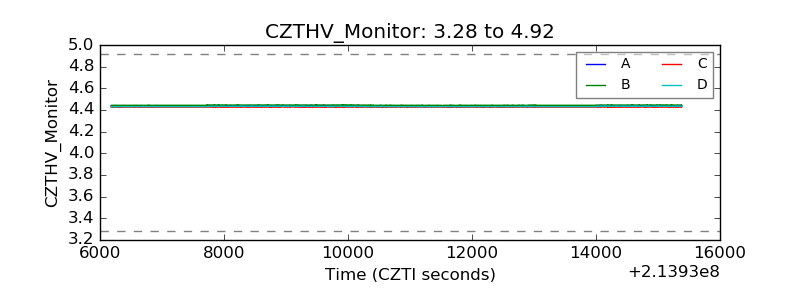 |
| D_VDD | 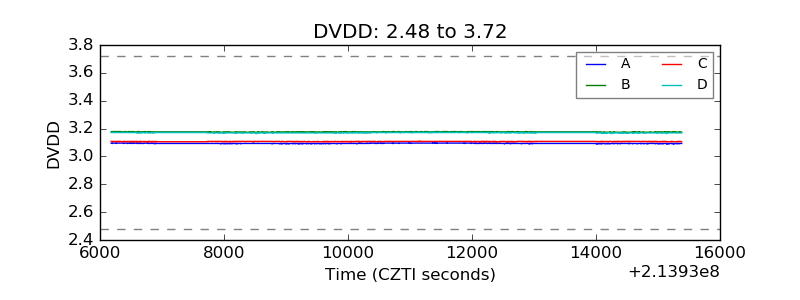 |
| Temperature 1 | 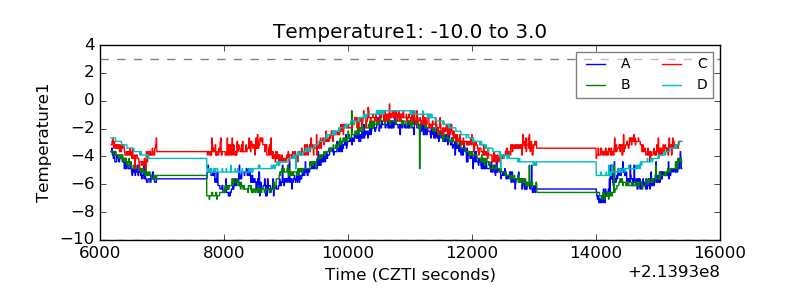 |
| Veto HV Monitor | 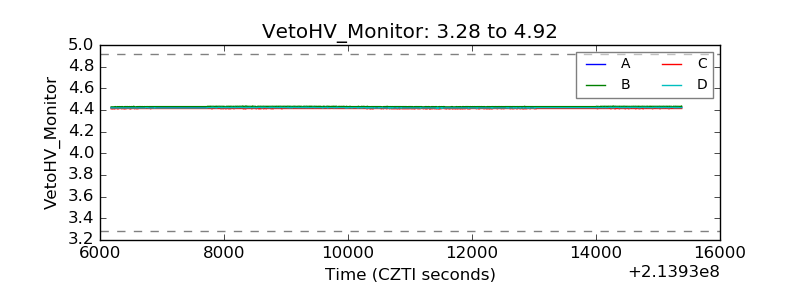 |
| Veto LLD | 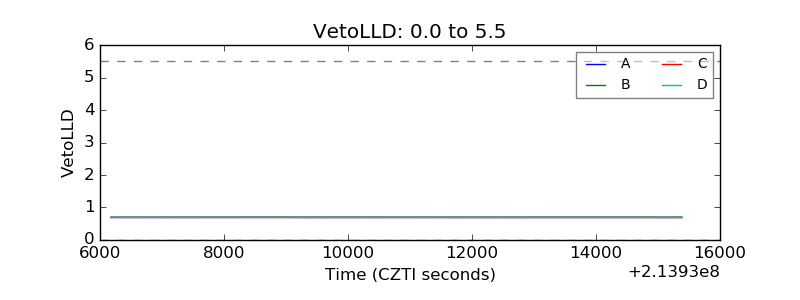 |
| Alpha Counter | 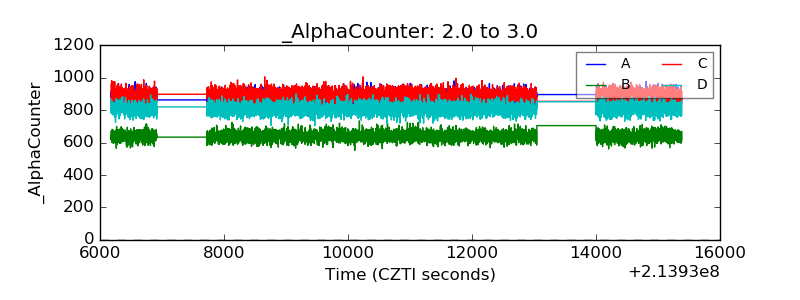 |
| _CPM_Rate | 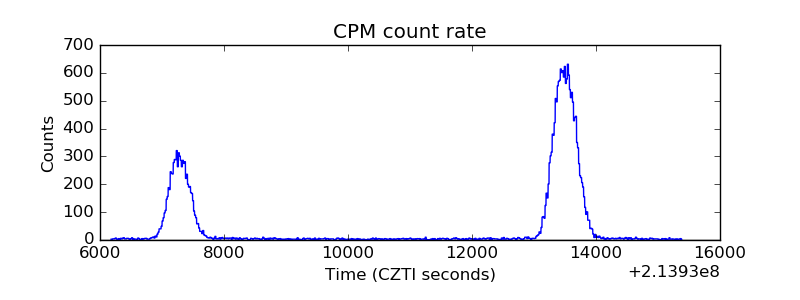 |
| CZT Counter | 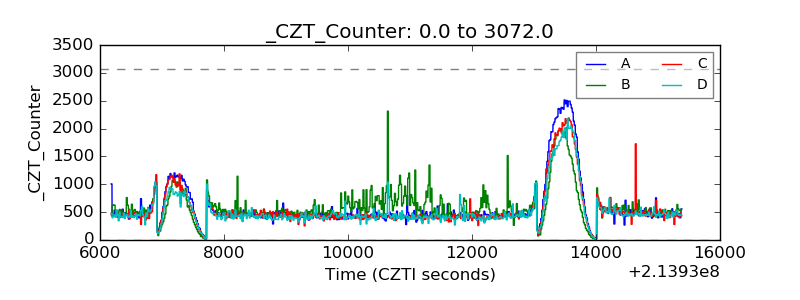 |
| +2.5 Volts monitor |  |
| +5 Volts monitor |  |
| _ROLL_ROT | 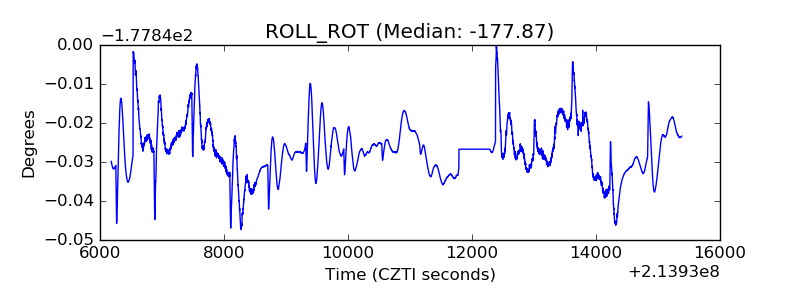 |
| _Roll_DEC | 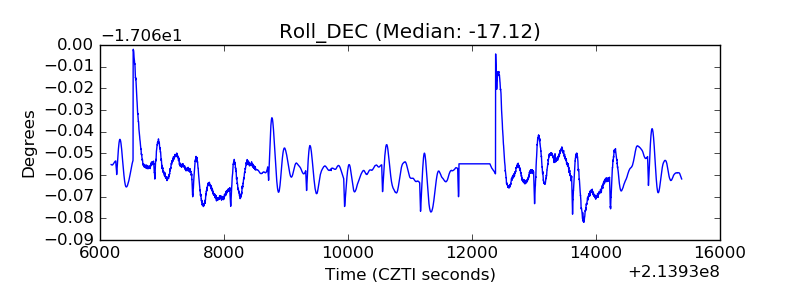 |
| _Roll_RA | 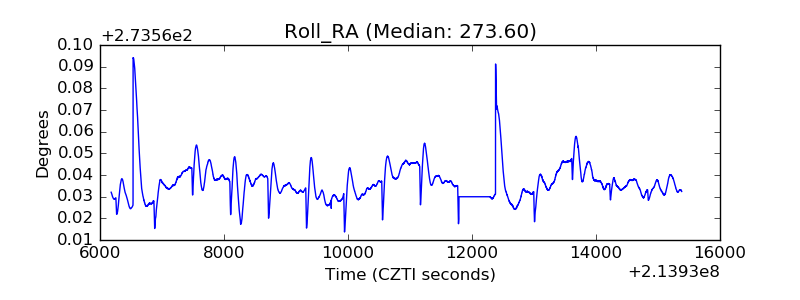 |
| Veto Counter | 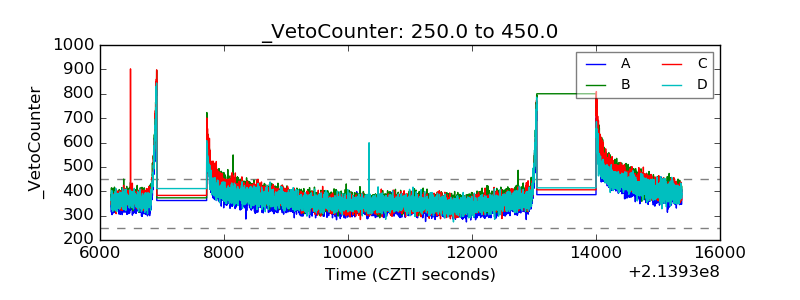 |