| Param | Original file | Final file |
|---|---|---|
| Filename | modeM0/AS1G06_032T02_9000000730_05631cztM0_level2.evt | modeM0/AS1G06_032T02_9000000730_05631cztM0_level2_quad_clean.evt |
| Size (bytes) | 472,976,640 | 90,619,200 |
| Size | 451.1 MB | 86.4 MB |
| Events in quadrant A | 3,302,709 | 578,504 |
| Events in quadrant B | 3,739,737 | 574,134 |
| Events in quadrant C | 3,253,302 | 572,761 |
| Events in quadrant D | 3,571,360 | 550,103 |
| Mode SS | |||
|---|---|---|---|
| Quadrant | BADHDUFLAG | Total packets | Discarded packets |
| A | 0 | 138 | 0 |
| B | 0 | 138 | 0 |
| C | 0 | 138 | 0 |
| D | 0 | 138 | 0 |
| Mode M0 | |||
|---|---|---|---|
| Quadrant | BADHDUFLAG | Total packets | Discarded packets |
| A | 0 | 14263 | 3 |
| B | 0 | 15650 | 2 |
| C | 0 | 14159 | 2 |
| D | 0 | 15096 | 2 |
| Mode M9 | |||
|---|---|---|---|
| Quadrant | BADHDUFLAG | Total packets | Discarded packets |
| A | 0 | 11 | 0 |
| B | 0 | 11 | 0 |
| C | 0 | 11 | 0 |
| D | 0 | 12 | 0 |
| Quadrant | Total seconds | Saturated seconds | Saturation percentage |
|---|---|---|---|
| A | 6720 | 132 | 1.964286% |
| B | 6720 | 132 | 1.964286% |
| C | 6720 | 79 | 1.175595% |
| D | 6720 | 143 | 2.127976% |
Noise dominated data is calculated using 1-second bins in cleaned event files. If a bin has >2000 counts, and if more than 50% of those come from <1% of pixels, then it is considered to be noise-dominated and hence unusable.
| Quadrant | # 1 sec bins | Bins with >0 counts | Bins with >2000 counts | High rate bins dominated by noise | Noise dominated (total time) | Noise dominated (detector-on time) | Marked lightcurve |
|---|---|---|---|---|---|---|---|
| A | 7896 | 6722 | 3 | 3 | 0.04% | 0.04% | 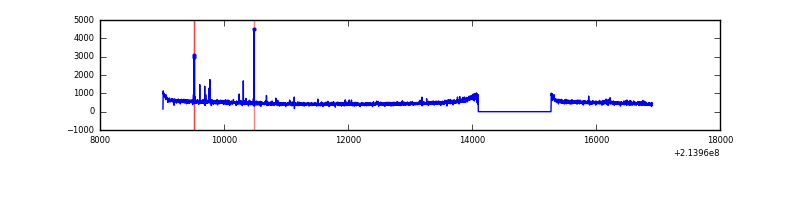 |
| B | 7896 | 6722 | 3 | 3 | 0.04% | 0.04% | 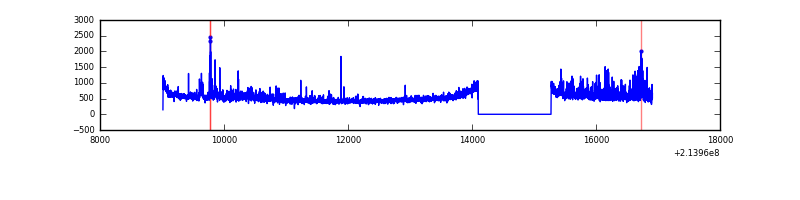 |
| C | 7896 | 6722 | 0 | 0 | 0.00% | 0.00% | 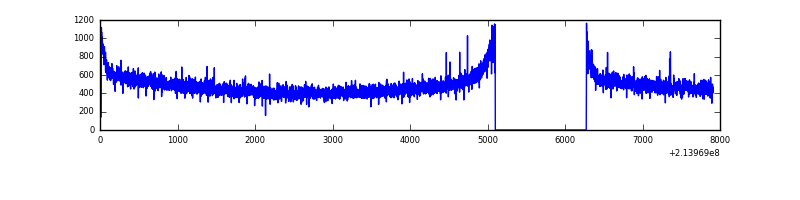 |
| D | 7896 | 6722 | 34 | 34 | 0.43% | 0.51% | 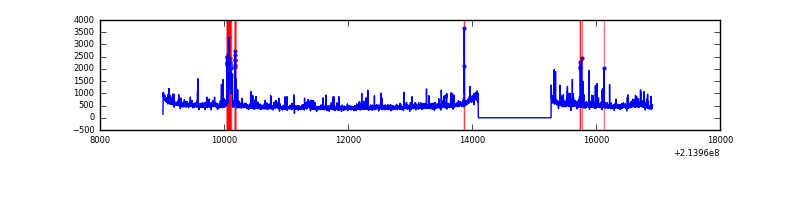 |
Top three noisy pixels from each quadrant. If the there are fewer than three noisy pixels in the level2.evt file, extra rows are filled as -1
| Pixel properties | Quadrant properties | ||||||
|---|---|---|---|---|---|---|---|
| Quadrant | DetID | PixID | Counts | Sigma | Mean | Median | Sigma |
| A | 0 | 50 | 22694 | 127.69 | 842 | 825 | 171.3 |
| A | 0 | 254 | 14743 | 81.27 | 842 | 825 | 171.3 |
| A | 7 | 16 | 13243 | 72.51 | 842 | 825 | 171.3 |
| B | 15 | 204 | 303217 | 1864.64 | 841 | 822 | 162.2 |
| B | 0 | 214 | 86424 | 527.84 | 841 | 822 | 162.2 |
| B | 11 | 51 | 56462 | 343.09 | 841 | 822 | 162.2 |
| C | 1 | 16 | 86428 | 457.58 | 804 | 811 | 187.1 |
| C | 8 | 128 | 11101 | 54.99 | 804 | 811 | 187.1 |
| C | 8 | 112 | 6950 | 32.81 | 804 | 811 | 187.1 |
| D | 2 | 63 | 273159 | 1395.83 | 809 | 787 | 195.1 |
| D | 11 | 241 | 73416 | 372.2 | 809 | 787 | 195.1 |
| D | 2 | 136 | 52259 | 263.78 | 809 | 787 | 195.1 |
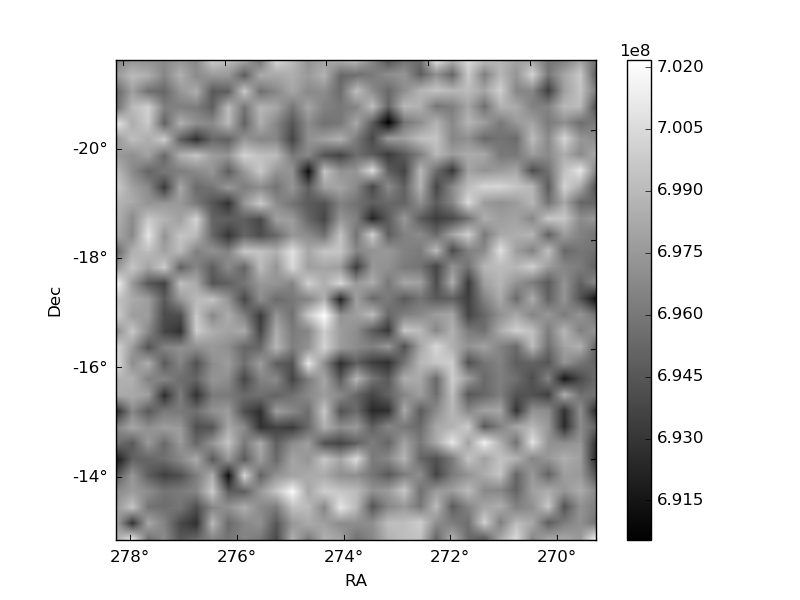
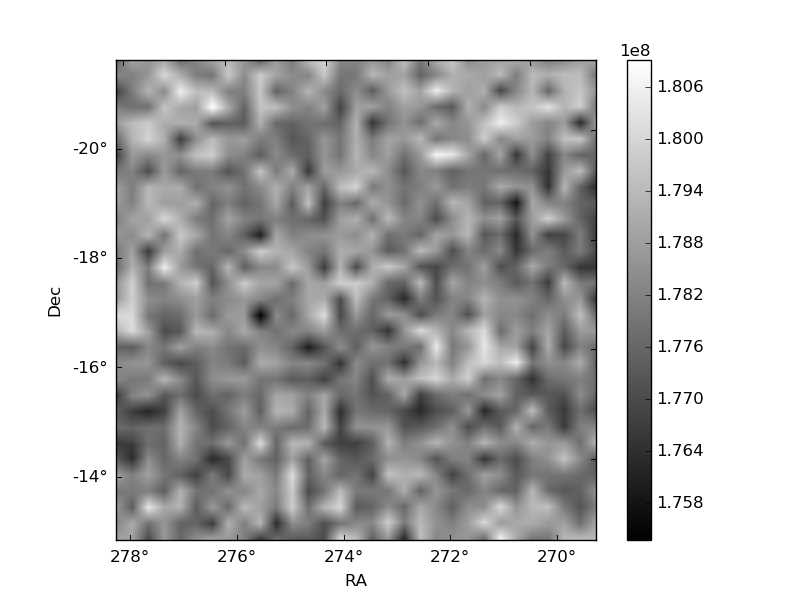
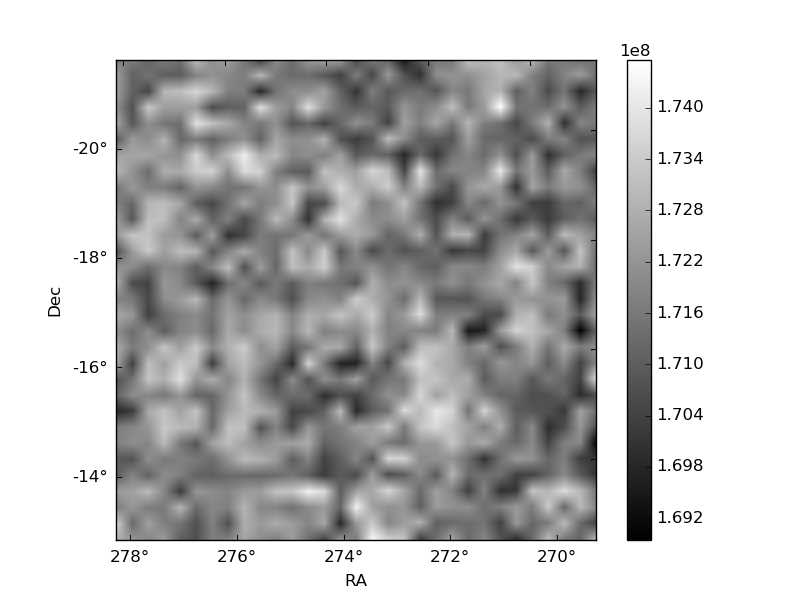
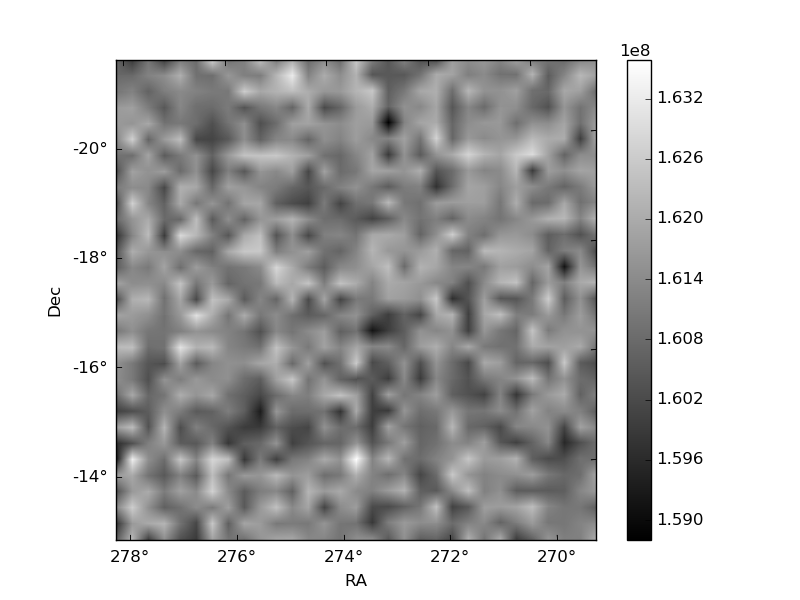
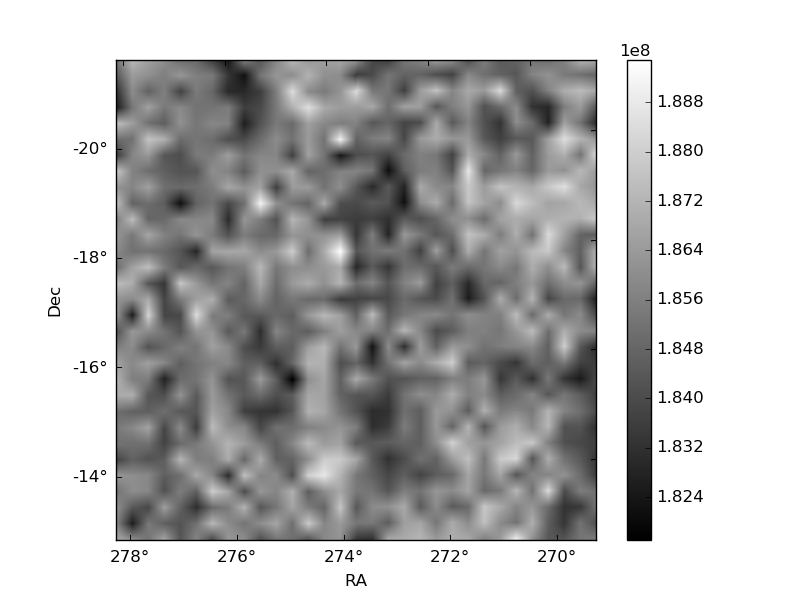
Histogram calculated using DETX and DETY for each event in the final _common_clean file
| Quadrant A | 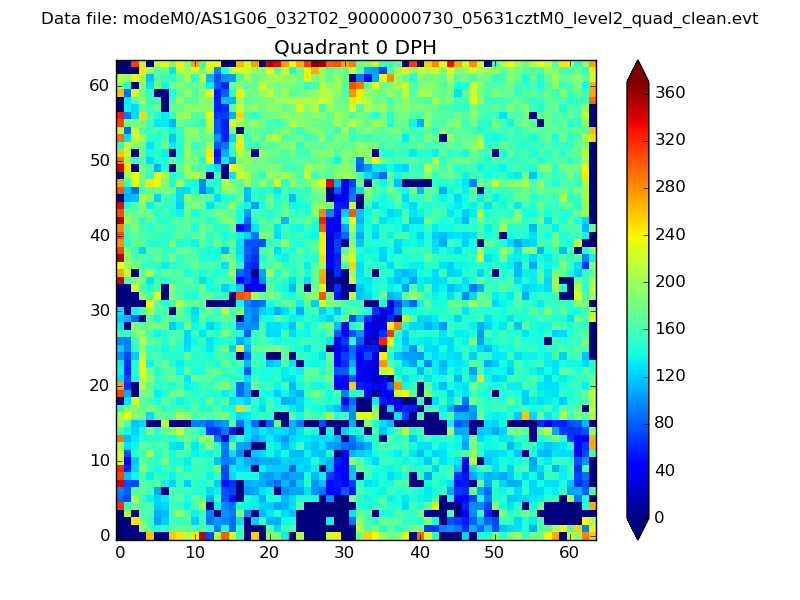 |
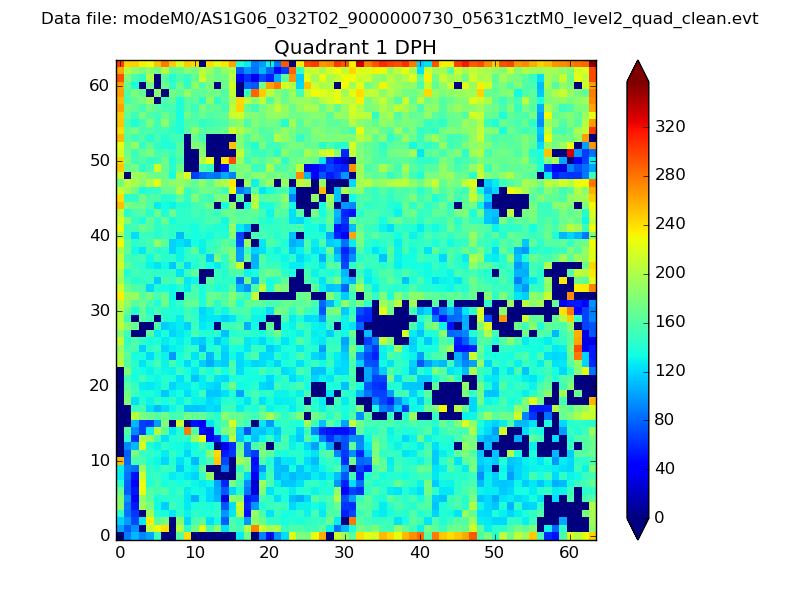 |
Quadrant B |
|---|---|---|---|
| Quadrant D | 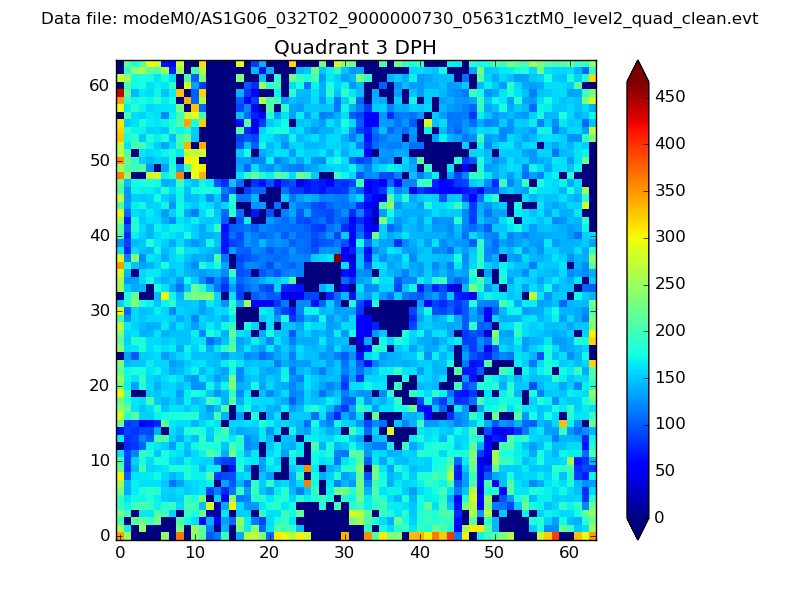 |
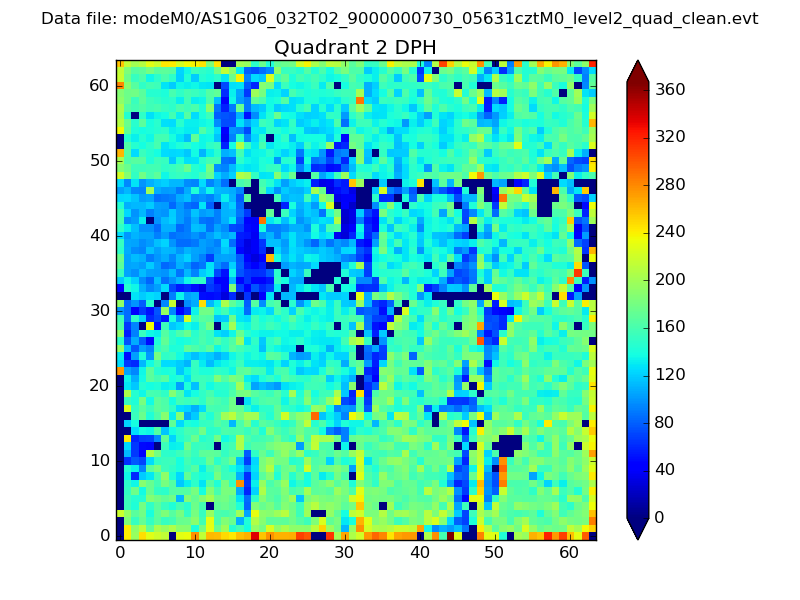 |
Quadrant C |
| Plot type | Count rate plots | Images |
|---|---|---|
| Comparison with Poisson distribution Blue bars denote a histogram of data divided into 1 sec bins. Red curve is a Poisson curve with rate = median count rate of data. |
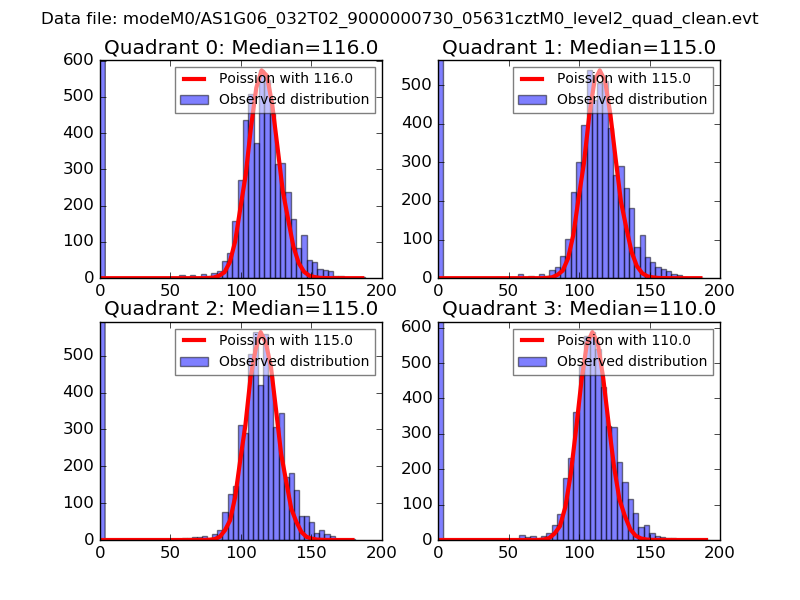 |
 |
| Quadrant-wise count rates Data is divided into 100 sec bins |
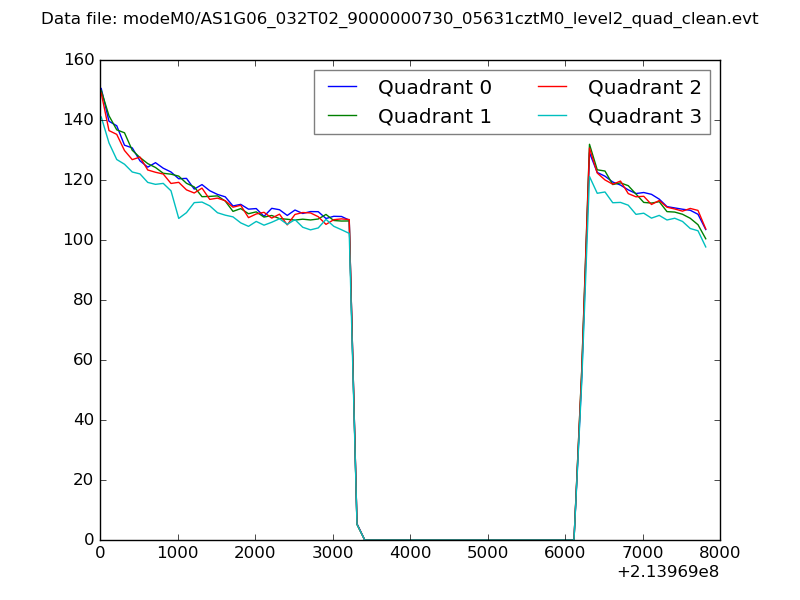 |
|
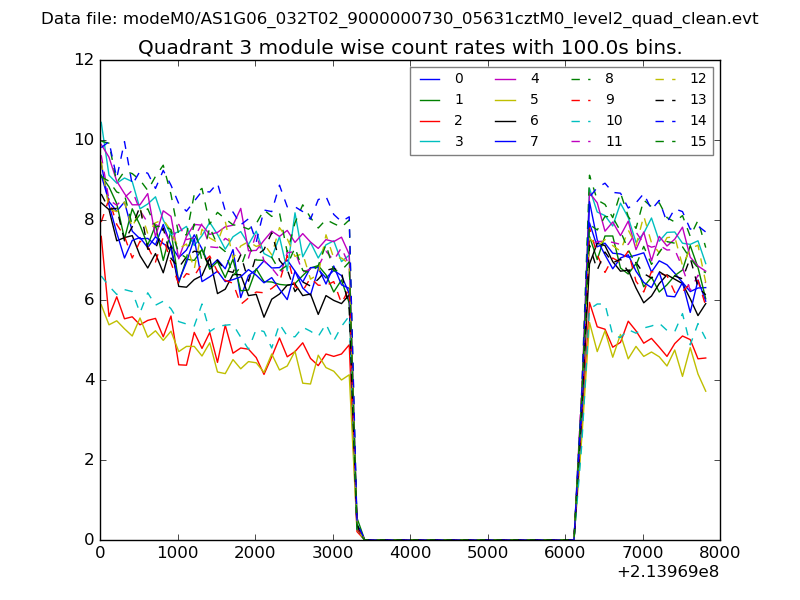
| Module-wise count rates for Quadrant A Data is divided into 100 sec bins |
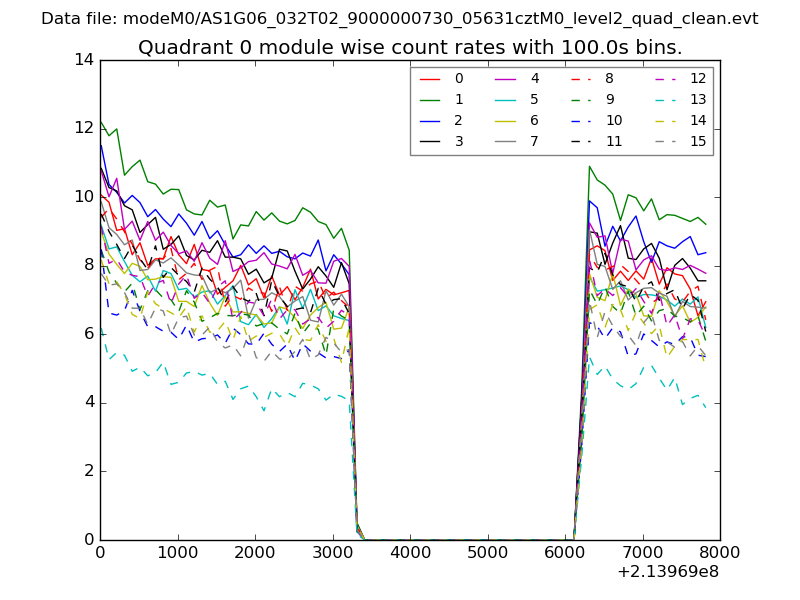 |
 |
| Module-wise count rates for Quadrant B Data is divided into 100 sec bins |
 |
 |
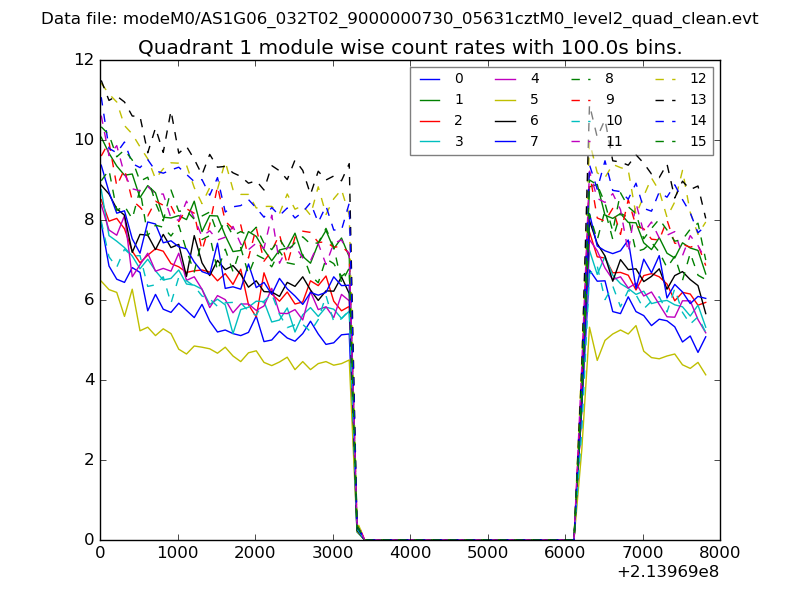
| Module-wise count rates for Quadrant C Data is divided into 100 sec bins |
 |
 |
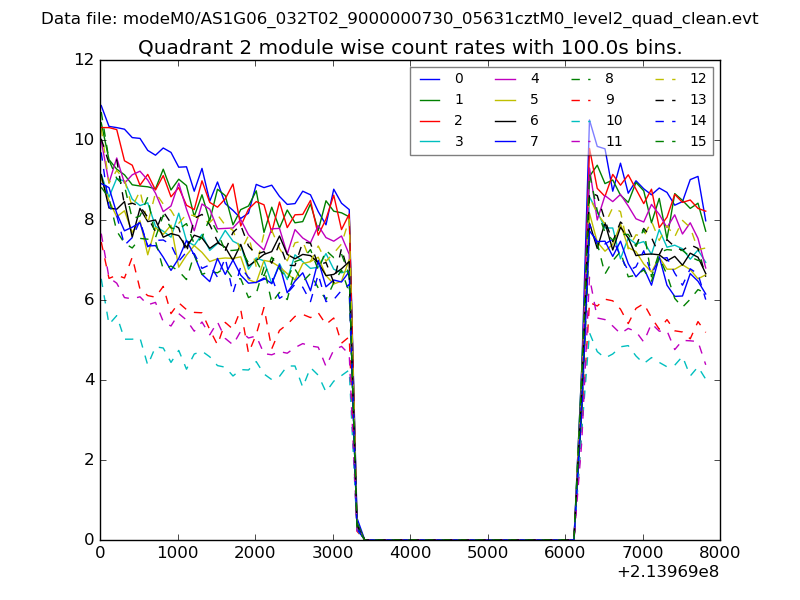
| Module-wise count rates for Quadrant D Data is divided into 100 sec bins |
 |
 |
| Parameter | Plot |
|---|---|
| CZT HV Monitor | 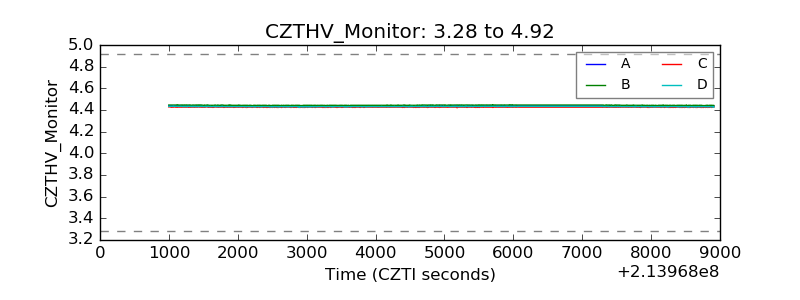 |
| D_VDD | 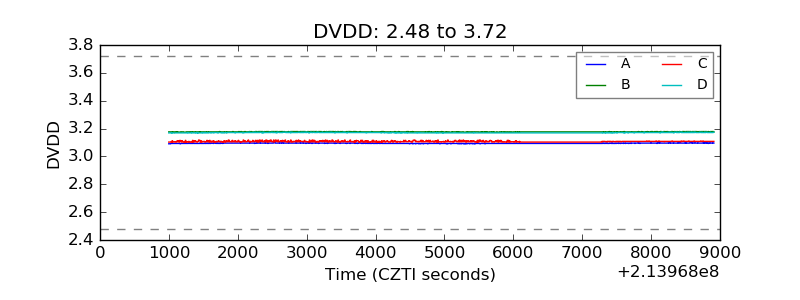 |
| Temperature 1 | 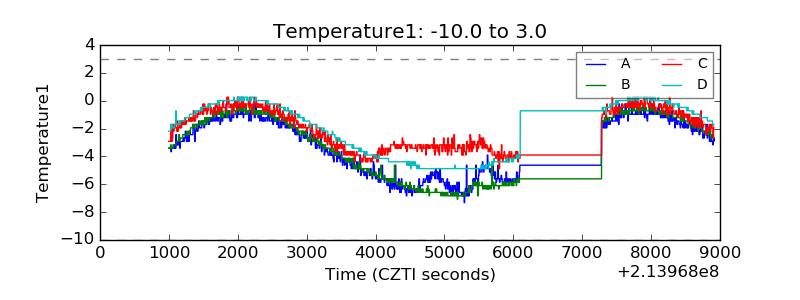 |
| Veto HV Monitor | 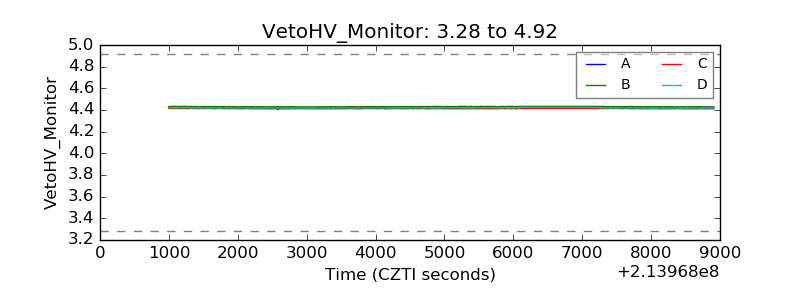 |
| Veto LLD | 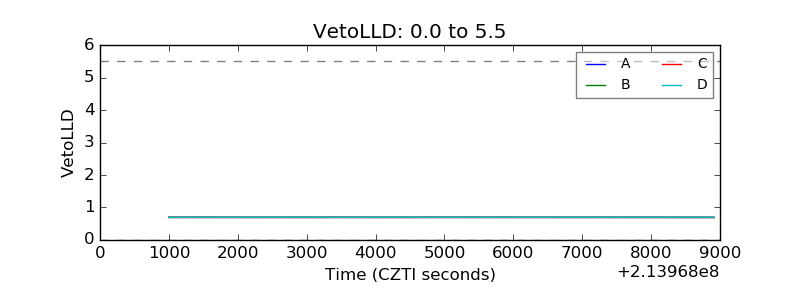 |
| Alpha Counter | 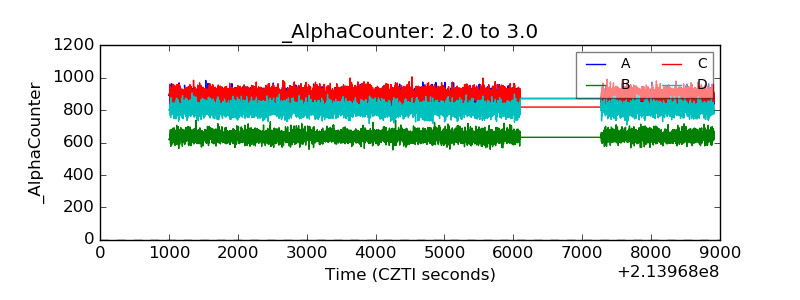 |
| _CPM_Rate | 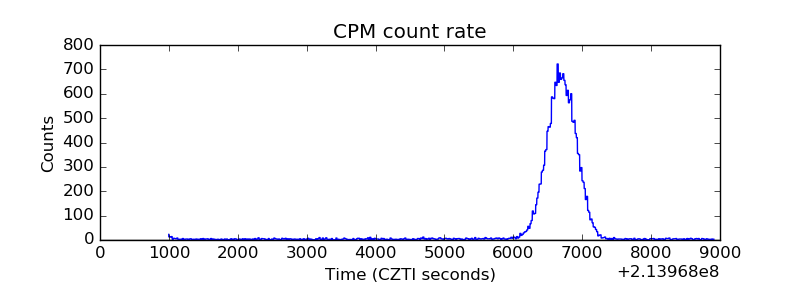 |
| CZT Counter |  |
| +2.5 Volts monitor | 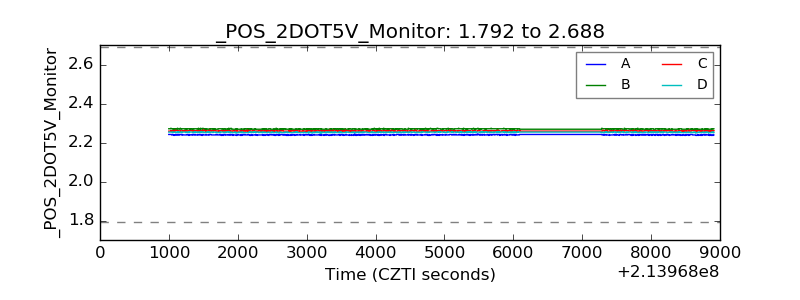 |
| +5 Volts monitor |  |
| _ROLL_ROT | 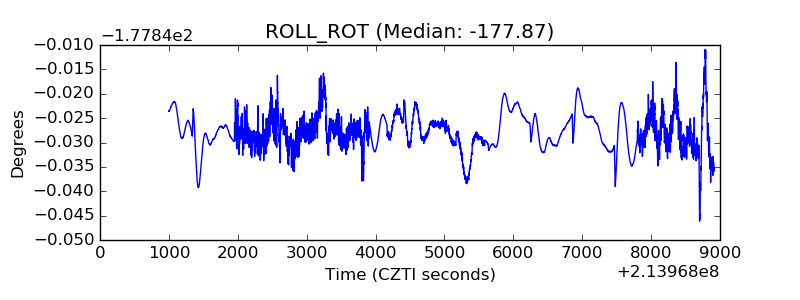 |
| _Roll_DEC | 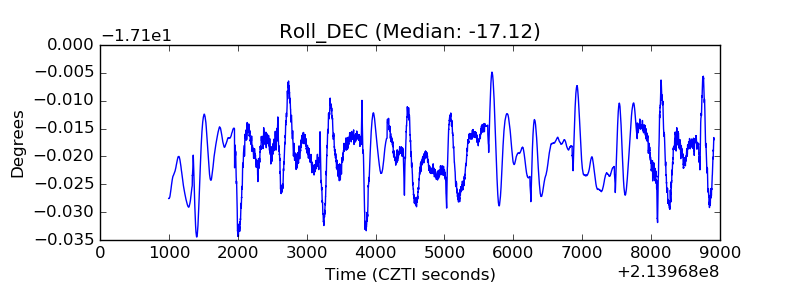 |
| _Roll_RA | 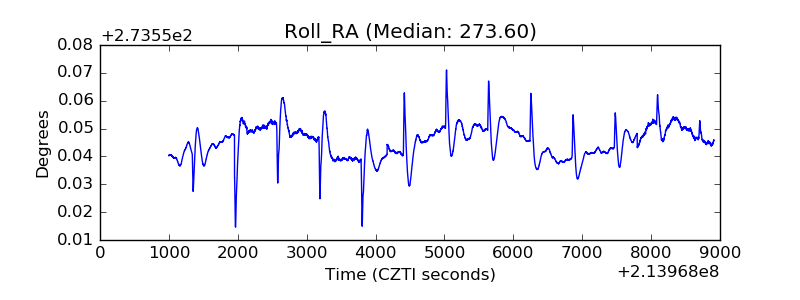 |
| Veto Counter | 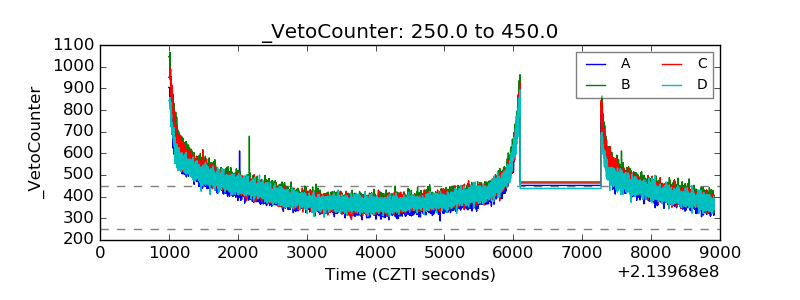 |