| Param | Original file | Final file |
|---|---|---|
| Filename | modeM0/AS1G06_032T02_9000000730_05633cztM0_level2.evt | modeM0/AS1G06_032T02_9000000730_05633cztM0_level2_quad_clean.evt |
| Size (bytes) | 456,649,920 | 79,767,360 |
| Size | 435.5 MB | 76.1 MB |
| Events in quadrant A | 3,176,569 | 489,997 |
| Events in quadrant B | 3,547,488 | 489,050 |
| Events in quadrant C | 3,200,793 | 490,085 |
| Events in quadrant D | 3,440,778 | 470,526 |
| Mode SS | |||
|---|---|---|---|
| Quadrant | BADHDUFLAG | Total packets | Discarded packets |
| A | 0 | 140 | 0 |
| B | 0 | 140 | 0 |
| C | 0 | 140 | 0 |
| D | 0 | 140 | 0 |
| Mode M0 | |||
|---|---|---|---|
| Quadrant | BADHDUFLAG | Total packets | Discarded packets |
| A | 0 | 14214 | 4 |
| B | 0 | 15061 | 6 |
| C | 0 | 14402 | 6 |
| D | 0 | 15139 | 3 |
| Mode M9 | |||
|---|---|---|---|
| Quadrant | BADHDUFLAG | Total packets | Discarded packets |
| A | 0 | 7 | 0 |
| B | 0 | 7 | 0 |
| C | 0 | 7 | 0 |
| D | 0 | 7 | 0 |
| Quadrant | Total seconds | Saturated seconds | Saturation percentage |
|---|---|---|---|
| A | 6823 | 31 | 0.454346% |
| B | 6822 | 27 | 0.395778% |
| C | 6822 | 48 | 0.703606% |
| D | 6823 | 32 | 0.469002% |
Noise dominated data is calculated using 1-second bins in cleaned event files. If a bin has >2000 counts, and if more than 50% of those come from <1% of pixels, then it is considered to be noise-dominated and hence unusable.
| Quadrant | # 1 sec bins | Bins with >0 counts | Bins with >2000 counts | High rate bins dominated by noise | Noise dominated (total time) | Noise dominated (detector-on time) | Marked lightcurve |
|---|---|---|---|---|---|---|---|
| A | 7554 | 6825 | 5 | 5 | 0.07% | 0.07% | 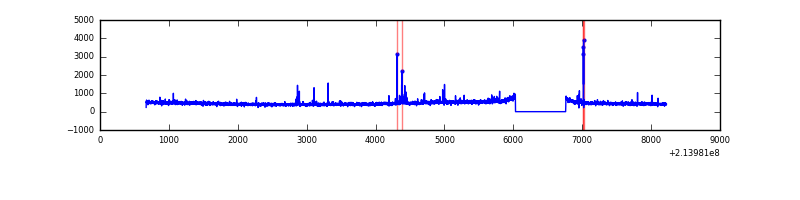 |
| B | 7554 | 6825 | 5 | 5 | 0.07% | 0.07% | 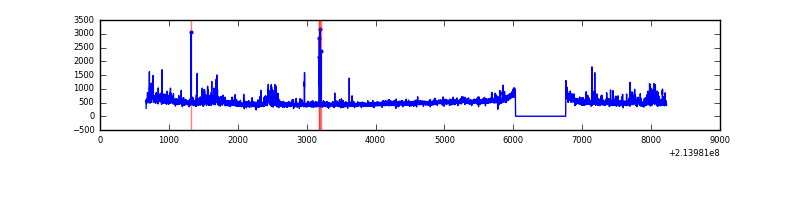 |
| C | 7554 | 6825 | 27 | 27 | 0.36% | 0.40% | 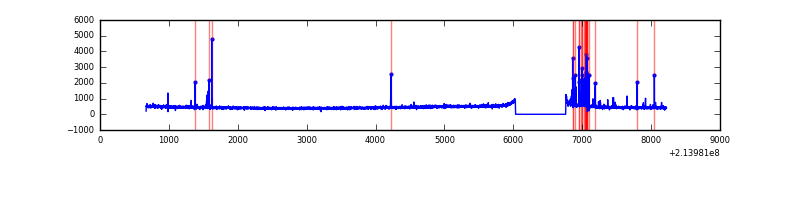 |
| D | 7554 | 6825 | 20 | 20 | 0.26% | 0.29% | 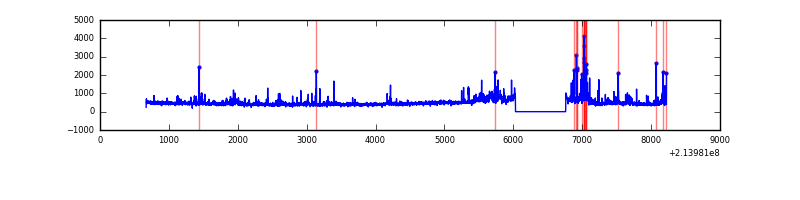 |
Top three noisy pixels from each quadrant. If the there are fewer than three noisy pixels in the level2.evt file, extra rows are filled as -1
| Pixel properties | Quadrant properties | ||||||
|---|---|---|---|---|---|---|---|
| Quadrant | DetID | PixID | Counts | Sigma | Mean | Median | Sigma |
| A | 7 | 16 | 70051 | 422.22 | 796 | 777 | 164.1 |
| A | 0 | 50 | 21241 | 124.73 | 796 | 777 | 164.1 |
| A | 0 | 226 | 8085 | 44.54 | 796 | 777 | 164.1 |
| B | 15 | 204 | 261404 | 1681.54 | 802 | 779 | 155.0 |
| B | 11 | 51 | 40849 | 258.53 | 802 | 779 | 155.0 |
| B | 5 | 172 | 31651 | 199.18 | 802 | 779 | 155.0 |
| C | 5 | 250 | 115200 | 636.13 | 765 | 769 | 179.9 |
| C | 1 | 16 | 64118 | 352.16 | 765 | 769 | 179.9 |
| C | 5 | 233 | 25558 | 137.8 | 765 | 769 | 179.9 |
| D | 2 | 136 | 249234 | 1320.79 | 765 | 741 | 188.1 |
| D | 2 | 63 | 152180 | 804.93 | 765 | 741 | 188.1 |
| D | 2 | 152 | 43647 | 228.05 | 765 | 741 | 188.1 |
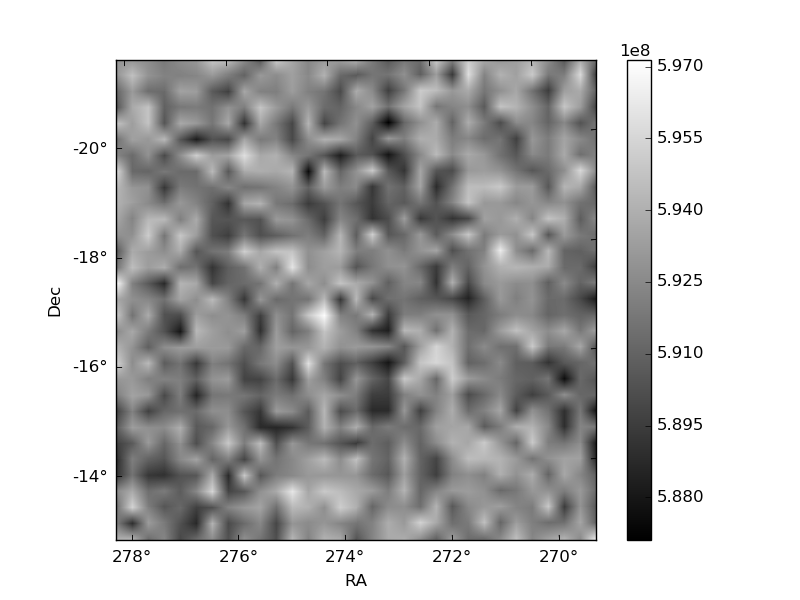
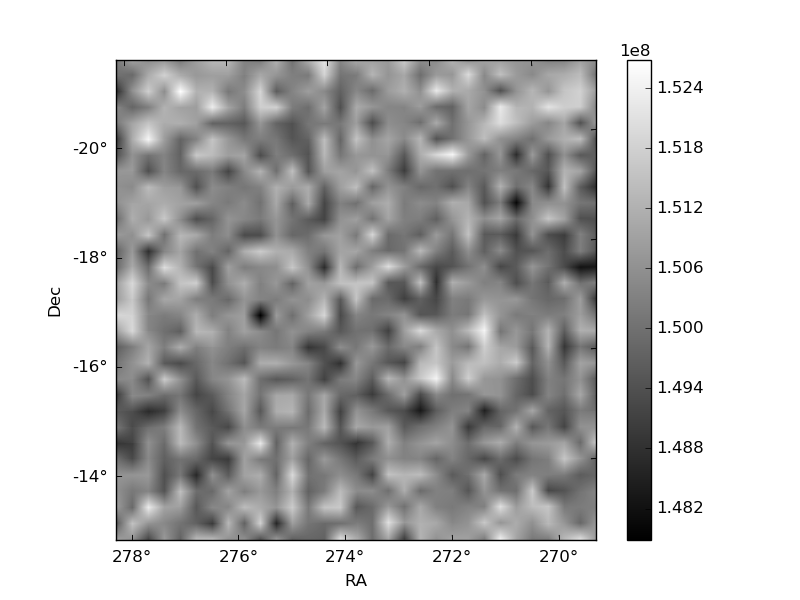
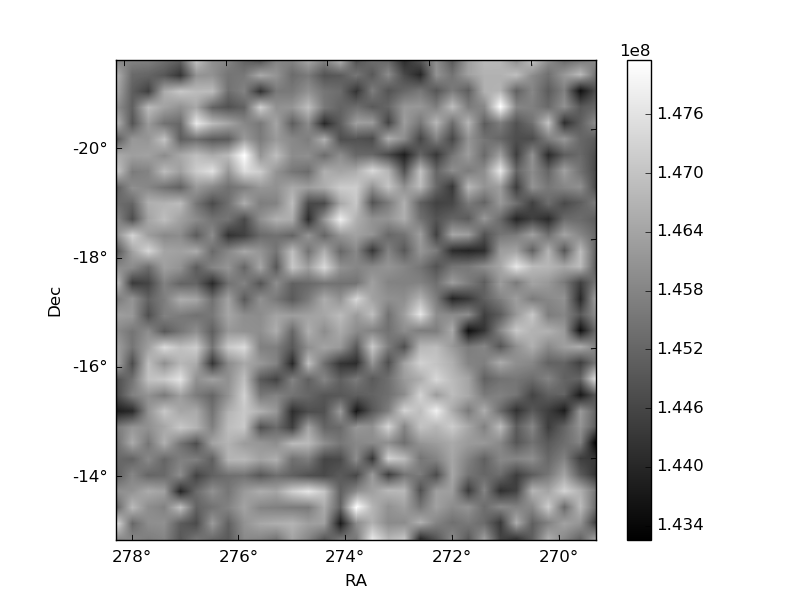
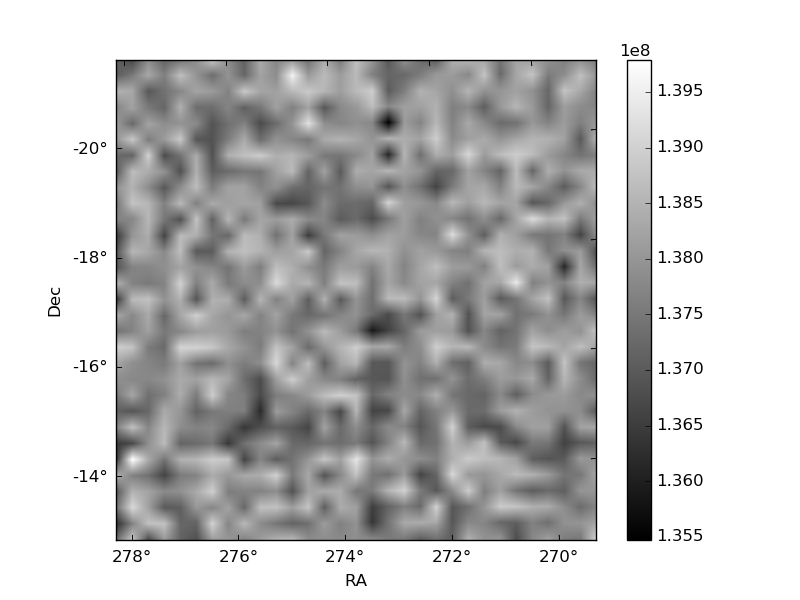
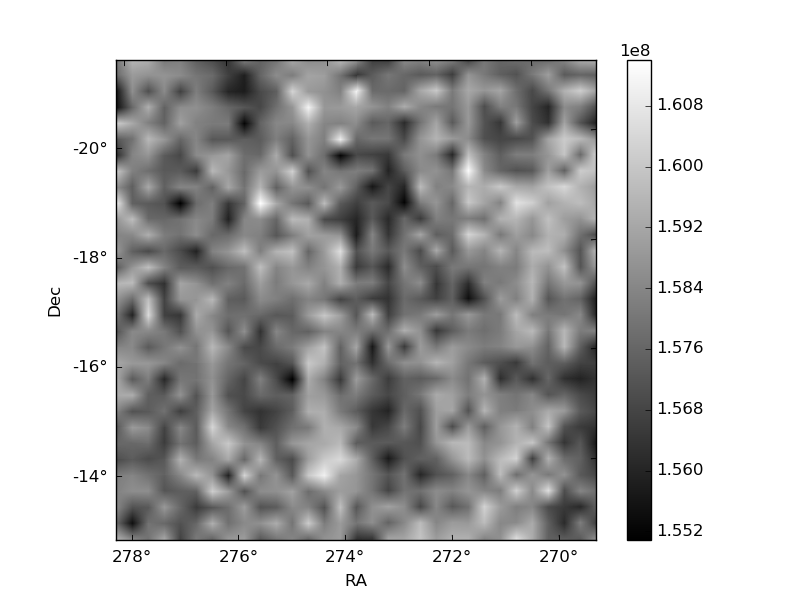
Histogram calculated using DETX and DETY for each event in the final _common_clean file
| Quadrant A | 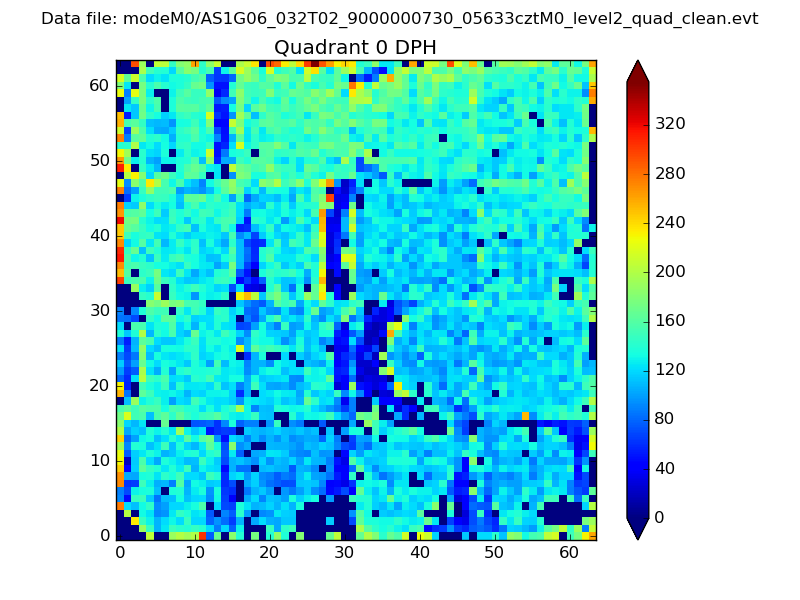 |
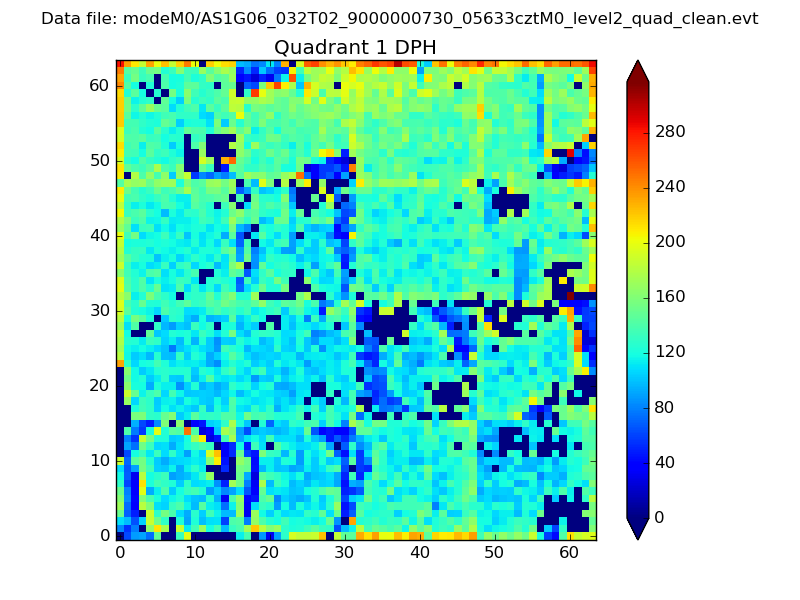 |
Quadrant B |
|---|---|---|---|
| Quadrant D | 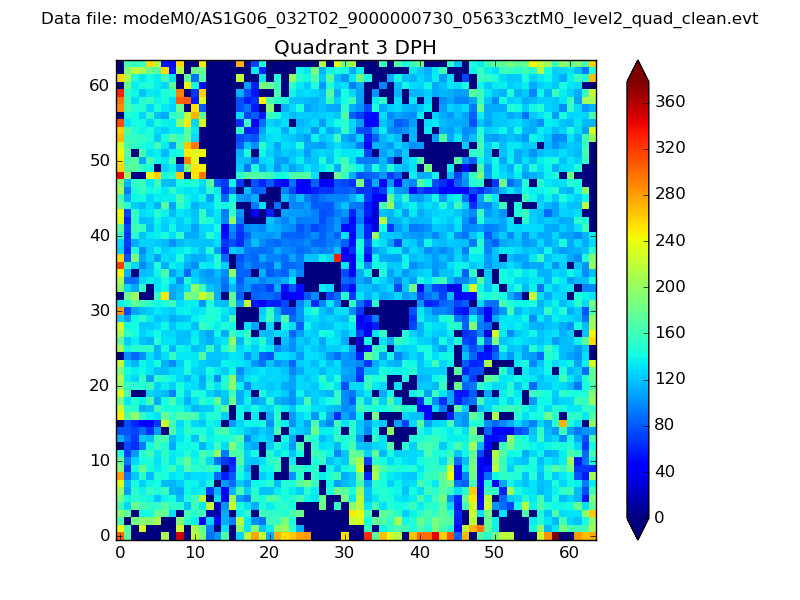 |
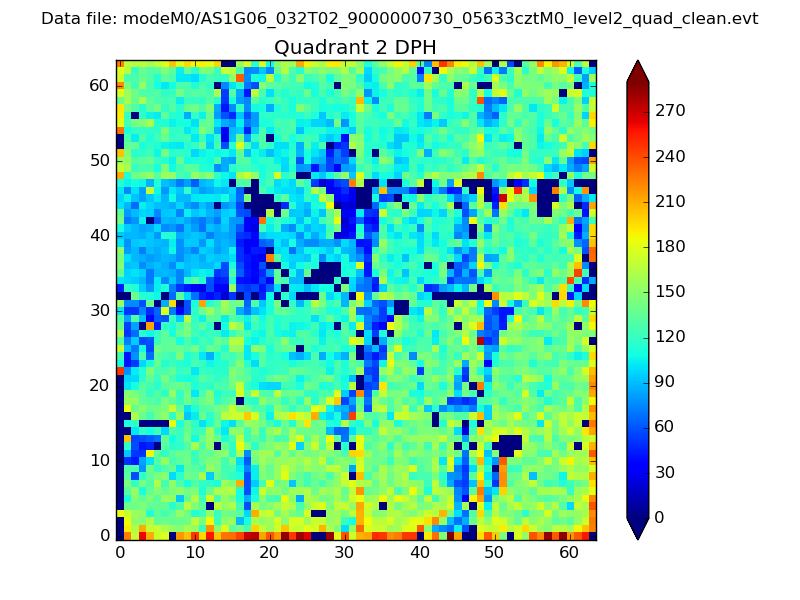 |
Quadrant C |
| Plot type | Count rate plots | Images |
|---|---|---|
| Comparison with Poisson distribution Blue bars denote a histogram of data divided into 1 sec bins. Red curve is a Poisson curve with rate = median count rate of data. |
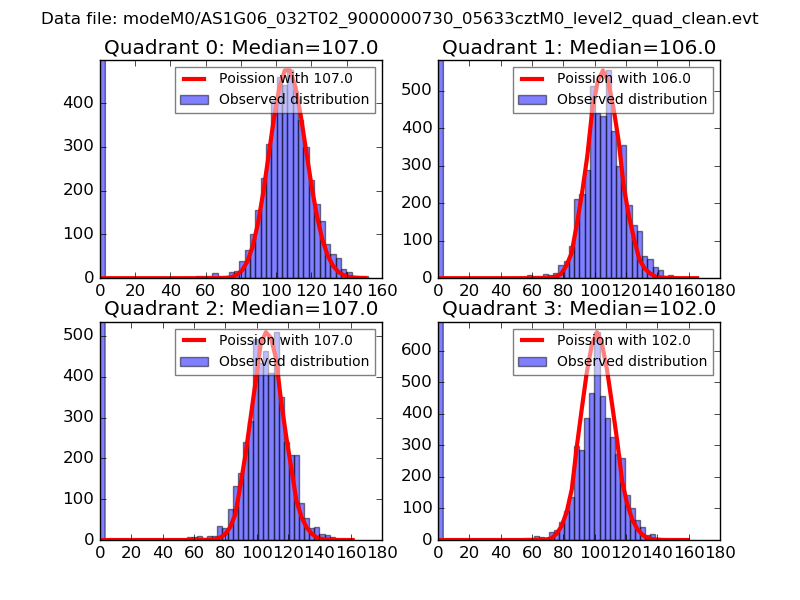 |
 |
| Quadrant-wise count rates Data is divided into 100 sec bins |
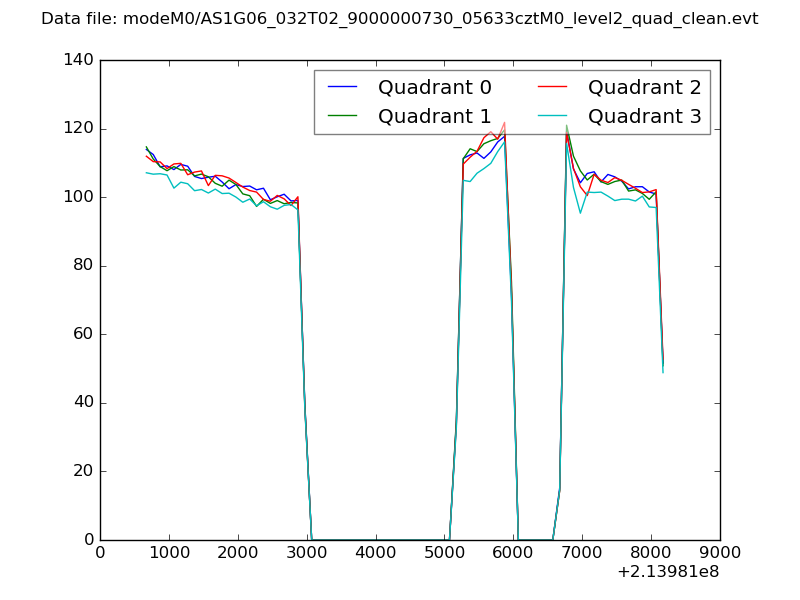 |
|
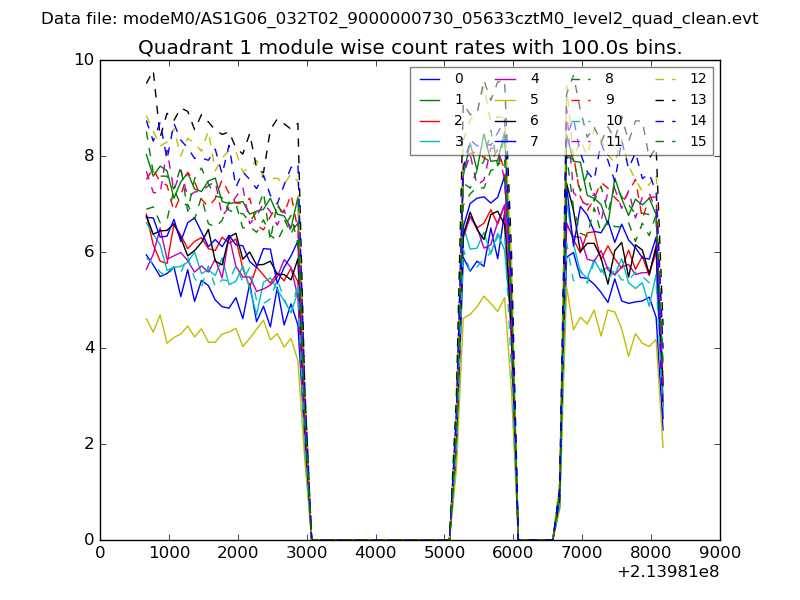
| Module-wise count rates for Quadrant A Data is divided into 100 sec bins |
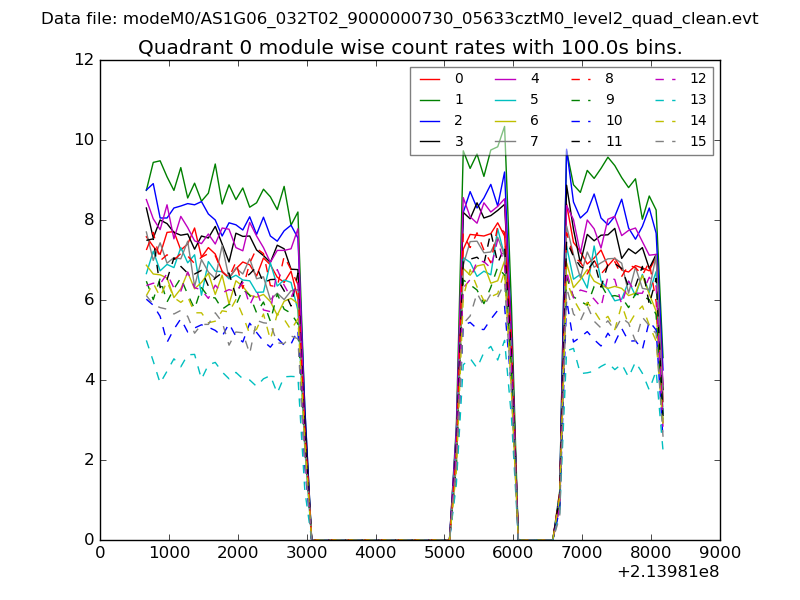 |
 |
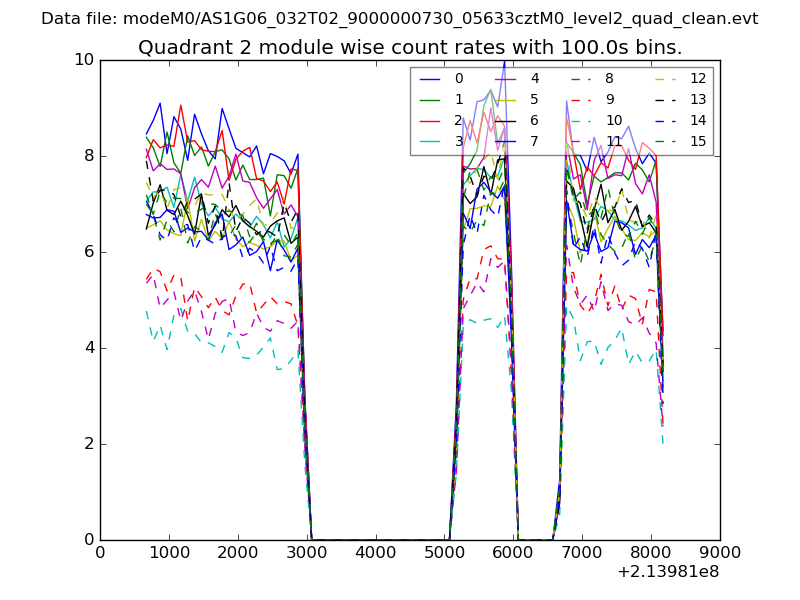
| Module-wise count rates for Quadrant B Data is divided into 100 sec bins |
 |
 |
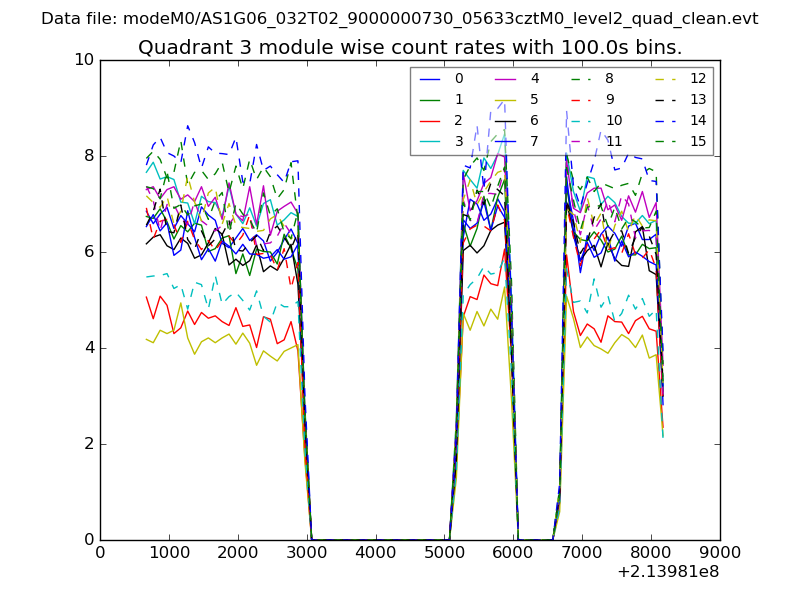
| Module-wise count rates for Quadrant C Data is divided into 100 sec bins |
 |
 |
| Module-wise count rates for Quadrant D Data is divided into 100 sec bins |
 |
 |
| Parameter | Plot |
|---|---|
| CZT HV Monitor |  |
| D_VDD | 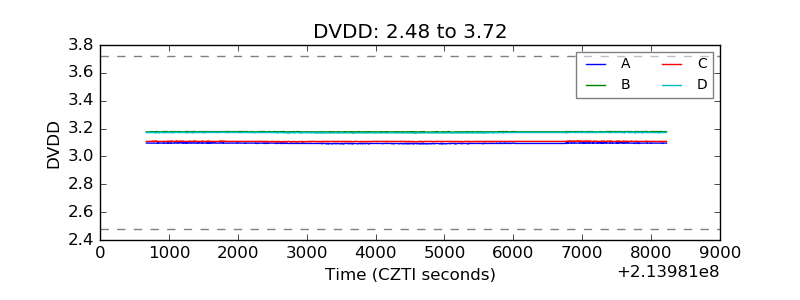 |
| Temperature 1 | 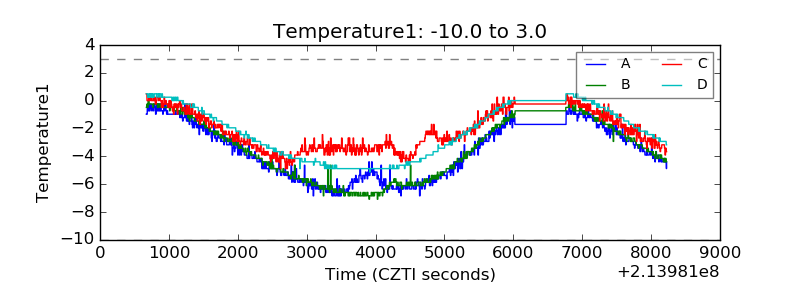 |
| Veto HV Monitor | 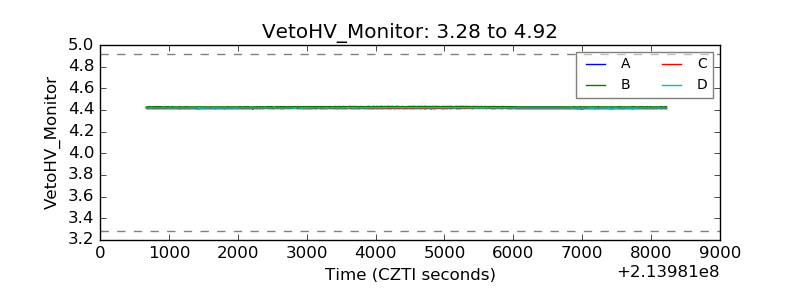 |
| Veto LLD | 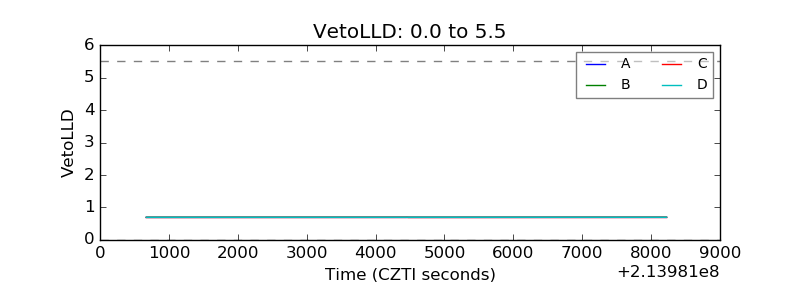 |
| Alpha Counter | 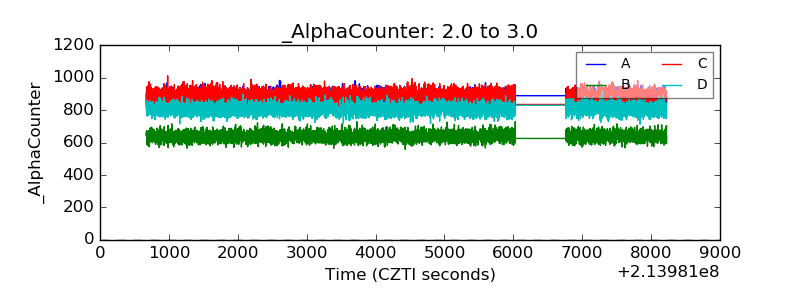 |
| _CPM_Rate | 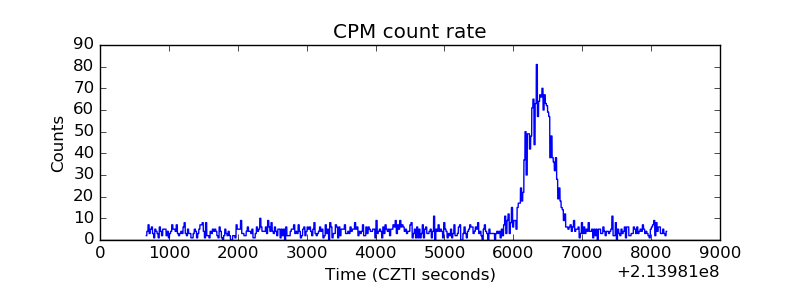 |
| CZT Counter | 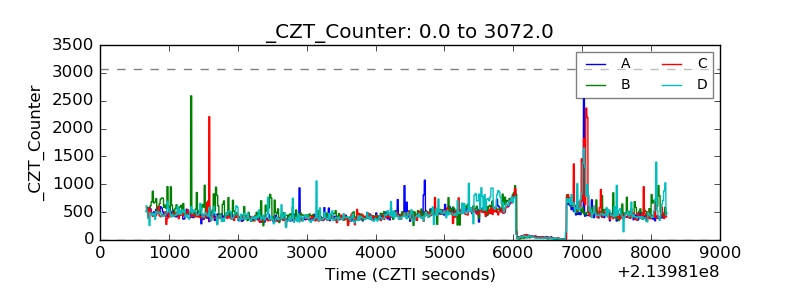 |
| +2.5 Volts monitor |  |
| +5 Volts monitor |  |
| _ROLL_ROT | 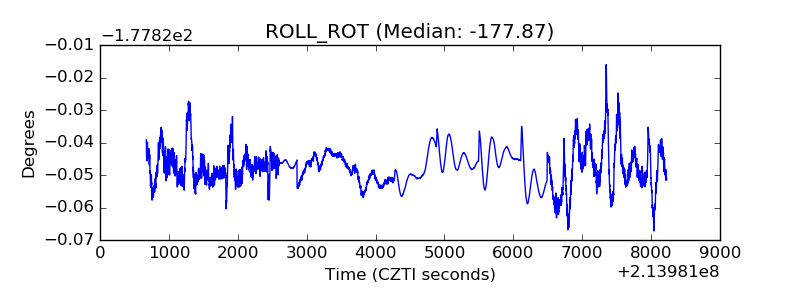 |
| _Roll_DEC | 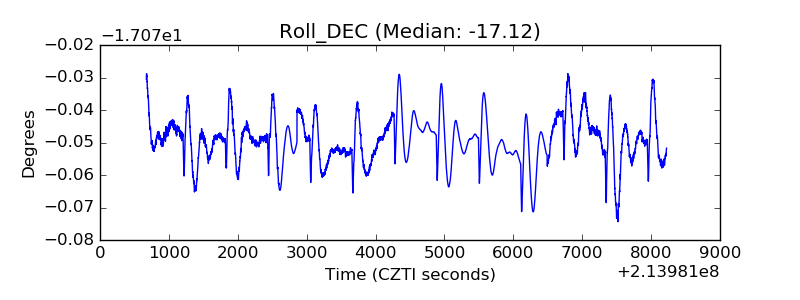 |
| _Roll_RA | 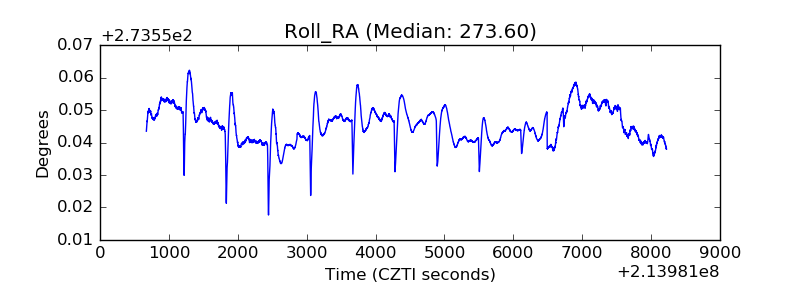 |
| Veto Counter | 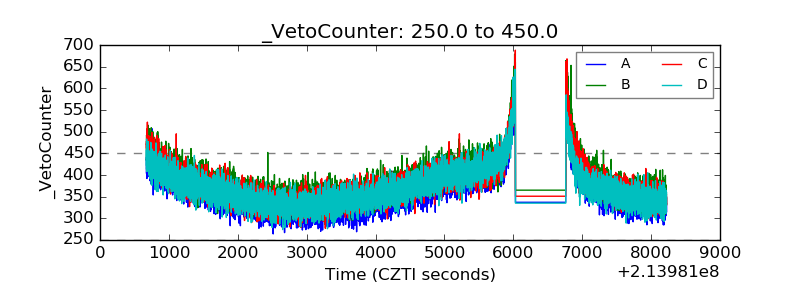 |