| Param | Original file | Final file |
|---|---|---|
| Filename | modeM0/AS1G06_032T02_9000000730_05634cztM0_level2.evt | modeM0/AS1G06_032T02_9000000730_05634cztM0_level2_quad_clean.evt |
| Size (bytes) | 490,020,480 | 83,226,240 |
| Size | 467.3 MB | 79.4 MB |
| Events in quadrant A | 3,189,515 | 515,738 |
| Events in quadrant B | 3,921,549 | 507,618 |
| Events in quadrant C | 3,301,715 | 515,932 |
| Events in quadrant D | 3,948,234 | 489,536 |
| Mode SS | |||
|---|---|---|---|
| Quadrant | BADHDUFLAG | Total packets | Discarded packets |
| A | 0 | 146 | 0 |
| B | 0 | 146 | 6 |
| C | 0 | 146 | 6 |
| D | 0 | 146 | 4 |
| Mode M0 | |||
|---|---|---|---|
| Quadrant | BADHDUFLAG | Total packets | Discarded packets |
| A | 0 | 14803 | 348 |
| B | 0 | 16725 | 468 |
| C | 0 | 15185 | 407 |
| D | 0 | 17117 | 502 |
| Mode M9 | |||
|---|---|---|---|
| Quadrant | BADHDUFLAG | Total packets | Discarded packets |
| A | 0 | 3 | 0 |
| B | 0 | 3 | 0 |
| C | 0 | 3 | 0 |
| D | 0 | 3 | 0 |
| Quadrant | Total seconds | Saturated seconds | Saturation percentage |
|---|---|---|---|
| A | 7069 | 32 | 0.452681% |
| B | 7043 | 106 | 1.505040% |
| C | 7054 | 35 | 0.496172% |
| D | 7047 | 68 | 0.964950% |
Noise dominated data is calculated using 1-second bins in cleaned event files. If a bin has >2000 counts, and if more than 50% of those come from <1% of pixels, then it is considered to be noise-dominated and hence unusable.
| Quadrant | # 1 sec bins | Bins with >0 counts | Bins with >2000 counts | High rate bins dominated by noise | Noise dominated (total time) | Noise dominated (detector-on time) | Marked lightcurve |
|---|---|---|---|---|---|---|---|
| A | 7537 | 7231 | 2 | 2 | 0.03% | 0.03% | 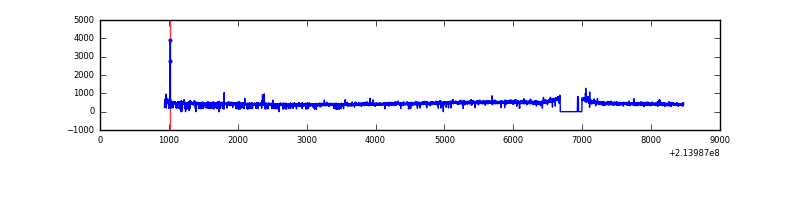 |
| B | 7537 | 7221 | 34 | 34 | 0.45% | 0.47% | 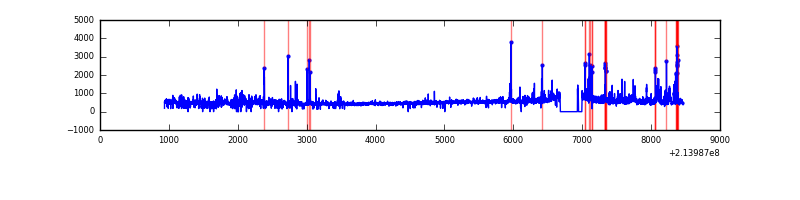 |
| C | 7537 | 7217 | 18 | 18 | 0.24% | 0.25% | 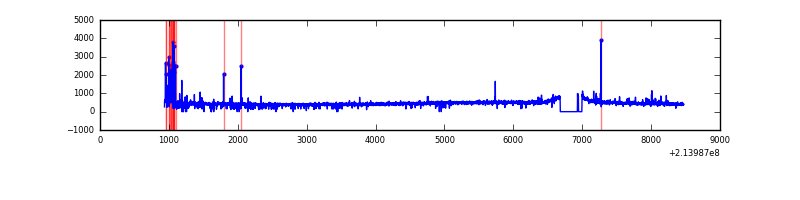 |
| D | 7537 | 7223 | 30 | 30 | 0.40% | 0.42% | 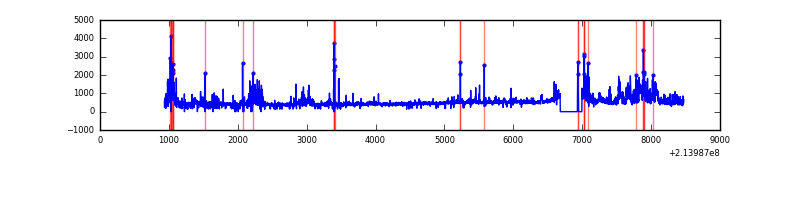 |
Top three noisy pixels from each quadrant. If the there are fewer than three noisy pixels in the level2.evt file, extra rows are filled as -1
| Pixel properties | Quadrant properties | ||||||
|---|---|---|---|---|---|---|---|
| Quadrant | DetID | PixID | Counts | Sigma | Mean | Median | Sigma |
| A | 0 | 50 | 15834 | 88.74 | 818 | 798 | 169.4 |
| A | 0 | 254 | 9461 | 51.13 | 818 | 798 | 169.4 |
| A | 0 | 226 | 8295 | 44.25 | 818 | 798 | 169.4 |
| B | 15 | 204 | 248317 | 1545.7 | 823 | 806 | 160.1 |
| B | 5 | 172 | 190232 | 1182.96 | 823 | 806 | 160.1 |
| B | 11 | 51 | 117128 | 726.43 | 823 | 806 | 160.1 |
| C | 1 | 16 | 116213 | 626.75 | 789 | 796 | 184.2 |
| C | 5 | 250 | 74820 | 401.97 | 789 | 796 | 184.2 |
| C | 5 | 233 | 15997 | 82.55 | 789 | 796 | 184.2 |
| D | 2 | 136 | 371098 | 1902.07 | 785 | 759 | 194.7 |
| D | 1 | 20 | 187461 | 958.91 | 785 | 759 | 194.7 |
| D | 11 | 241 | 70333 | 357.33 | 785 | 759 | 194.7 |
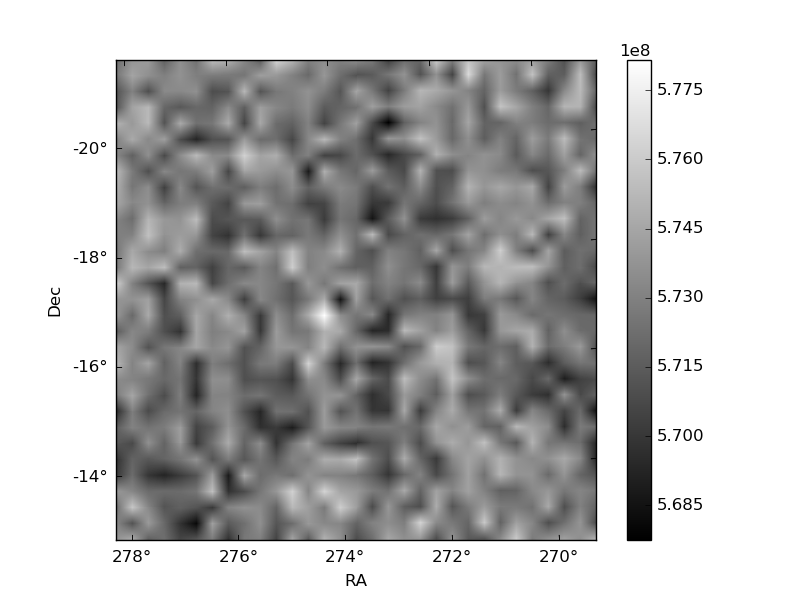
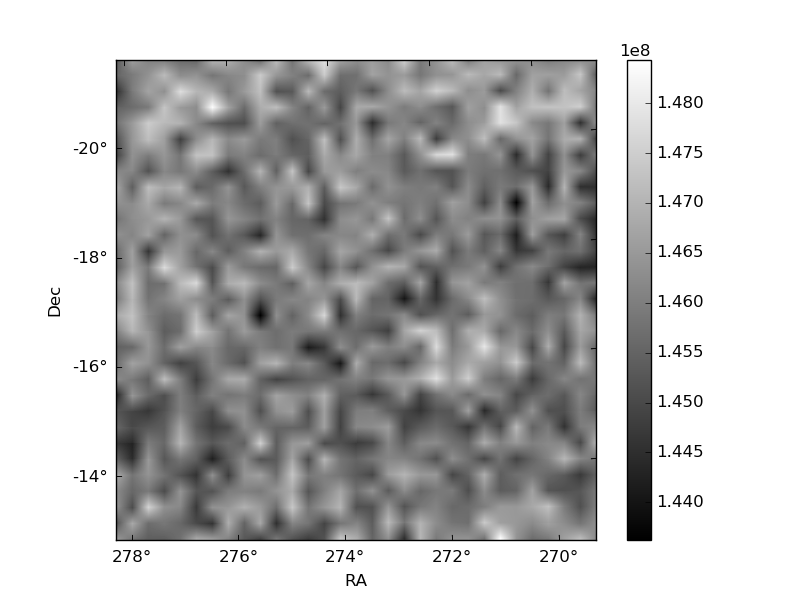
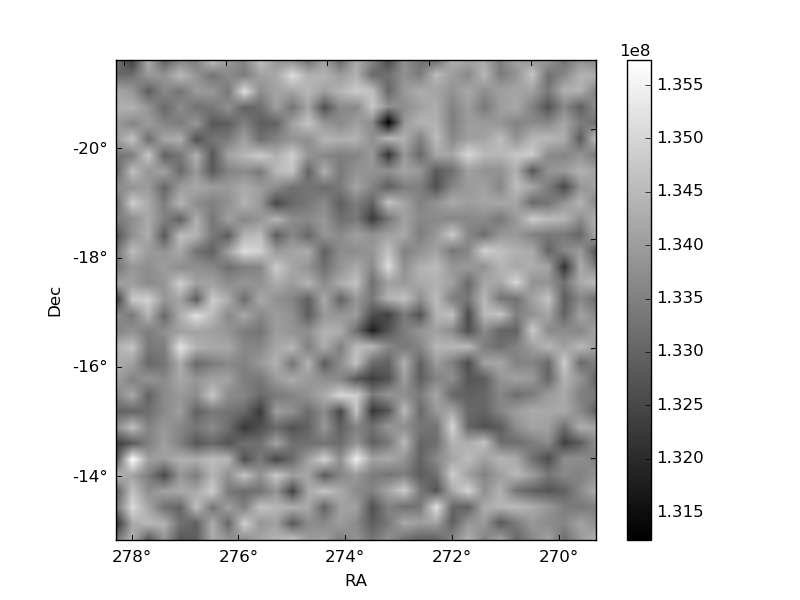
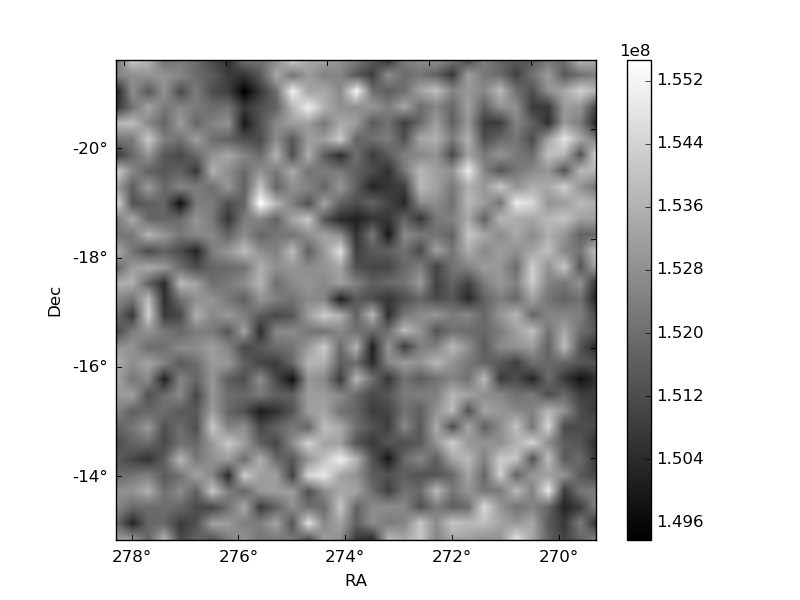
Histogram calculated using DETX and DETY for each event in the final _common_clean file
| Quadrant A | 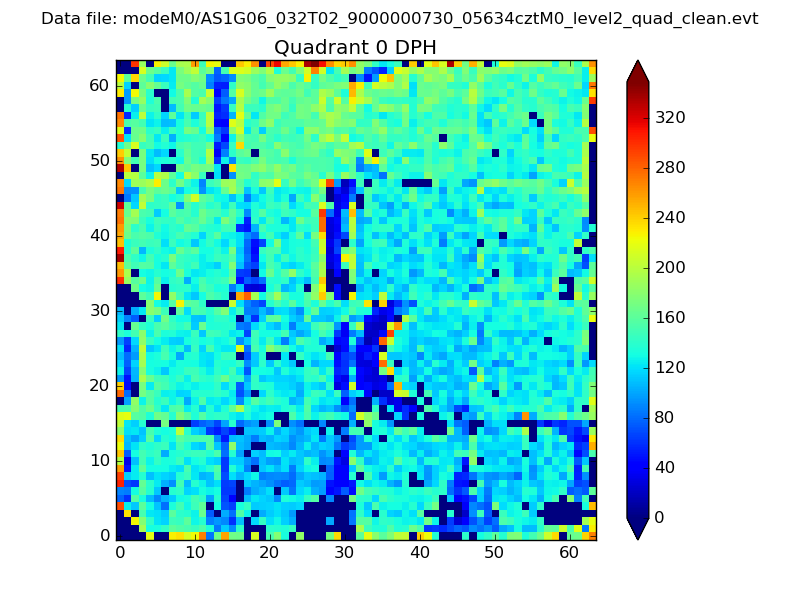 |
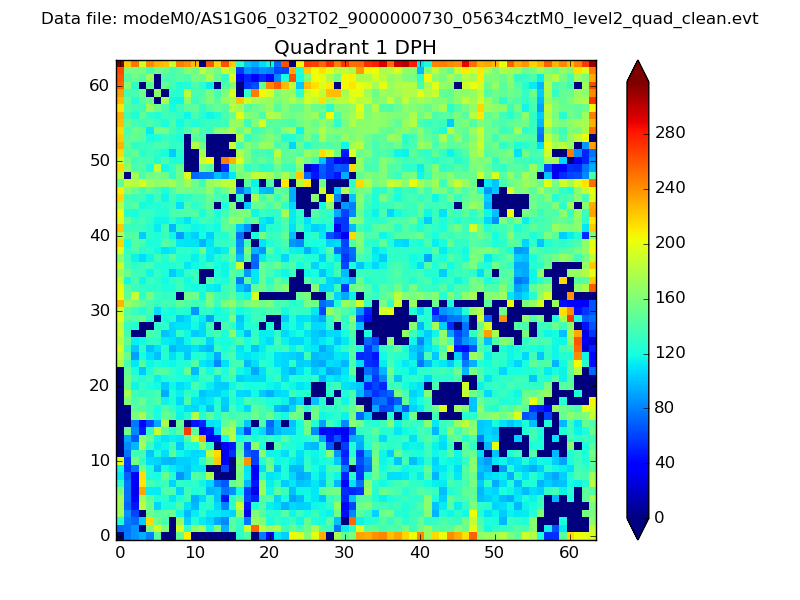 |
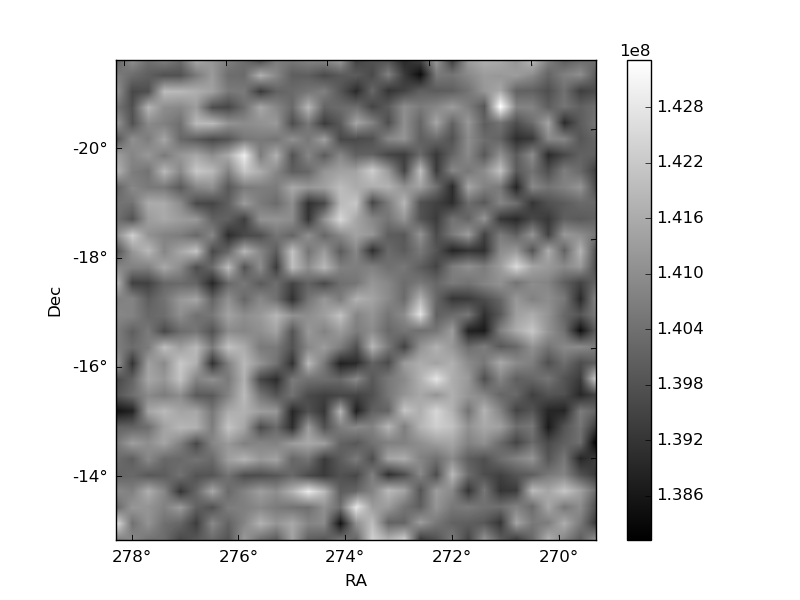
Quadrant B |
|---|---|---|---|
| Quadrant D | 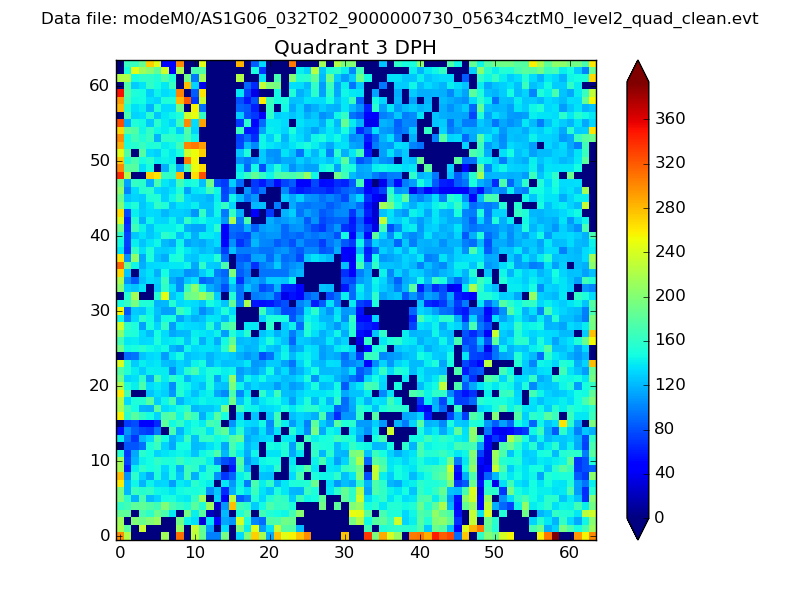 |
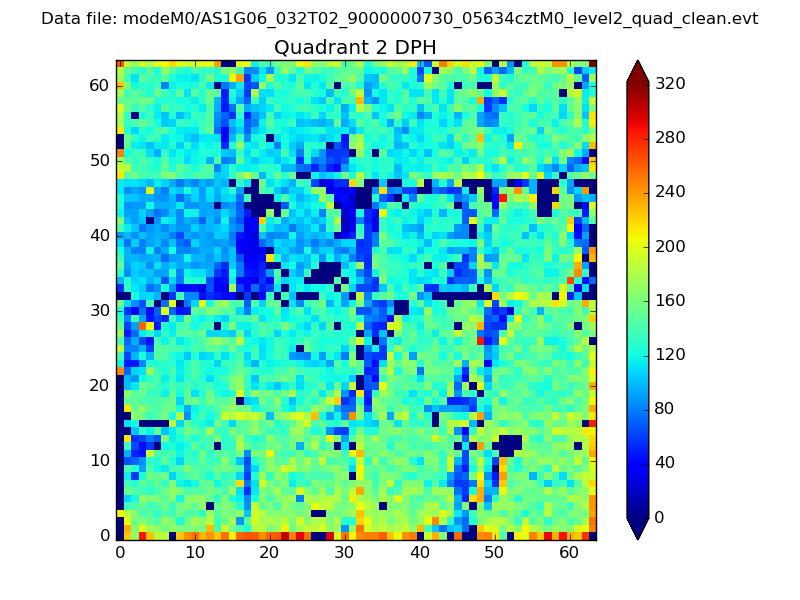 |
Quadrant C |
| Plot type | Count rate plots | Images |
|---|---|---|
| Comparison with Poisson distribution Blue bars denote a histogram of data divided into 1 sec bins. Red curve is a Poisson curve with rate = median count rate of data. |
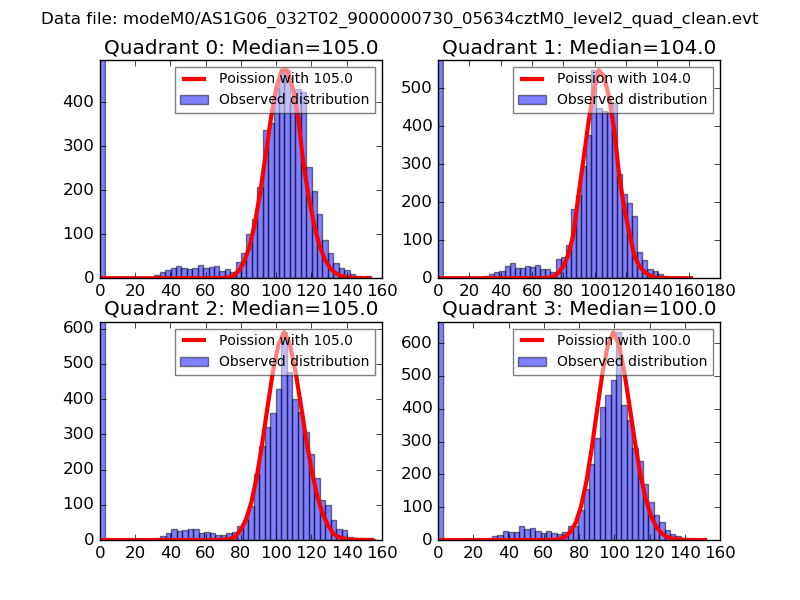 |
 |
| Quadrant-wise count rates Data is divided into 100 sec bins |
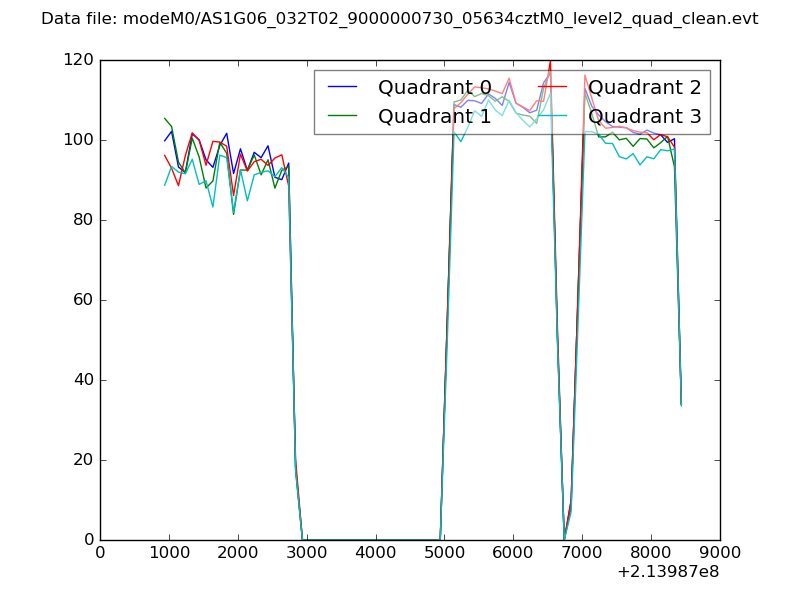 |
|
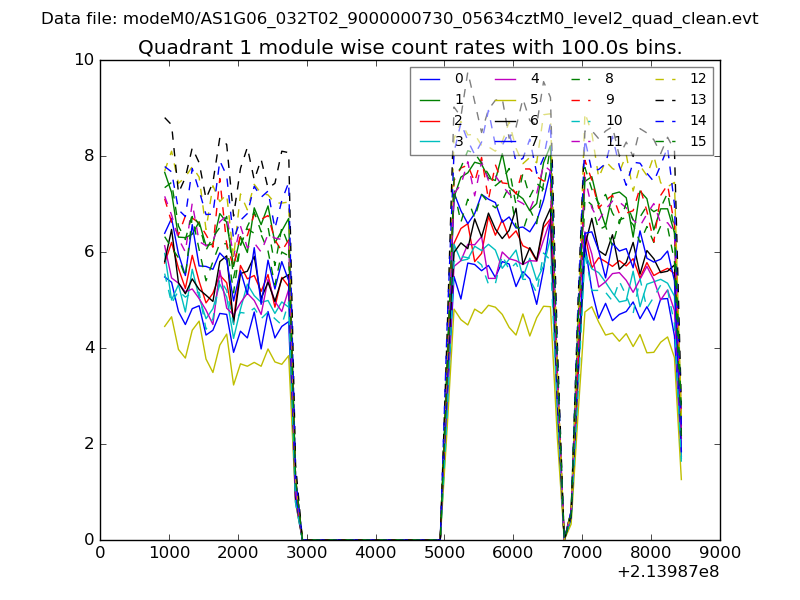
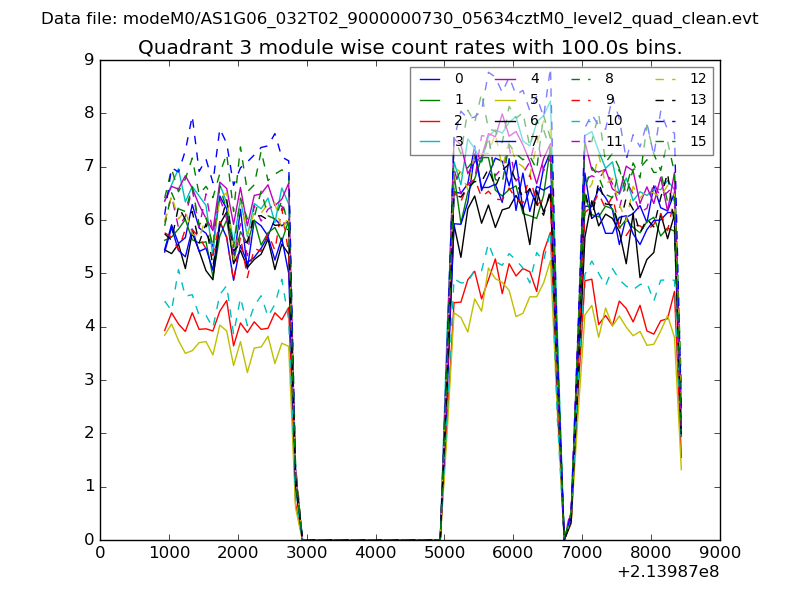
| Module-wise count rates for Quadrant A Data is divided into 100 sec bins |
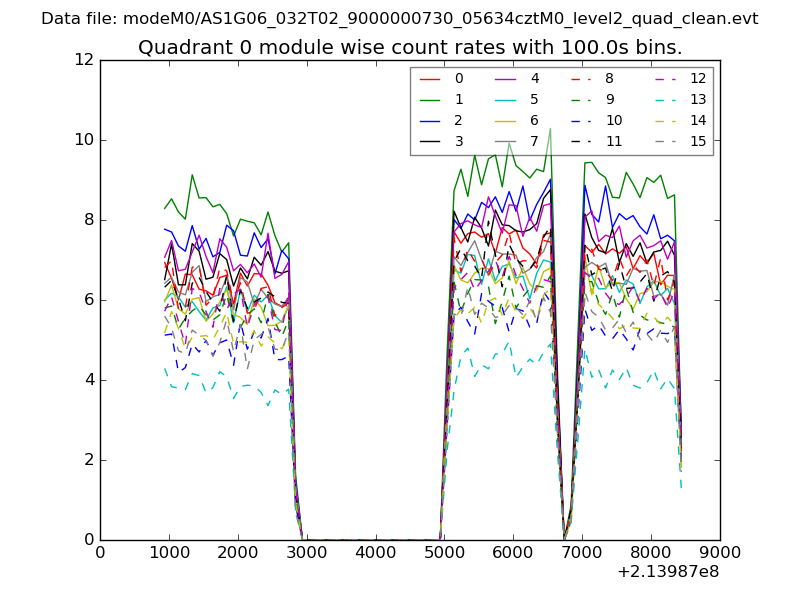 |
 |
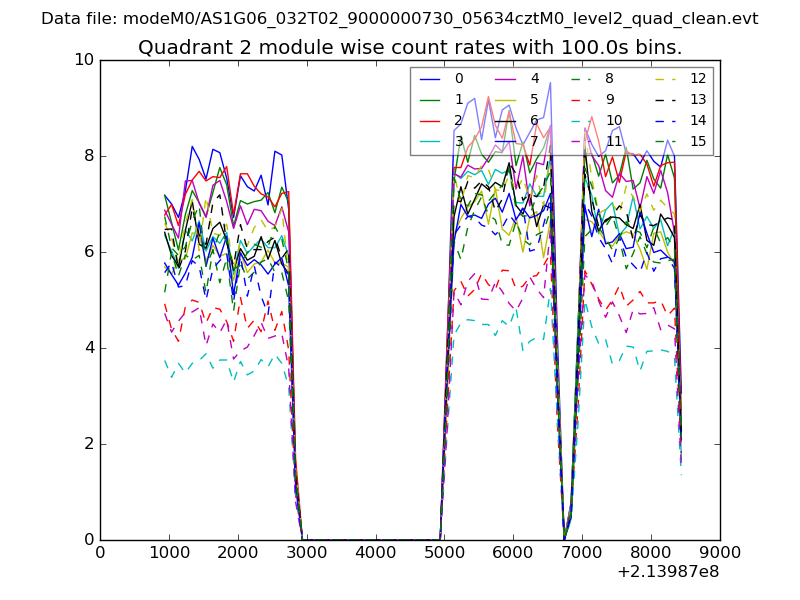
| Module-wise count rates for Quadrant B Data is divided into 100 sec bins |
 |
 |
| Module-wise count rates for Quadrant C Data is divided into 100 sec bins |
 |
 |
| Module-wise count rates for Quadrant D Data is divided into 100 sec bins |
 |
 |
| Parameter | Plot |
|---|---|
| CZT HV Monitor | 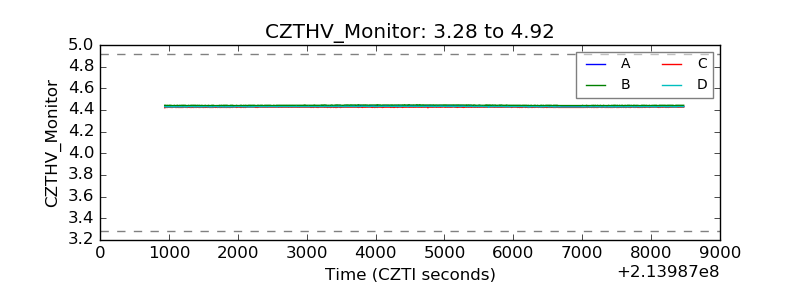 |
| D_VDD | 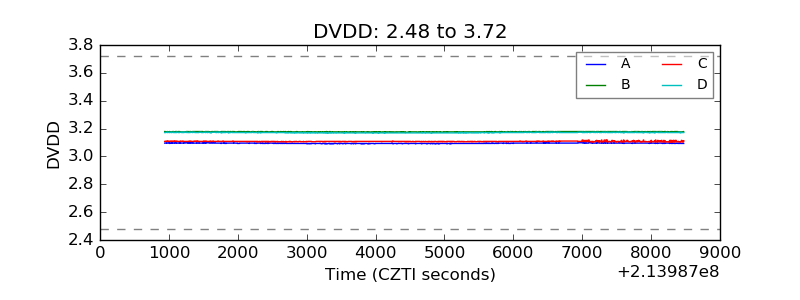 |
| Temperature 1 | 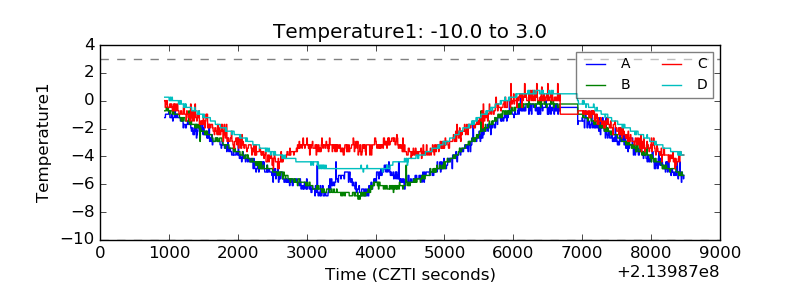 |
| Veto HV Monitor | 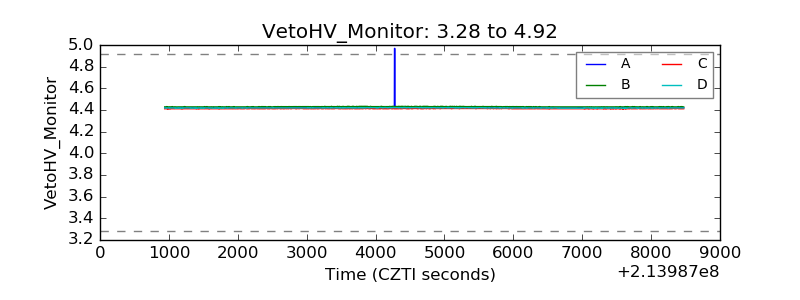 |
| Veto LLD | 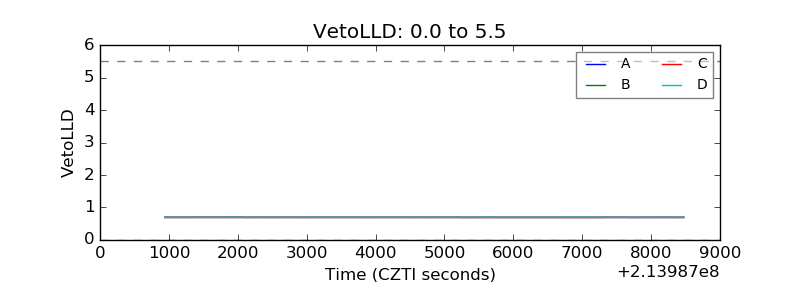 |
| Alpha Counter | 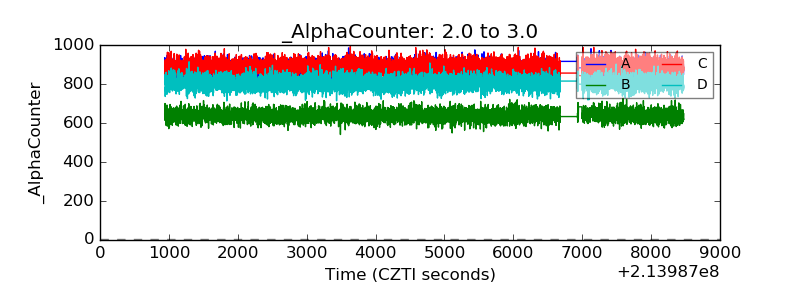 |
| _CPM_Rate | 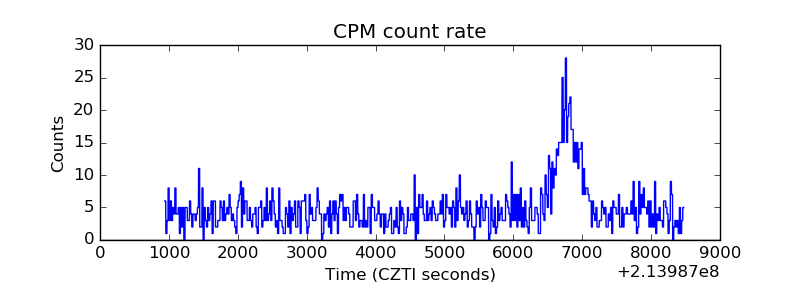 |
| CZT Counter | 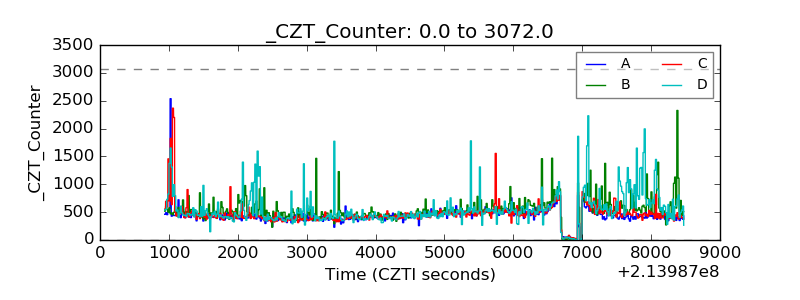 |
| +2.5 Volts monitor |  |
| +5 Volts monitor |  |
| _ROLL_ROT | 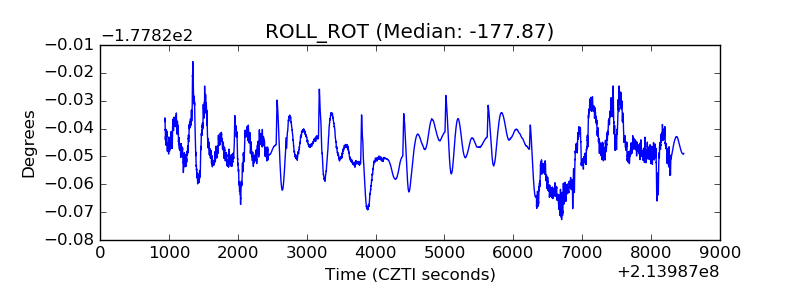 |
| _Roll_DEC | 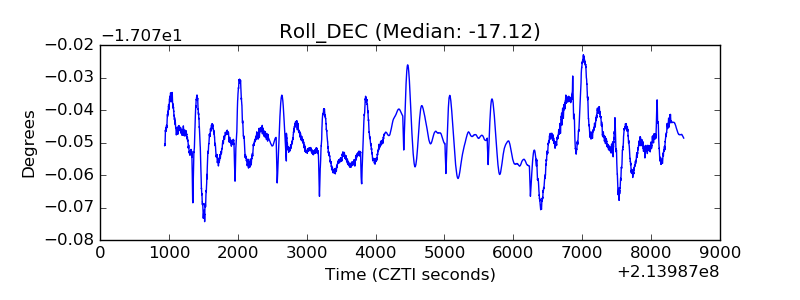 |
| _Roll_RA | 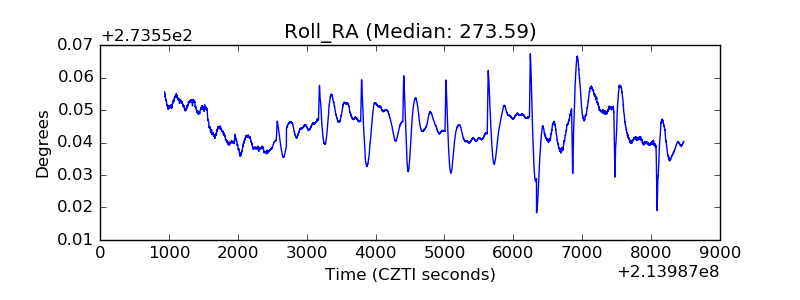 |
| Veto Counter | 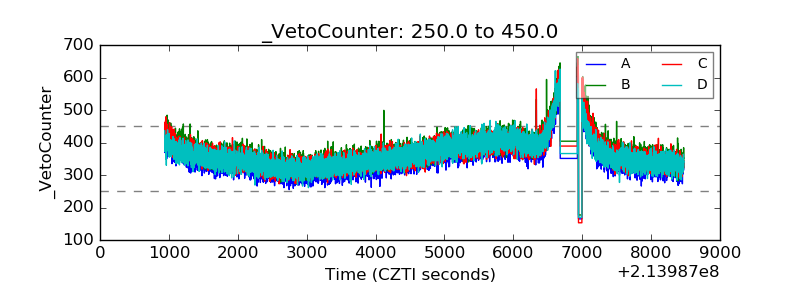 |