| Param | Original file | Final file |
|---|---|---|
| Filename | modeM0/AS1G06_032T02_9000000730_05638cztM0_level2.evt | modeM0/AS1G06_032T02_9000000730_05638cztM0_level2_quad_clean.evt |
| Size (bytes) | 669,602,880 | 99,336,960 |
| Size | 638.6 MB | 94.7 MB |
| Events in quadrant A | 4,793,077 | 585,124 |
| Events in quadrant B | 5,016,782 | 572,128 |
| Events in quadrant C | 4,608,906 | 588,457 |
| Events in quadrant D | 5,154,340 | 543,259 |
| Mode SS | |||
|---|---|---|---|
| Quadrant | BADHDUFLAG | Total packets | Discarded packets |
| A | 0 | 253 | 44 |
| B | 0 | 254 | 40 |
| C | 0 | 253 | 37 |
| D | 0 | 254 | 44 |
| Mode M0 | |||
|---|---|---|---|
| Quadrant | BADHDUFLAG | Total packets | Discarded packets |
| A | 0 | 26213 | 4570 |
| B | 0 | 26582 | 4720 |
| C | 0 | 25436 | 4278 |
| D | 0 | 29152 | 6324 |
| Mode M9 | |||
|---|---|---|---|
| Quadrant | BADHDUFLAG | Total packets | Discarded packets |
| A | 0 | 14 | 0 |
| B | 0 | 14 | 0 |
| C | 0 | 14 | 2 |
| D | 0 | 14 | 0 |
| Quadrant | Total seconds | Saturated seconds | Saturation percentage |
|---|---|---|---|
| A | 10423 | 111 | 1.064953% |
| B | 10338 | 81 | 0.783517% |
| C | 10414 | 38 | 0.364893% |
| D | 10265 | 158 | 1.539211% |
Noise dominated data is calculated using 1-second bins in cleaned event files. If a bin has >2000 counts, and if more than 50% of those come from <1% of pixels, then it is considered to be noise-dominated and hence unusable.
| Quadrant | # 1 sec bins | Bins with >0 counts | Bins with >2000 counts | High rate bins dominated by noise | Noise dominated (total time) | Noise dominated (detector-on time) | Marked lightcurve |
|---|---|---|---|---|---|---|---|
| A | 13880 | 11658 | 28 | 28 | 0.20% | 0.24% |  |
| B | 13880 | 11608 | 7 | 7 | 0.05% | 0.06% | 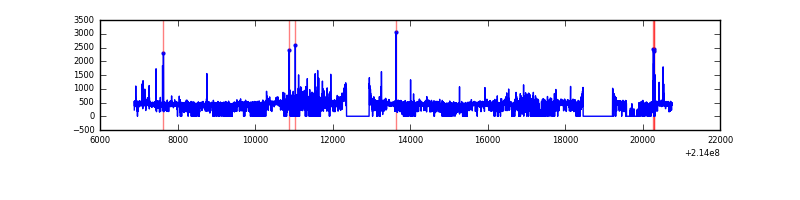 |
| C | 13880 | 11627 | 1 | 1 | 0.01% | 0.01% | 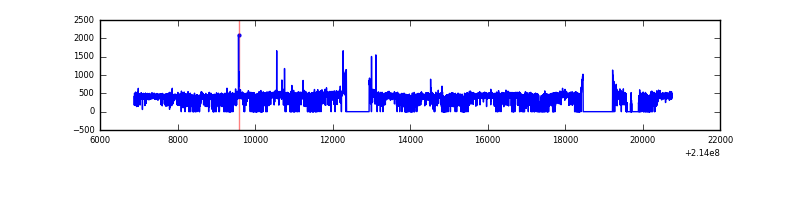 |
| D | 13880 | 11512 | 61 | 61 | 0.44% | 0.53% | 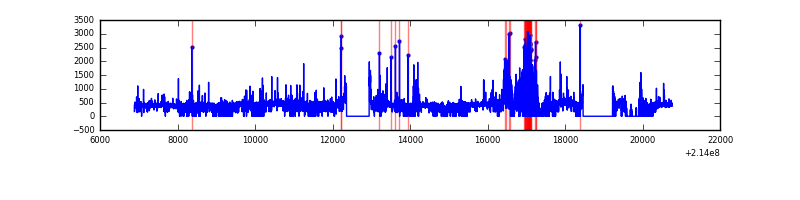 |
Top three noisy pixels from each quadrant. If the there are fewer than three noisy pixels in the level2.evt file, extra rows are filled as -1
| Pixel properties | Quadrant properties | ||||||
|---|---|---|---|---|---|---|---|
| Quadrant | DetID | PixID | Counts | Sigma | Mean | Median | Sigma |
| A | 14 | 111 | 174136 | 703.78 | 1191 | 1163 | 245.8 |
| A | 0 | 50 | 19479 | 74.52 | 1191 | 1163 | 245.8 |
| A | 0 | 226 | 11753 | 43.09 | 1191 | 1163 | 245.8 |
| B | 0 | 214 | 115979 | 502.3 | 1194 | 1166 | 228.6 |
| B | 15 | 204 | 113354 | 490.82 | 1194 | 1166 | 228.6 |
| B | 11 | 51 | 82932 | 357.72 | 1194 | 1166 | 228.6 |
| C | 1 | 16 | 72785 | 266.84 | 1155 | 1162 | 268.4 |
| C | 8 | 128 | 11151 | 37.22 | 1155 | 1162 | 268.4 |
| C | 13 | 61 | 9485 | 31.01 | 1155 | 1162 | 268.4 |
| D | 12 | 79 | 497906 | 1774.38 | 1133 | 1097 | 280.0 |
| D | 2 | 152 | 64479 | 226.37 | 1133 | 1097 | 280.0 |
| D | 9 | 85 | 41975 | 146.0 | 1133 | 1097 | 280.0 |
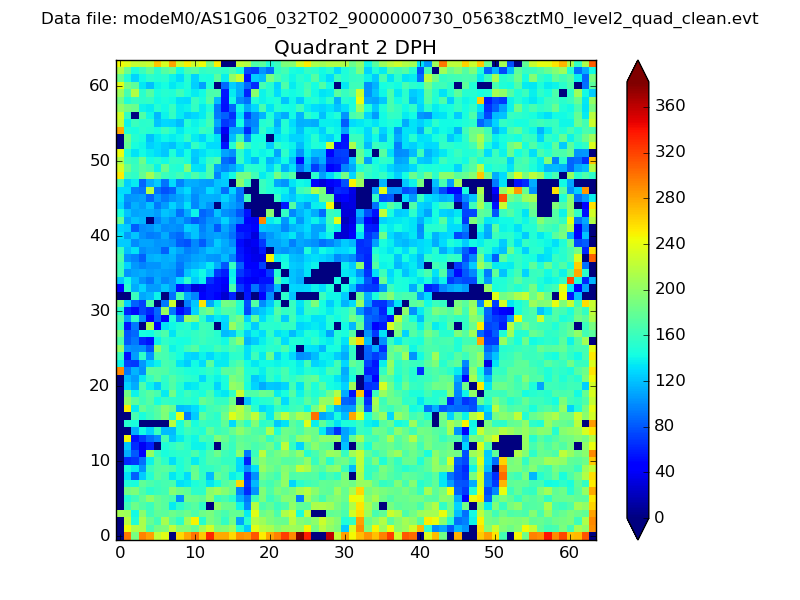
Histogram calculated using DETX and DETY for each event in the final _common_clean file
| Quadrant A | 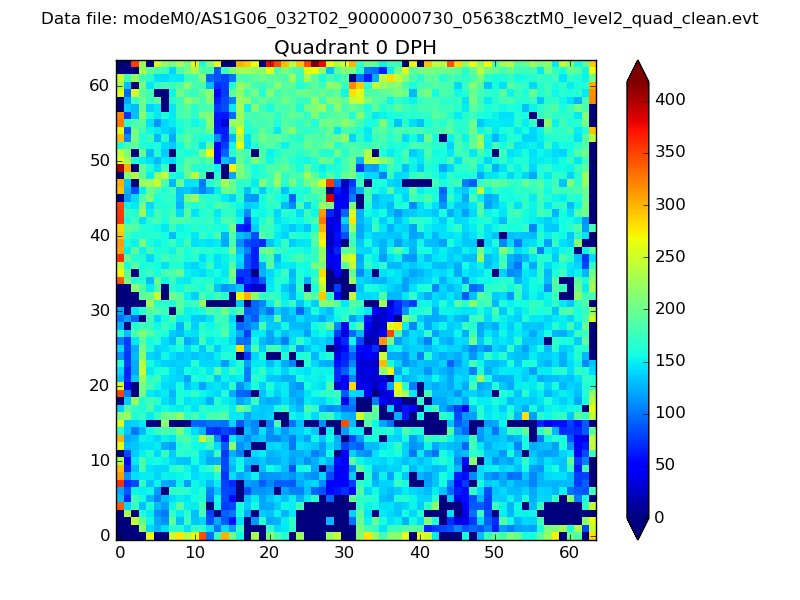 |
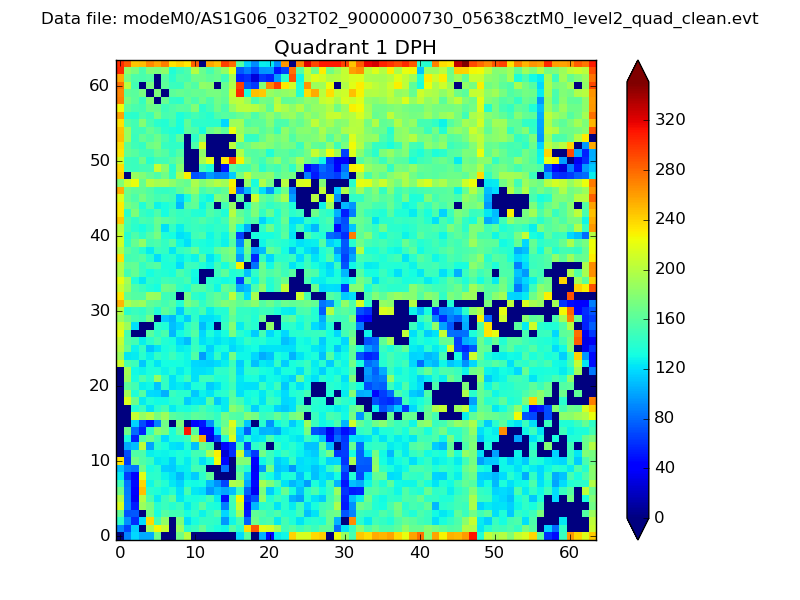 |
Quadrant B |
|---|---|---|---|
| Quadrant D | 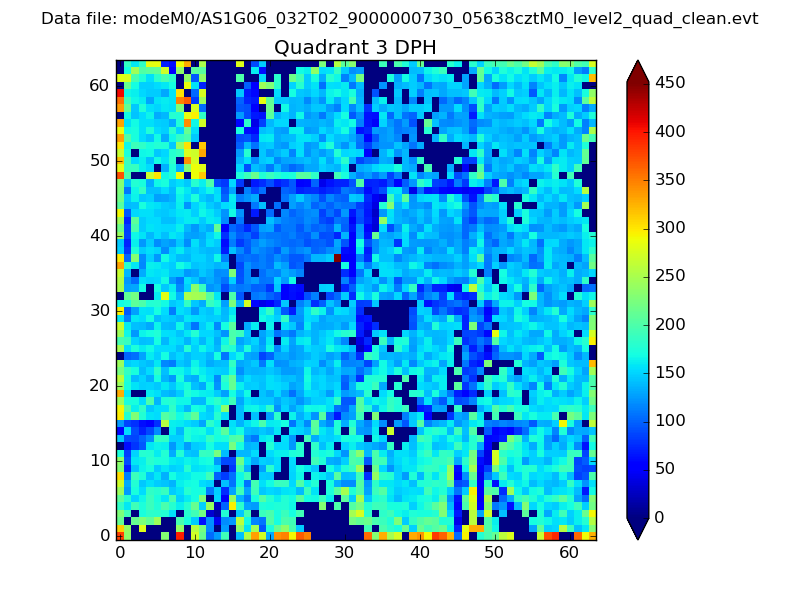 |
 |
Quadrant C |
| Plot type | Count rate plots | Images |
|---|---|---|
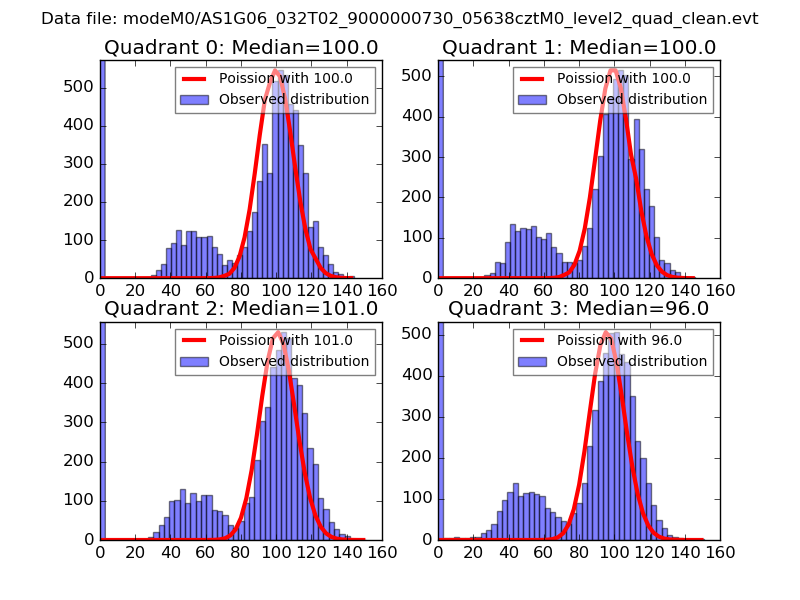
| Comparison with Poisson distribution Blue bars denote a histogram of data divided into 1 sec bins. Red curve is a Poisson curve with rate = median count rate of data. |
 |
 |
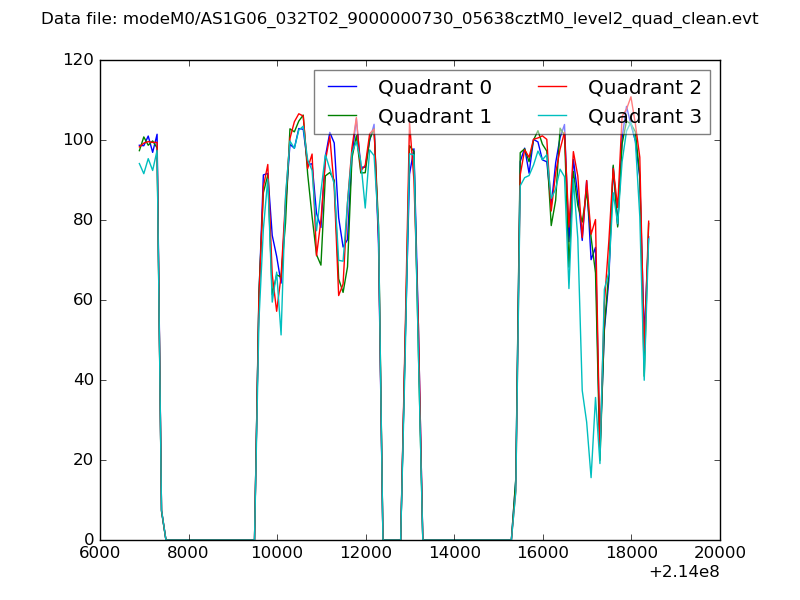
| Quadrant-wise count rates Data is divided into 100 sec bins |
 |
|
| Module-wise count rates for Quadrant A Data is divided into 100 sec bins |
 |
 |
| Module-wise count rates for Quadrant B Data is divided into 100 sec bins |
 |
 |
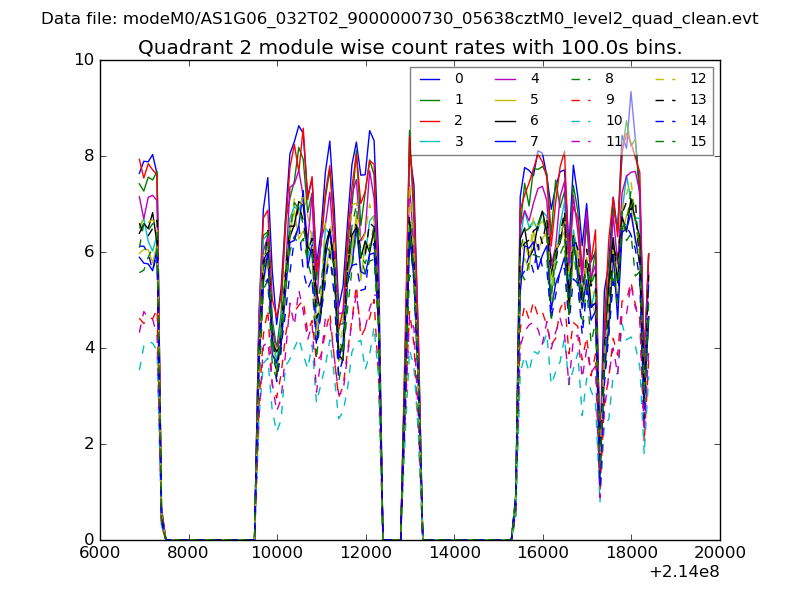
| Module-wise count rates for Quadrant C Data is divided into 100 sec bins |
 |
 |
| Module-wise count rates for Quadrant D Data is divided into 100 sec bins |
 |
 |
| Parameter | Plot |
|---|---|
| CZT HV Monitor | 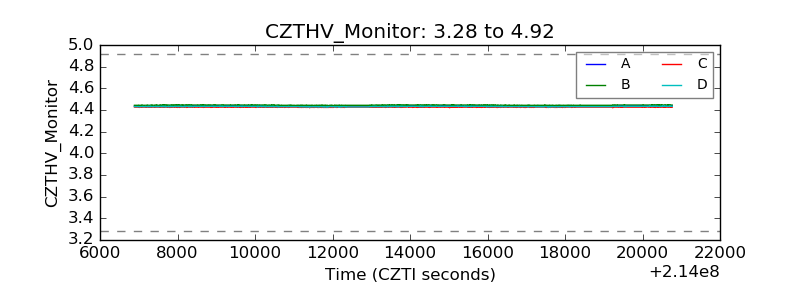 |
| D_VDD | 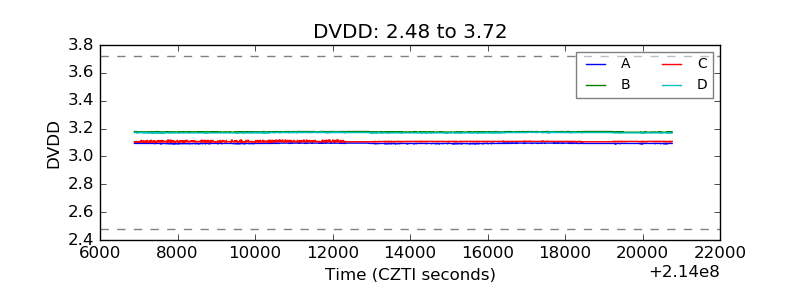 |
| Temperature 1 | 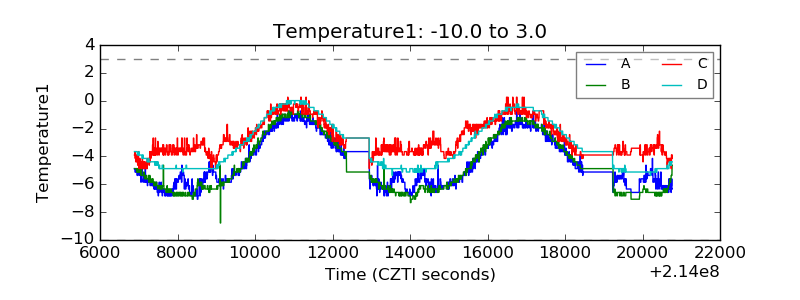 |
| Veto HV Monitor | 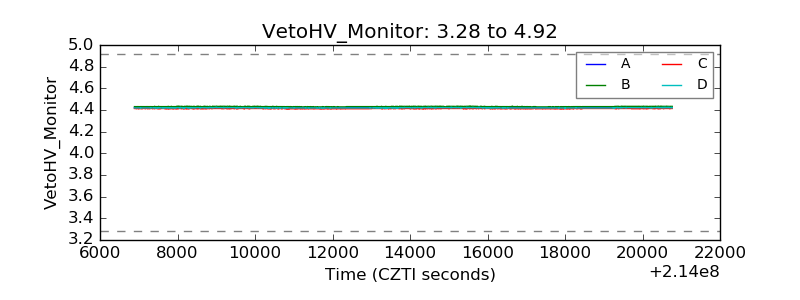 |
| Veto LLD | 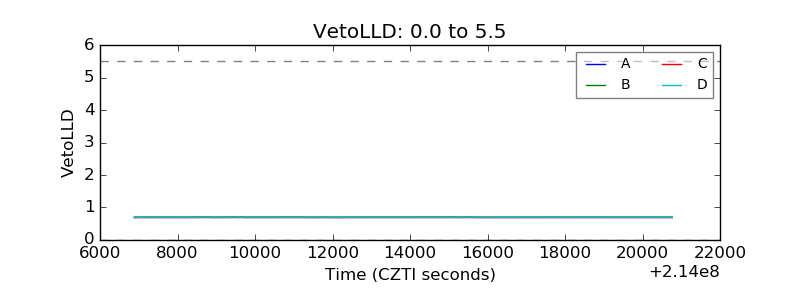 |
| Alpha Counter | 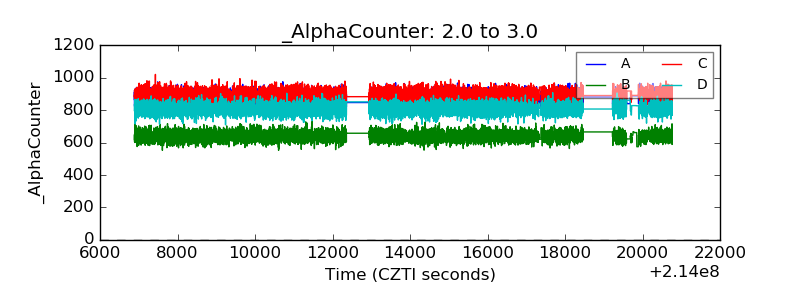 |
| _CPM_Rate | 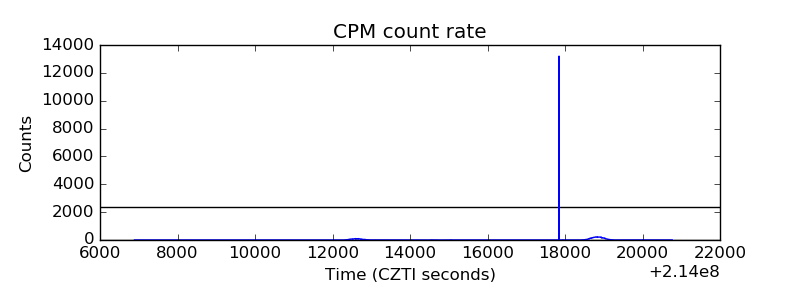 |
| CZT Counter | 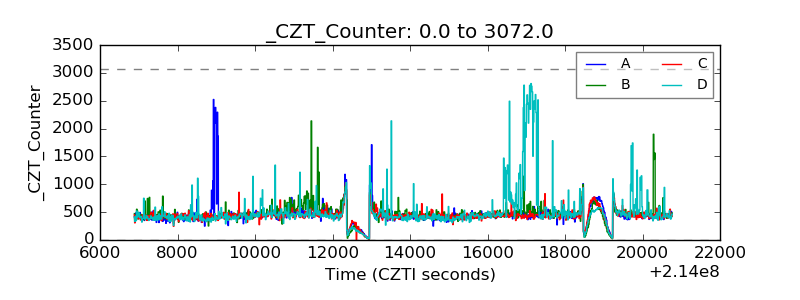 |
| +2.5 Volts monitor |  |
| +5 Volts monitor |  |
| _ROLL_ROT |  |
| _Roll_DEC | 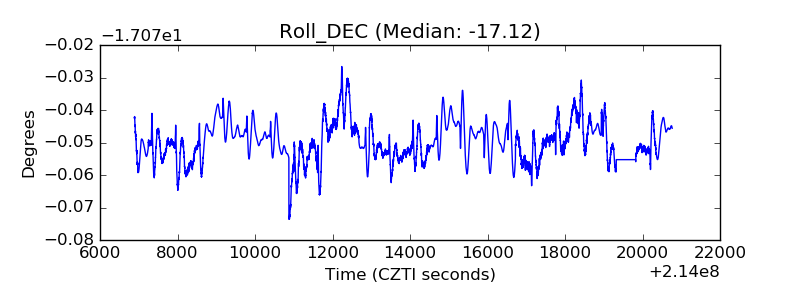 |
| _Roll_RA | 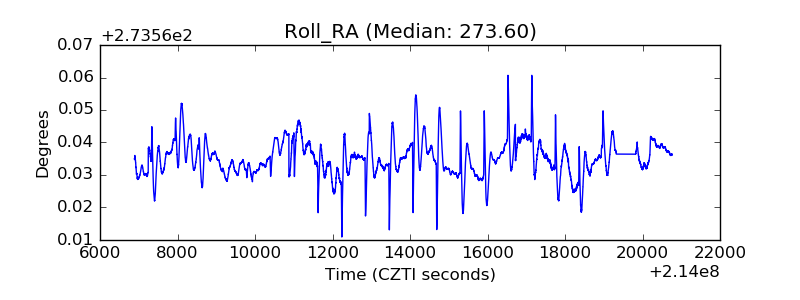 |
| Veto Counter | 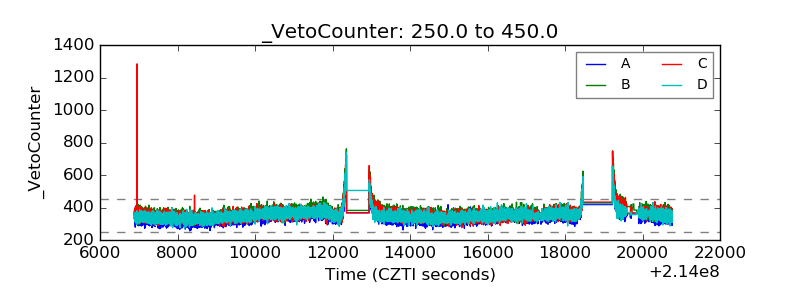 |