| Param | Original file | Final file |
|---|---|---|
| Filename | modeM0/AS1G06_032T02_9000000730_05642cztM0_level2.evt | modeM0/AS1G06_032T02_9000000730_05642cztM0_level2_quad_clean.evt |
| Size (bytes) | 480,314,880 | 79,536,960 |
| Size | 458.1 MB | 75.9 MB |
| Events in quadrant A | 3,492,045 | 488,462 |
| Events in quadrant B | 3,648,386 | 488,398 |
| Events in quadrant C | 3,568,797 | 488,483 |
| Events in quadrant D | 3,374,783 | 469,027 |
| Mode SS | |||
|---|---|---|---|
| Quadrant | BADHDUFLAG | Total packets | Discarded packets |
| A | 0 | 136 | 0 |
| B | 0 | 136 | 0 |
| C | 0 | 136 | 0 |
| D | 0 | 136 | 0 |
| Mode M0 | |||
|---|---|---|---|
| Quadrant | BADHDUFLAG | Total packets | Discarded packets |
| A | 0 | 14759 | 1 |
| B | 0 | 15022 | 0 |
| C | 0 | 14794 | 0 |
| D | 0 | 14613 | 0 |
| Mode M9 | |||
|---|---|---|---|
| Quadrant | BADHDUFLAG | Total packets | Discarded packets |
| A | 0 | 23 | 0 |
| B | 0 | 23 | 0 |
| C | 0 | 23 | 0 |
| D | 0 | 23 | 0 |
| Quadrant | Total seconds | Saturated seconds | Saturation percentage |
|---|---|---|---|
| A | 6816 | 258 | 3.785211% |
| B | 6816 | 163 | 2.391432% |
| C | 6816 | 171 | 2.508803% |
| D | 6816 | 146 | 2.142019% |
Noise dominated data is calculated using 1-second bins in cleaned event files. If a bin has >2000 counts, and if more than 50% of those come from <1% of pixels, then it is considered to be noise-dominated and hence unusable.
| Quadrant | # 1 sec bins | Bins with >0 counts | Bins with >2000 counts | High rate bins dominated by noise | Noise dominated (total time) | Noise dominated (detector-on time) | Marked lightcurve |
|---|---|---|---|---|---|---|---|
| A | 8956 | 6816 | 57 | 57 | 0.64% | 0.84% | 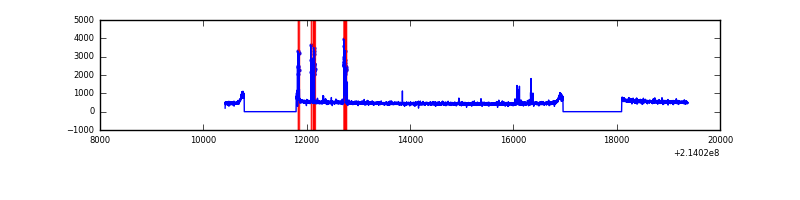 |
| B | 8956 | 6817 | 4 | 4 | 0.04% | 0.06% | 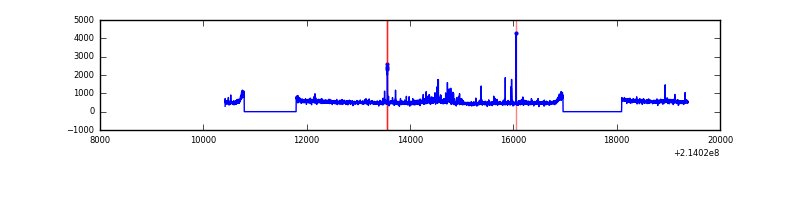 |
| C | 8956 | 6817 | 34 | 34 | 0.38% | 0.50% | 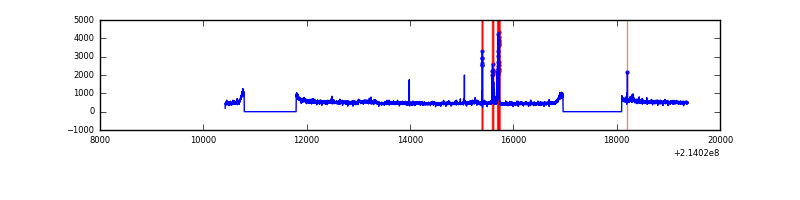 |
| D | 8956 | 6816 | 18 | 18 | 0.20% | 0.26% | 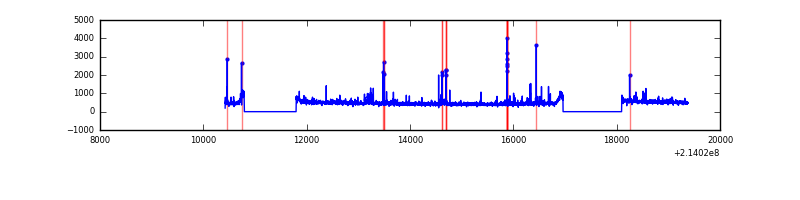 |
Top three noisy pixels from each quadrant. If the there are fewer than three noisy pixels in the level2.evt file, extra rows are filled as -1
| Pixel properties | Quadrant properties | ||||||
|---|---|---|---|---|---|---|---|
| Quadrant | DetID | PixID | Counts | Sigma | Mean | Median | Sigma |
| A | 14 | 111 | 211233 | 1215.65 | 850 | 832 | 173.1 |
| A | 12 | 194 | 8325 | 43.29 | 850 | 832 | 173.1 |
| A | 0 | 226 | 8272 | 42.99 | 850 | 832 | 173.1 |
| B | 15 | 204 | 155352 | 935.71 | 860 | 841 | 165.1 |
| B | 0 | 214 | 48789 | 290.37 | 860 | 841 | 165.1 |
| B | 15 | 54 | 37170 | 220.01 | 860 | 841 | 165.1 |
| C | 1 | 16 | 193105 | 994.86 | 828 | 832 | 193.3 |
| C | 12 | 4 | 134482 | 691.53 | 828 | 832 | 193.3 |
| C | 9 | 16 | 8446 | 39.4 | 828 | 832 | 193.3 |
| D | 2 | 152 | 84293 | 408.12 | 831 | 805 | 204.6 |
| D | 2 | 136 | 76301 | 369.05 | 831 | 805 | 204.6 |
| D | 12 | 233 | 23368 | 110.3 | 831 | 805 | 204.6 |
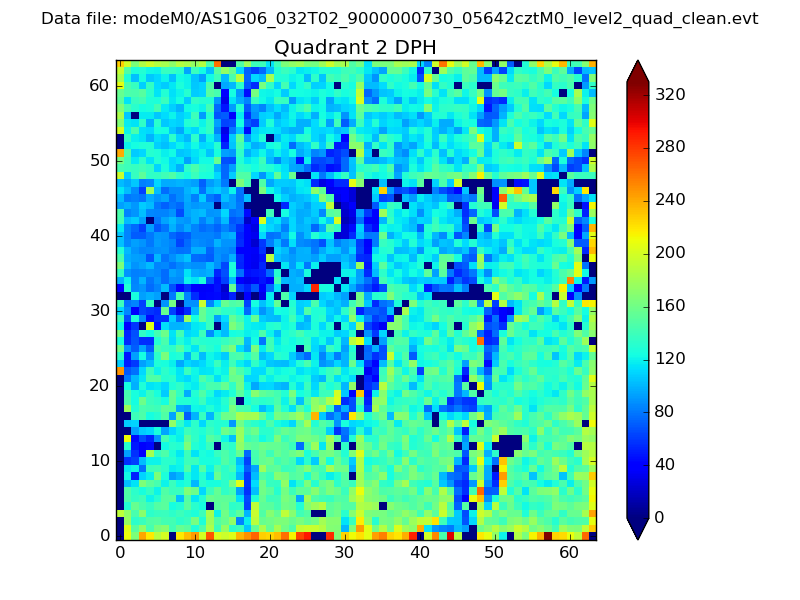
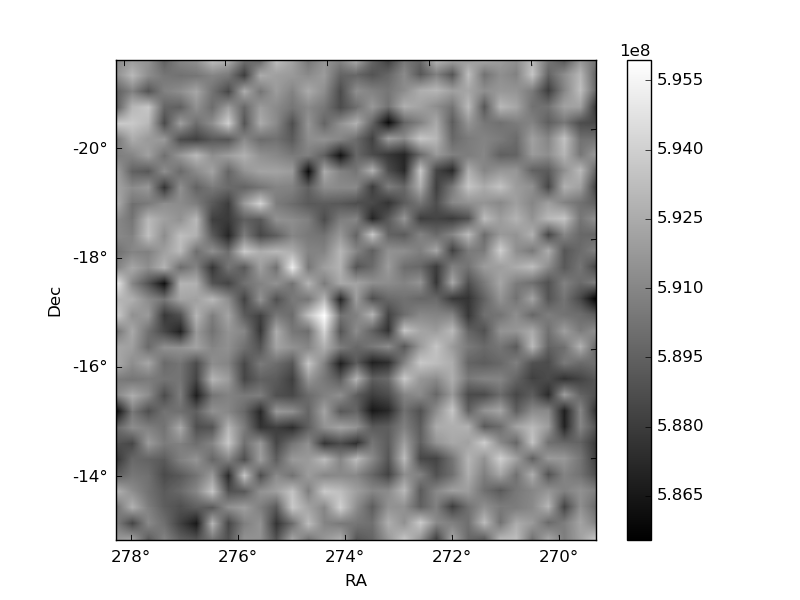
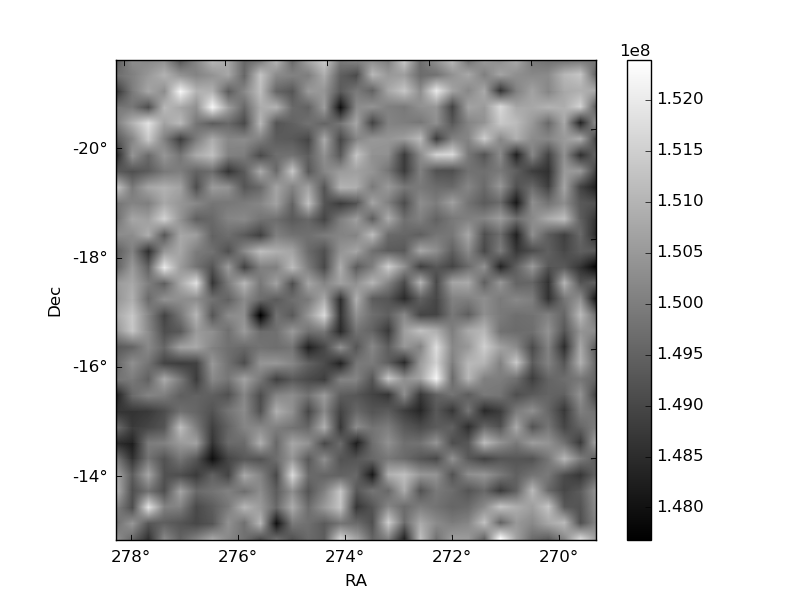
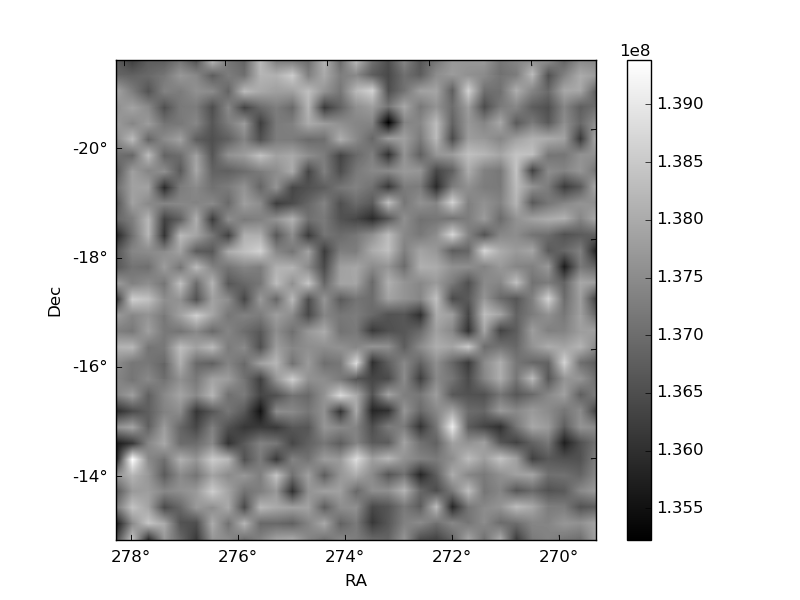
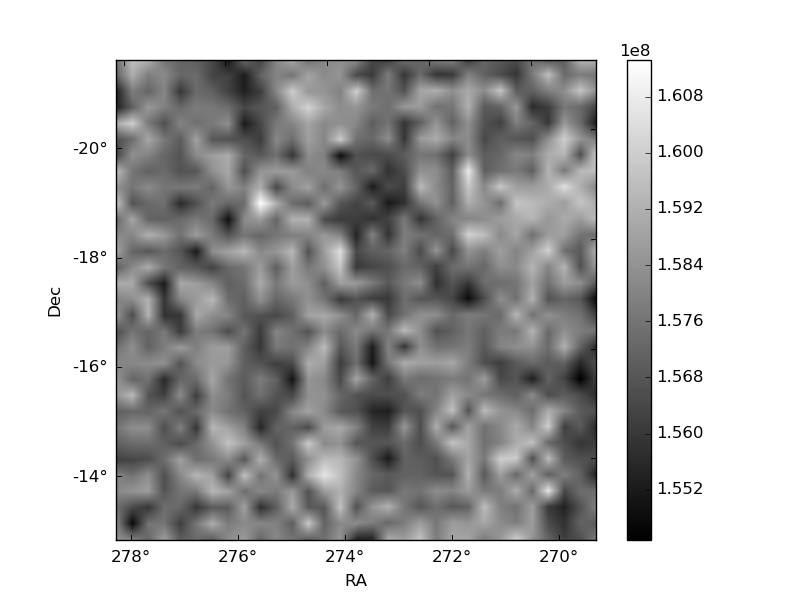
Histogram calculated using DETX and DETY for each event in the final _common_clean file
| Quadrant A | 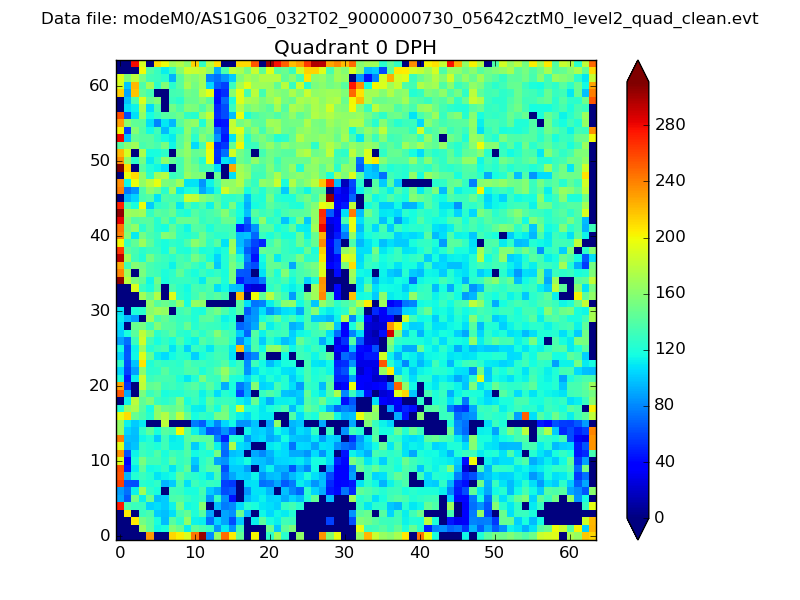 |
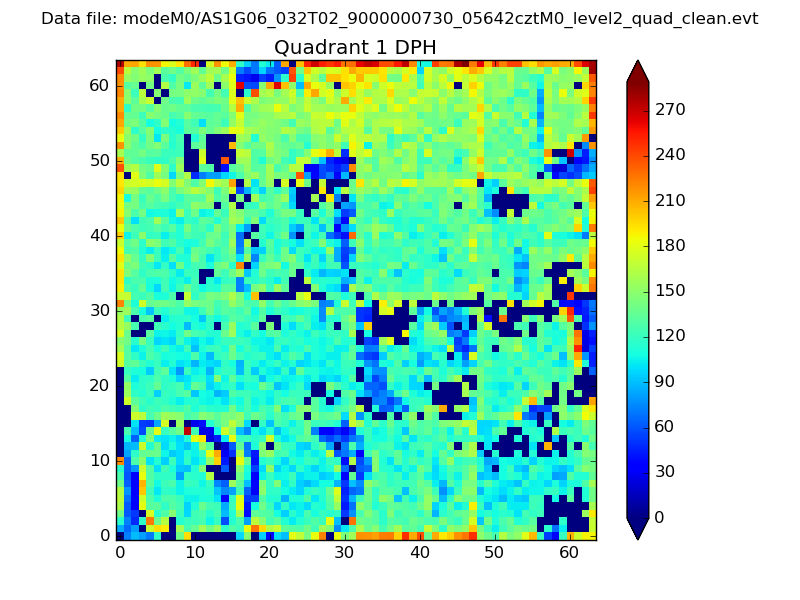 |
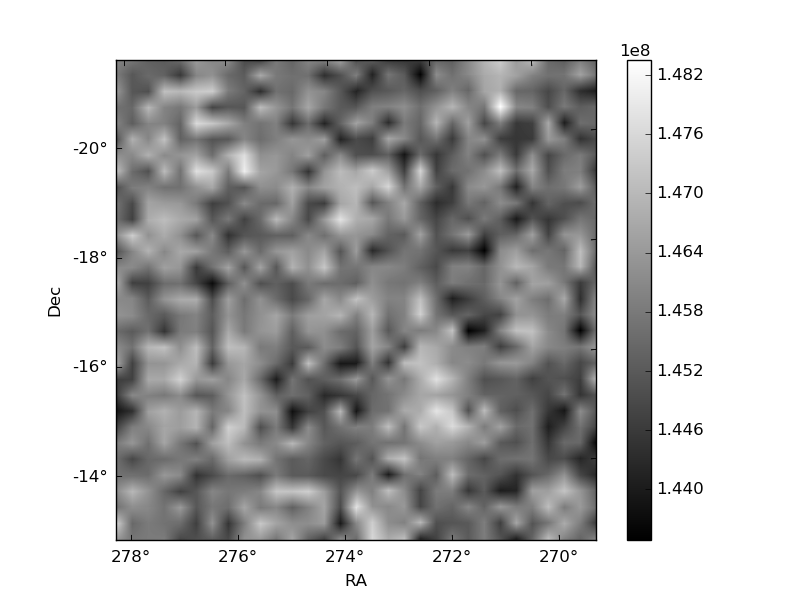
Quadrant B |
|---|---|---|---|
| Quadrant D | 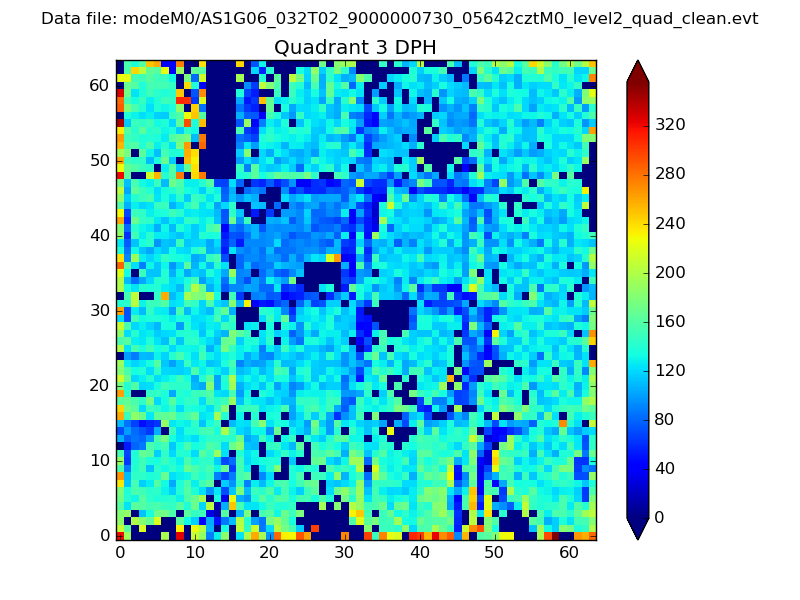 |
 |
Quadrant C |
| Plot type | Count rate plots | Images |
|---|---|---|
| Comparison with Poisson distribution Blue bars denote a histogram of data divided into 1 sec bins. Red curve is a Poisson curve with rate = median count rate of data. |
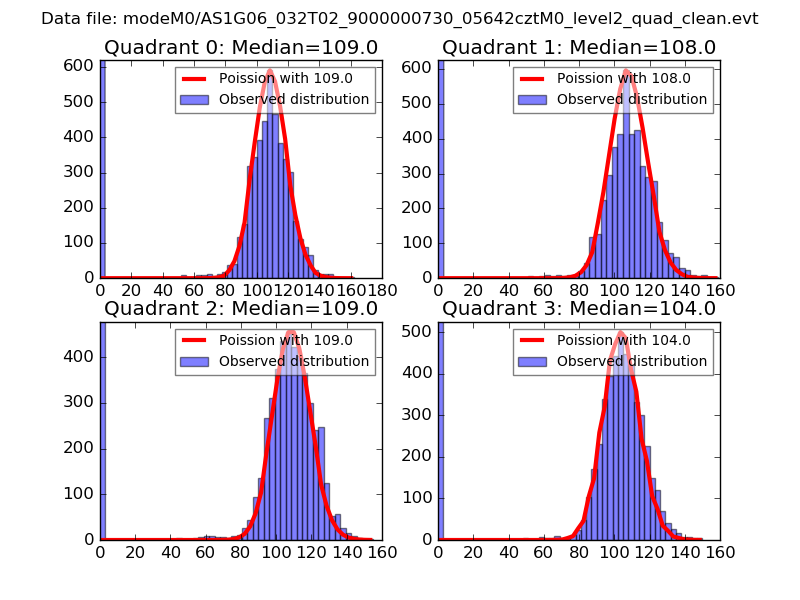 |
 |
| Quadrant-wise count rates Data is divided into 100 sec bins |
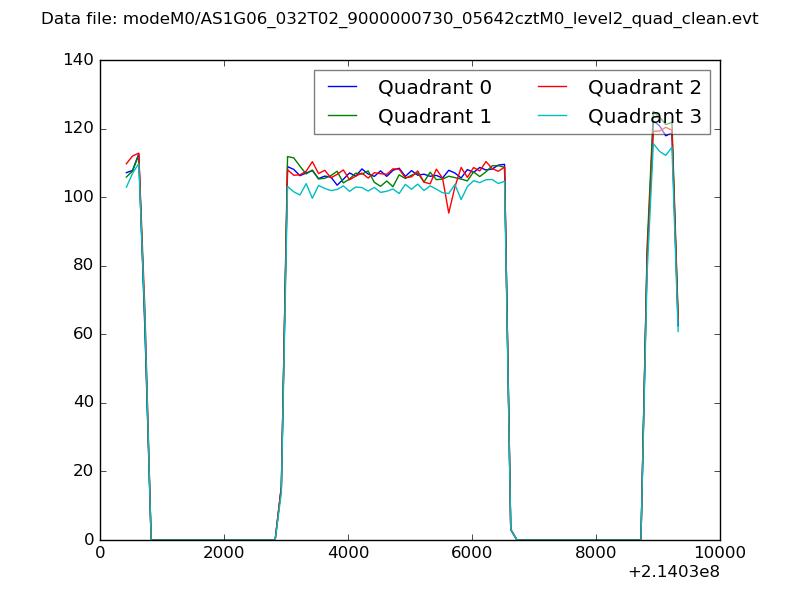 |
|
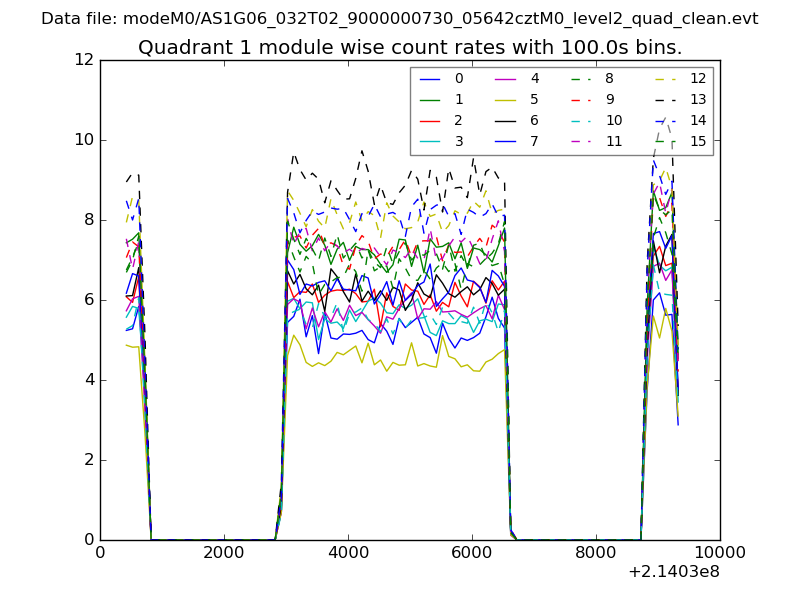
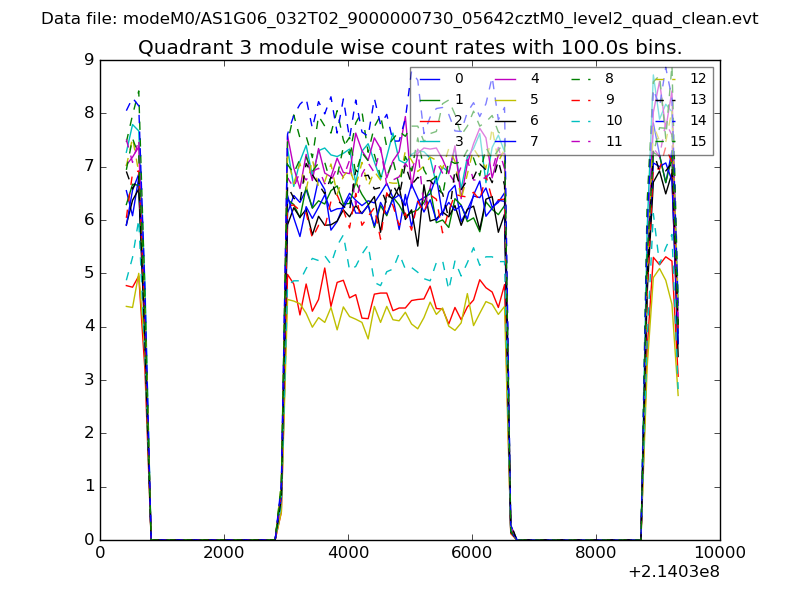
| Module-wise count rates for Quadrant A Data is divided into 100 sec bins |
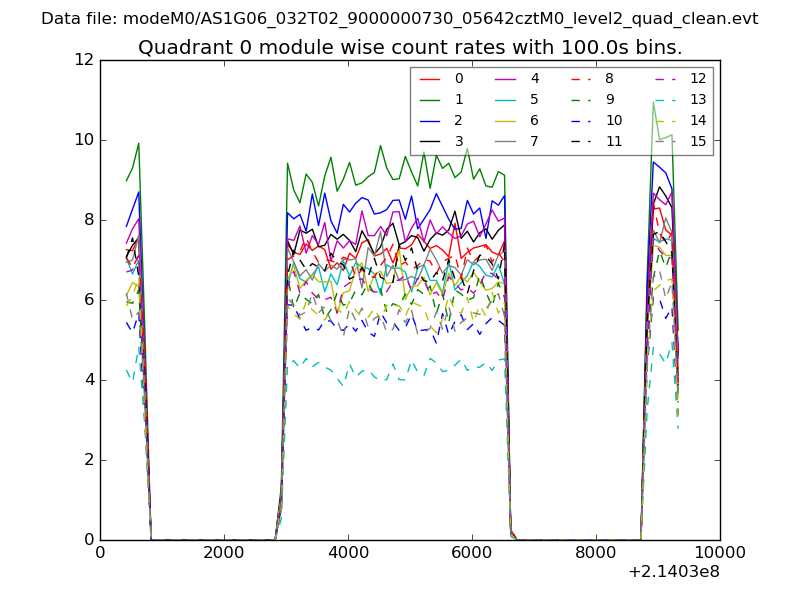 |
 |
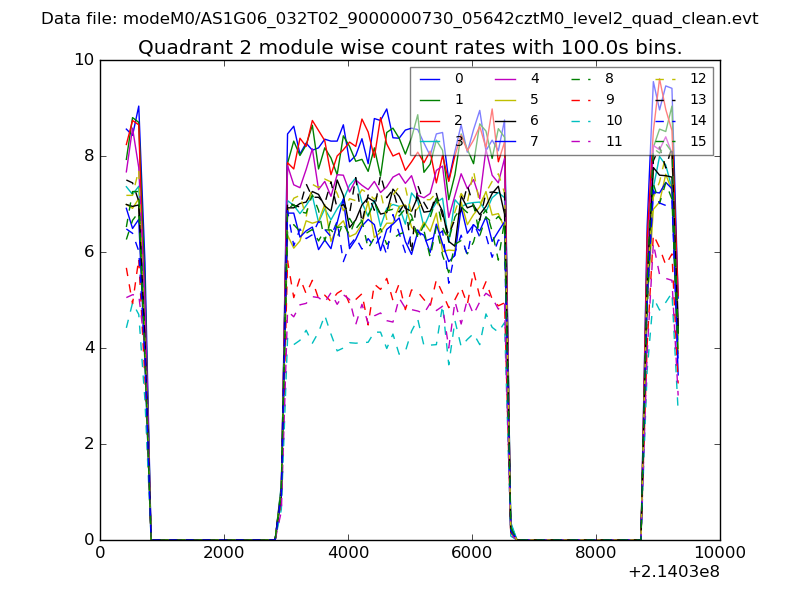
| Module-wise count rates for Quadrant B Data is divided into 100 sec bins |
 |
 |
| Module-wise count rates for Quadrant C Data is divided into 100 sec bins |
 |
 |
| Module-wise count rates for Quadrant D Data is divided into 100 sec bins |
 |
 |
| Parameter | Plot |
|---|---|
| CZT HV Monitor | 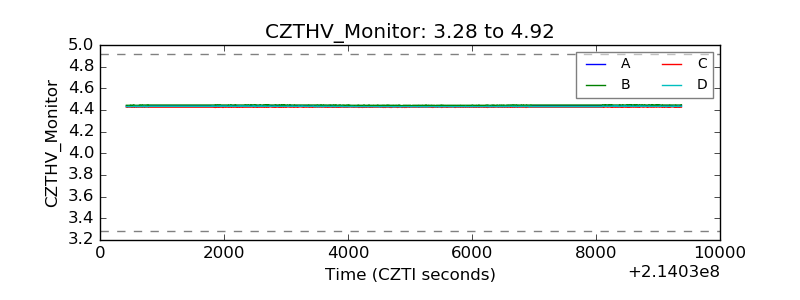 |
| D_VDD | 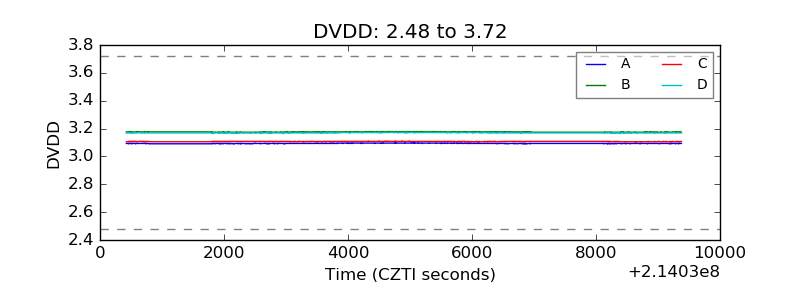 |
| Temperature 1 | 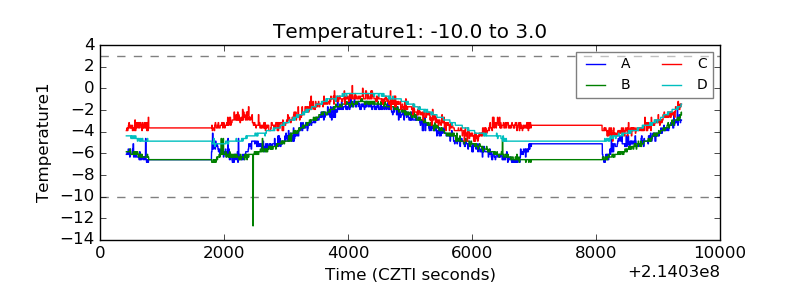 |
| Veto HV Monitor | 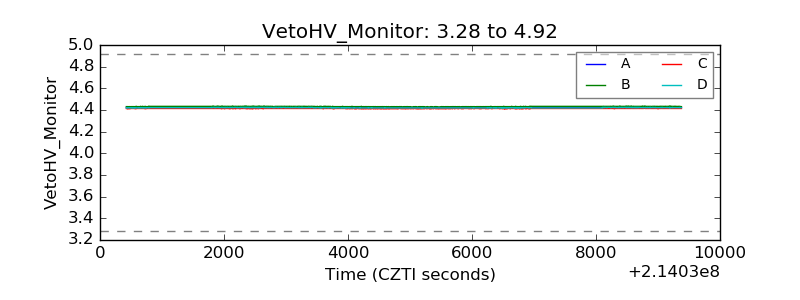 |
| Veto LLD | 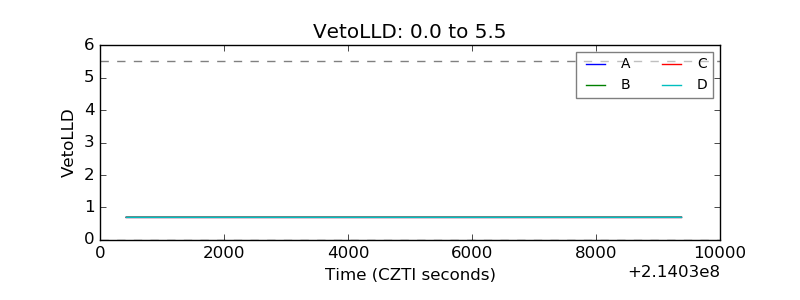 |
| Alpha Counter | 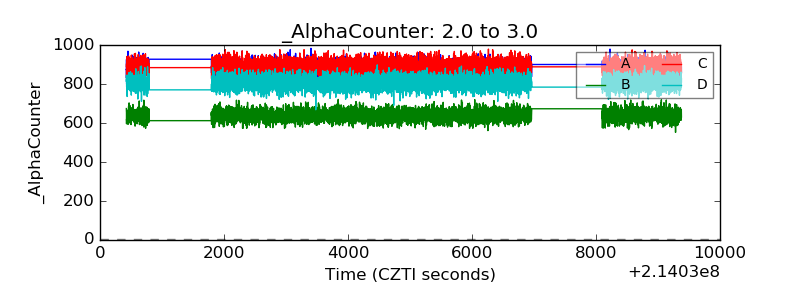 |
| _CPM_Rate | 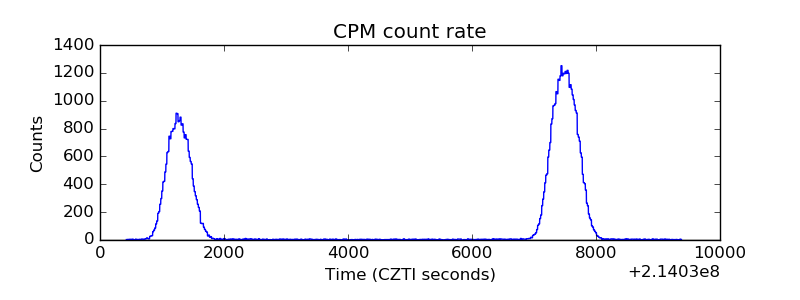 |
| CZT Counter | 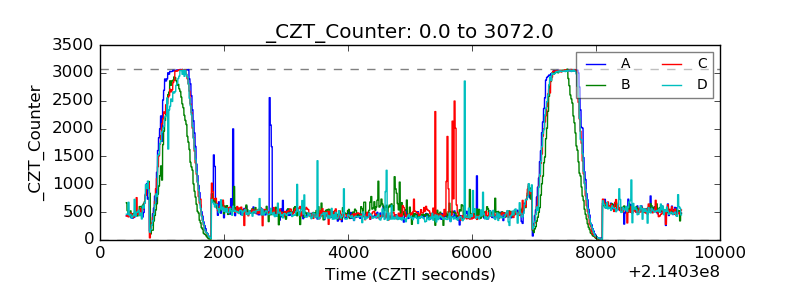 |
| +2.5 Volts monitor | 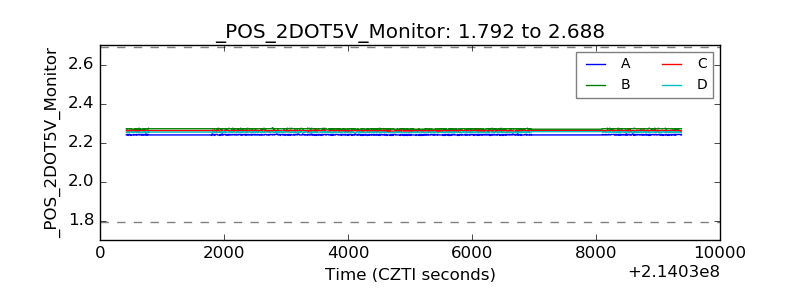 |
| +5 Volts monitor | 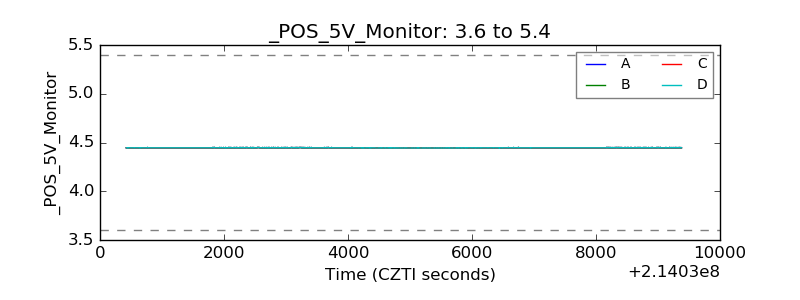 |
| _ROLL_ROT | 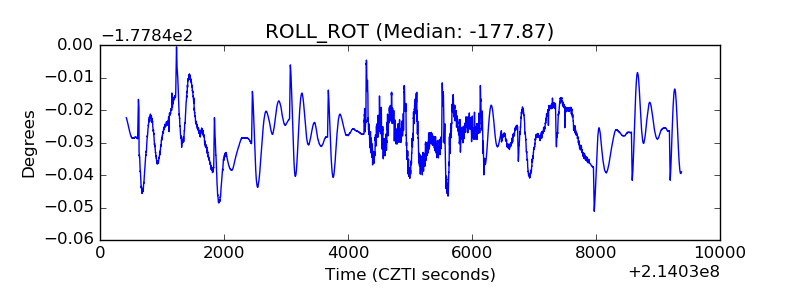 |
| _Roll_DEC | 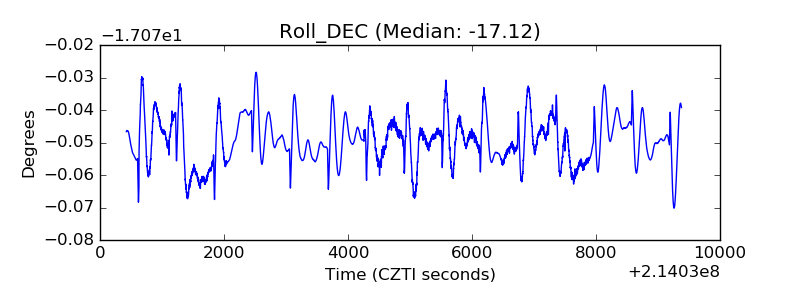 |
| _Roll_RA | 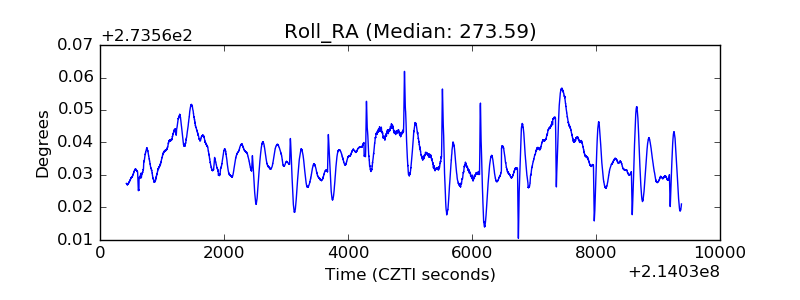 |
| Veto Counter | 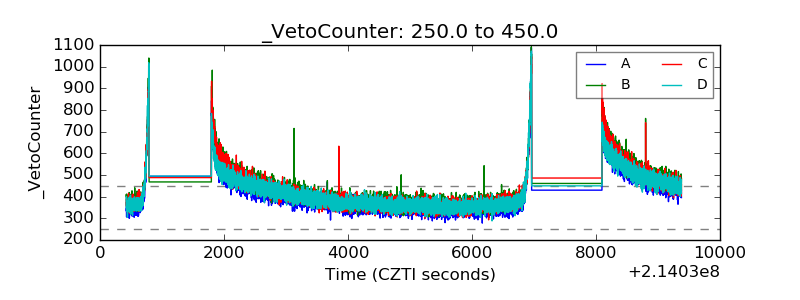 |