| Param | Original file | Final file |
|---|---|---|
| Filename | modeM0/AS1G06_032T02_9000000730_05643cztM0_level2.evt | modeM0/AS1G06_032T02_9000000730_05643cztM0_level2_quad_clean.evt |
| Size (bytes) | 470,736,000 | 83,845,440 |
| Size | 448.9 MB | 80.0 MB |
| Events in quadrant A | 3,305,205 | 528,756 |
| Events in quadrant B | 3,836,006 | 524,211 |
| Events in quadrant C | 3,303,401 | 524,967 |
| Events in quadrant D | 3,364,582 | 502,380 |
| Mode SS | |||
|---|---|---|---|
| Quadrant | BADHDUFLAG | Total packets | Discarded packets |
| A | 0 | 134 | 0 |
| B | 0 | 134 | 0 |
| C | 0 | 134 | 0 |
| D | 0 | 134 | 0 |
| Mode M0 | |||
|---|---|---|---|
| Quadrant | BADHDUFLAG | Total packets | Discarded packets |
| A | 0 | 13983 | 2 |
| B | 0 | 15621 | 1 |
| C | 0 | 14115 | 1 |
| D | 0 | 14291 | 1 |
| Mode M9 | |||
|---|---|---|---|
| Quadrant | BADHDUFLAG | Total packets | Discarded packets |
| A | 0 | 24 | 0 |
| B | 0 | 24 | 0 |
| C | 0 | 24 | 0 |
| D | 0 | 24 | 0 |
| Quadrant | Total seconds | Saturated seconds | Saturation percentage |
|---|---|---|---|
| A | 6583 | 135 | 2.050737% |
| B | 6583 | 143 | 2.172262% |
| C | 6583 | 118 | 1.792496% |
| D | 6583 | 132 | 2.005165% |
Noise dominated data is calculated using 1-second bins in cleaned event files. If a bin has >2000 counts, and if more than 50% of those come from <1% of pixels, then it is considered to be noise-dominated and hence unusable.
| Quadrant | # 1 sec bins | Bins with >0 counts | Bins with >2000 counts | High rate bins dominated by noise | Noise dominated (total time) | Noise dominated (detector-on time) | Marked lightcurve |
|---|---|---|---|---|---|---|---|
| A | 8933 | 6584 | 0 | 0 | 0.00% | 0.00% | 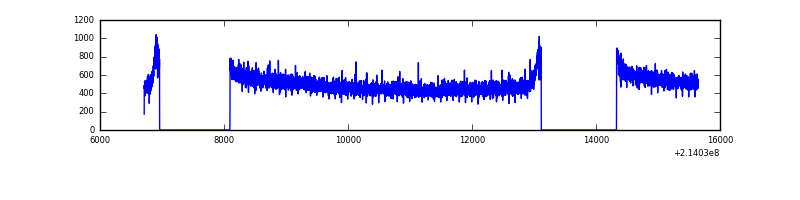 |
| B | 8933 | 6584 | 7 | 7 | 0.08% | 0.11% | 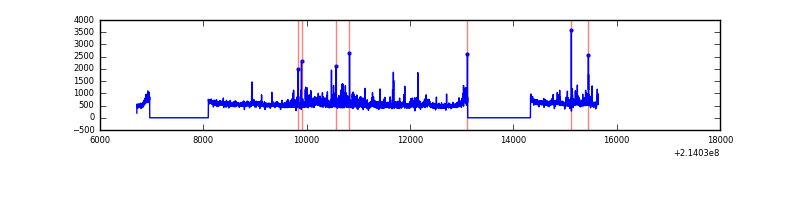 |
| C | 8933 | 6584 | 5 | 5 | 0.06% | 0.08% | 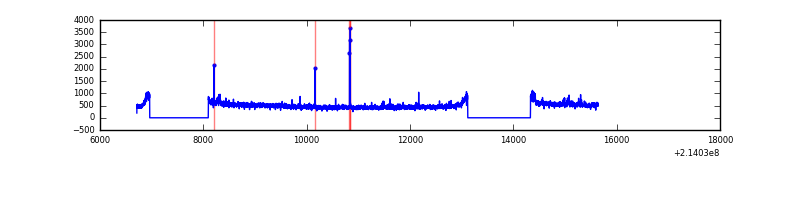 |
| D | 8933 | 6584 | 20 | 20 | 0.22% | 0.30% | 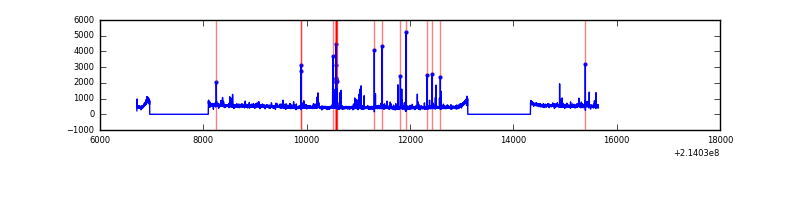 |
Top three noisy pixels from each quadrant. If the there are fewer than three noisy pixels in the level2.evt file, extra rows are filled as -1
| Pixel properties | Quadrant properties | ||||||
|---|---|---|---|---|---|---|---|
| Quadrant | DetID | PixID | Counts | Sigma | Mean | Median | Sigma |
| A | 13 | 6 | 17403 | 94.85 | 854 | 837 | 174.7 |
| A | 12 | 194 | 8455 | 43.62 | 854 | 837 | 174.7 |
| A | 0 | 226 | 8454 | 43.61 | 854 | 837 | 174.7 |
| B | 15 | 204 | 288842 | 1778.02 | 850 | 831 | 162.0 |
| B | 0 | 214 | 58800 | 357.87 | 850 | 831 | 162.0 |
| B | 11 | 51 | 52558 | 319.33 | 850 | 831 | 162.0 |
| C | 1 | 16 | 98309 | 514.34 | 818 | 825 | 189.5 |
| C | 12 | 4 | 11122 | 54.33 | 818 | 825 | 189.5 |
| C | 13 | 61 | 6614 | 30.54 | 818 | 825 | 189.5 |
| D | 2 | 152 | 56497 | 273.89 | 828 | 804 | 203.3 |
| D | 9 | 85 | 48222 | 233.19 | 828 | 804 | 203.3 |
| D | 2 | 136 | 30321 | 145.16 | 828 | 804 | 203.3 |
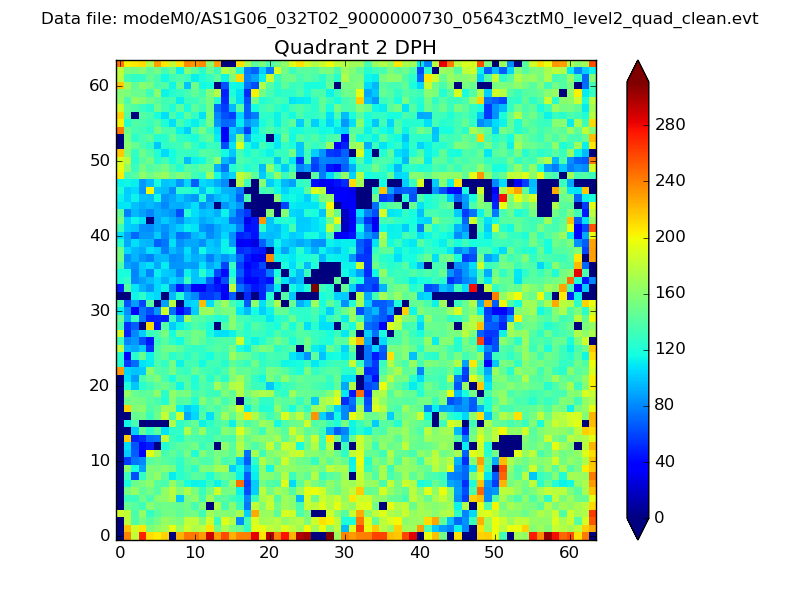
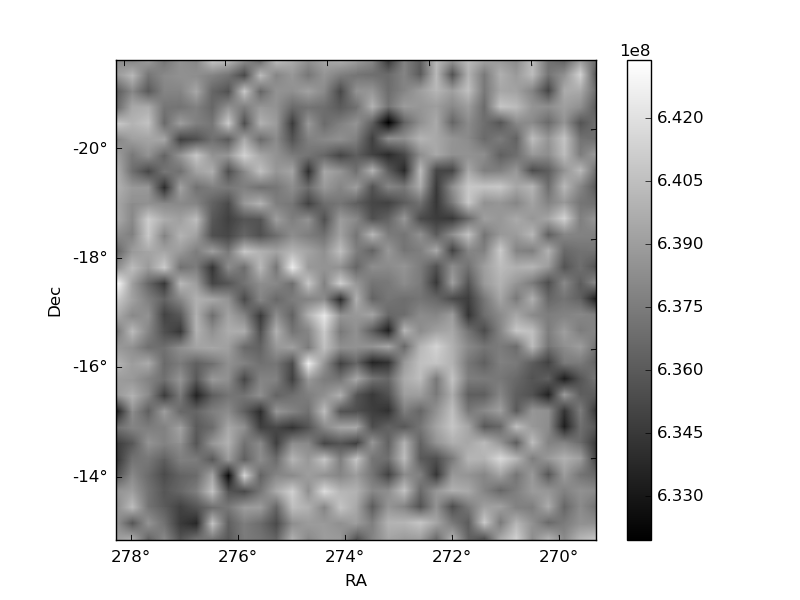
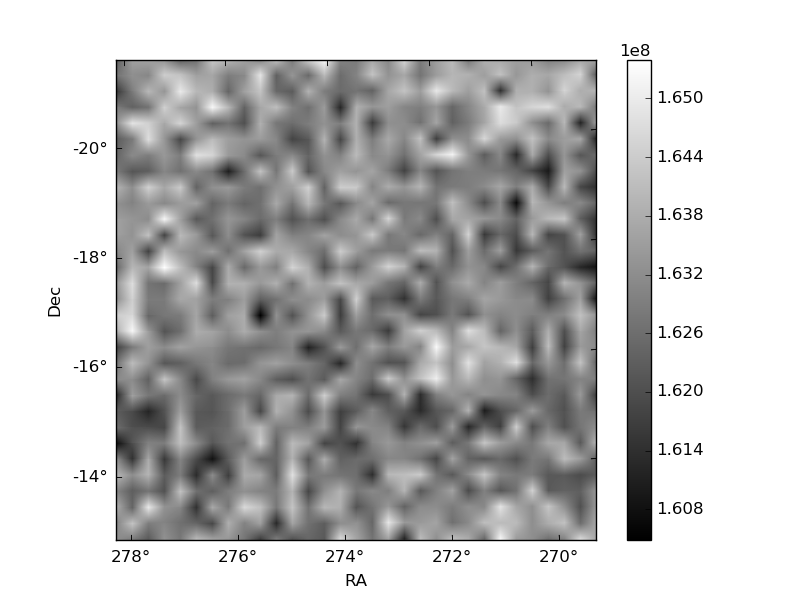
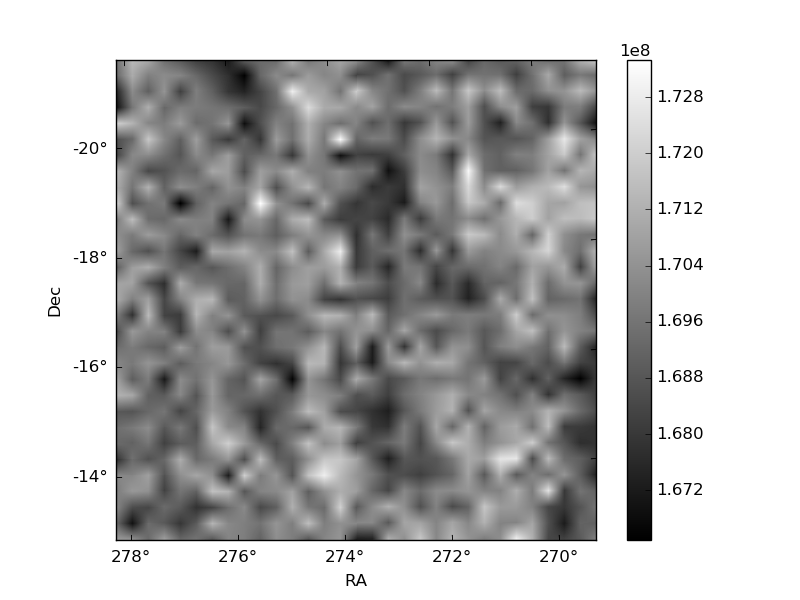
Histogram calculated using DETX and DETY for each event in the final _common_clean file
| Quadrant A | 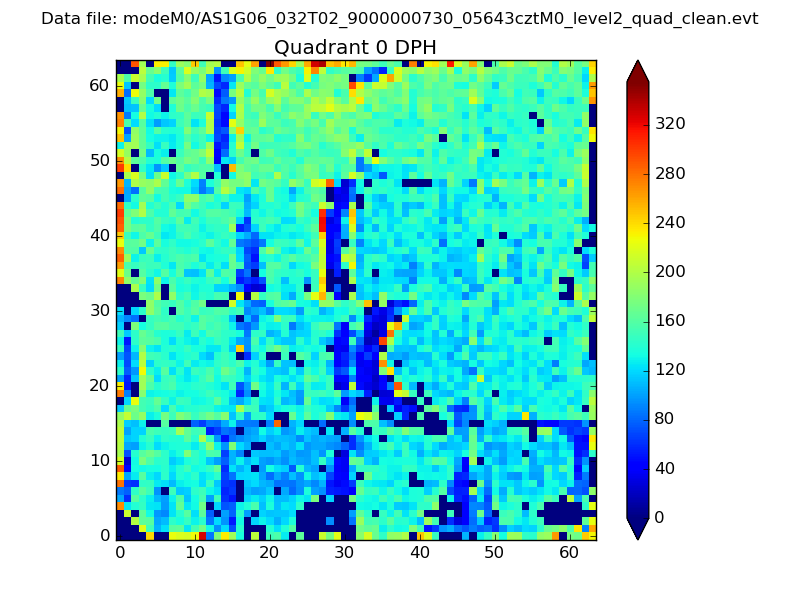 |
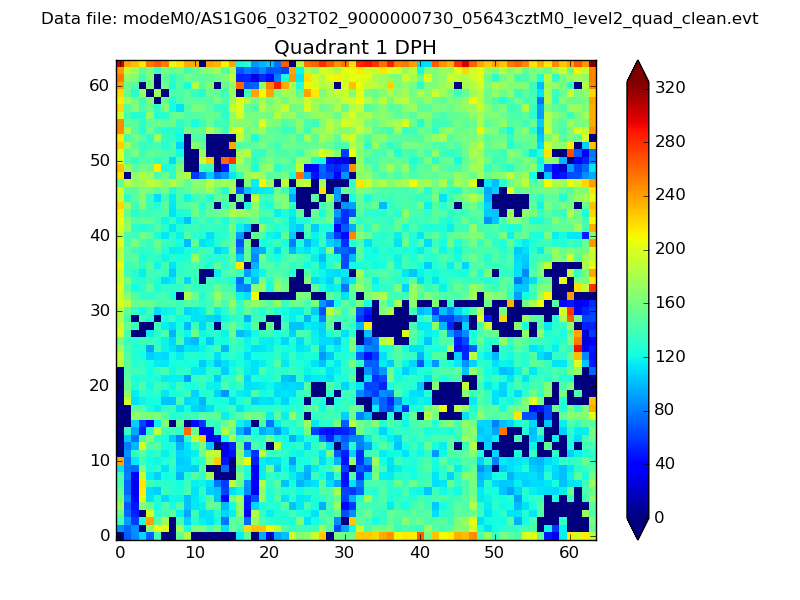 |
Quadrant B |
|---|---|---|---|
| Quadrant D | 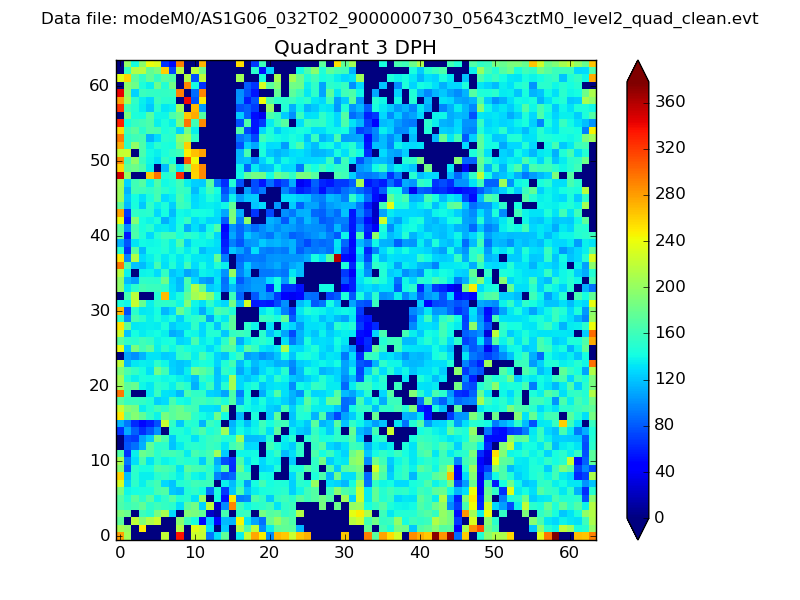 |
 |
Quadrant C |
| Plot type | Count rate plots | Images |
|---|---|---|
| Comparison with Poisson distribution Blue bars denote a histogram of data divided into 1 sec bins. Red curve is a Poisson curve with rate = median count rate of data. |
 |
 |
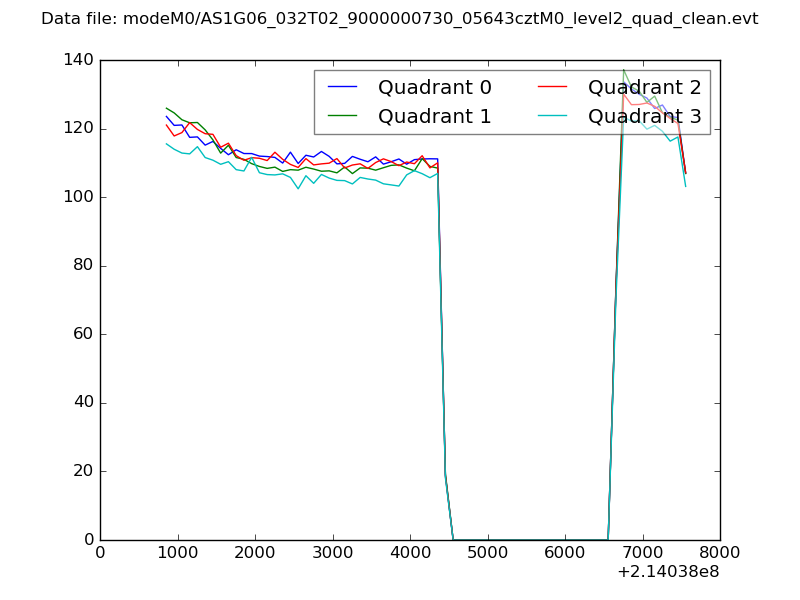
| Quadrant-wise count rates Data is divided into 100 sec bins |
 |
|
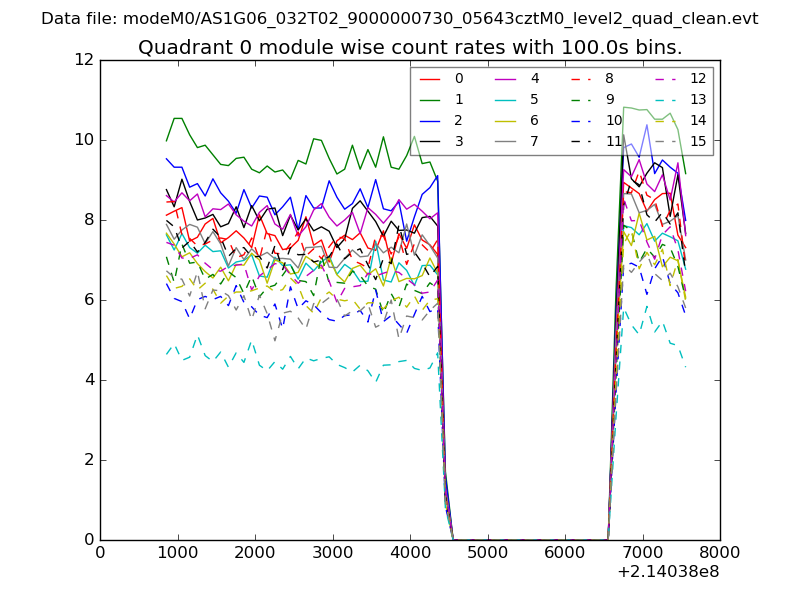
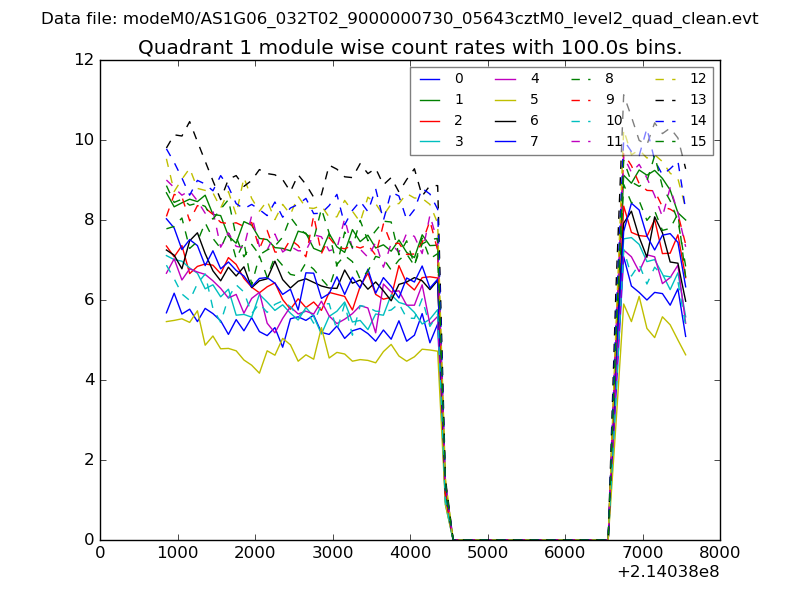
| Module-wise count rates for Quadrant A Data is divided into 100 sec bins |
 |
 |
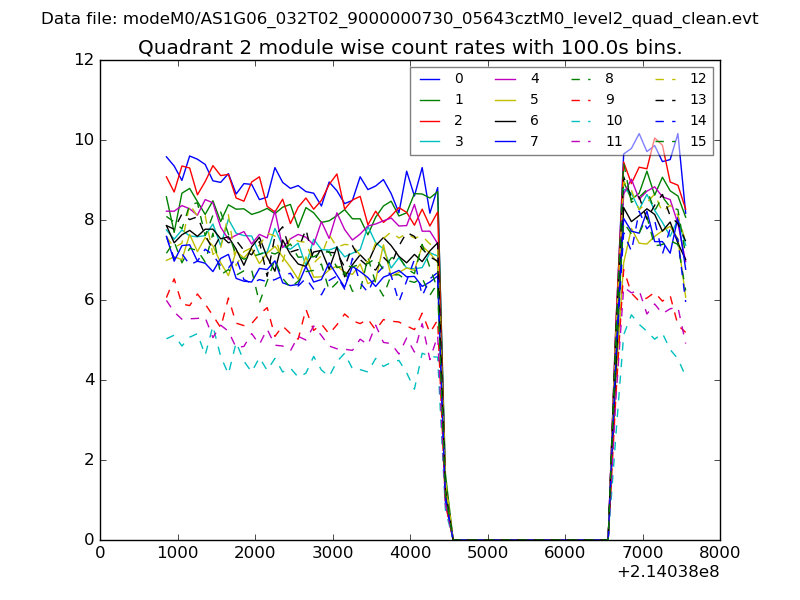
| Module-wise count rates for Quadrant B Data is divided into 100 sec bins |
 |
 |
| Module-wise count rates for Quadrant C Data is divided into 100 sec bins |
 |
 |
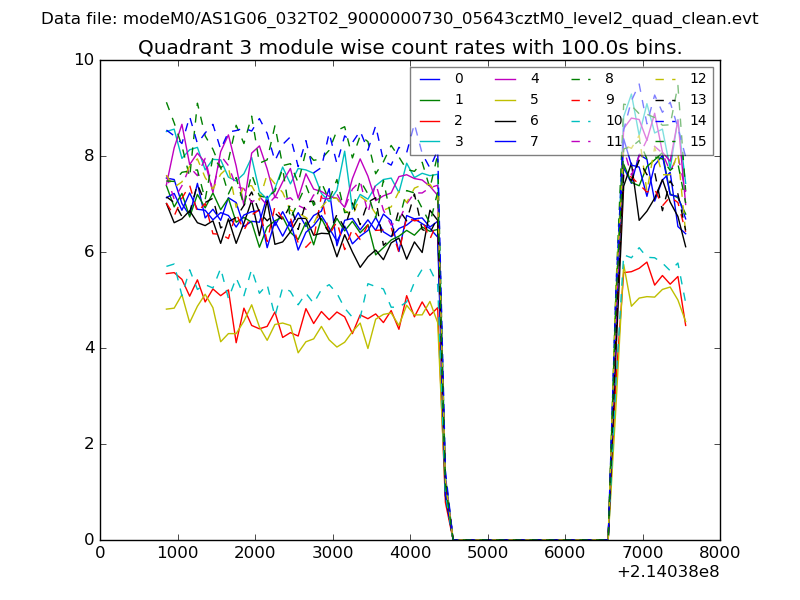
| Module-wise count rates for Quadrant D Data is divided into 100 sec bins |
 |
 |
| Parameter | Plot |
|---|---|
| CZT HV Monitor | 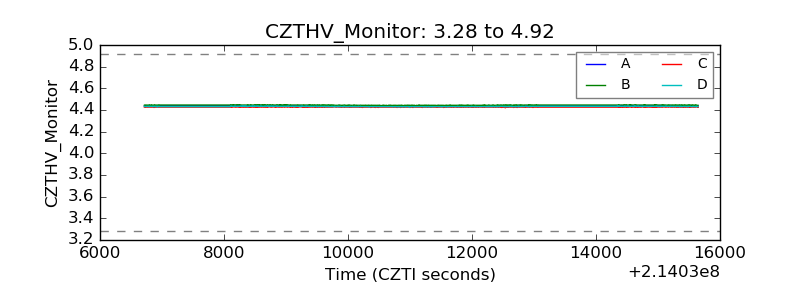 |
| D_VDD | 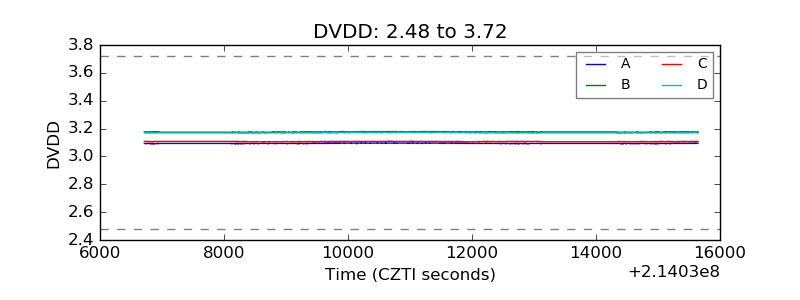 |
| Temperature 1 | 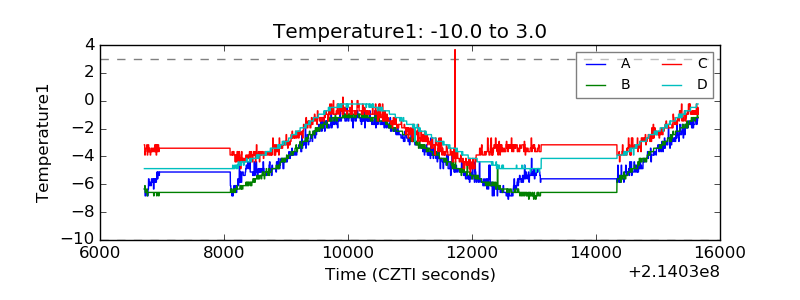 |
| Veto HV Monitor | 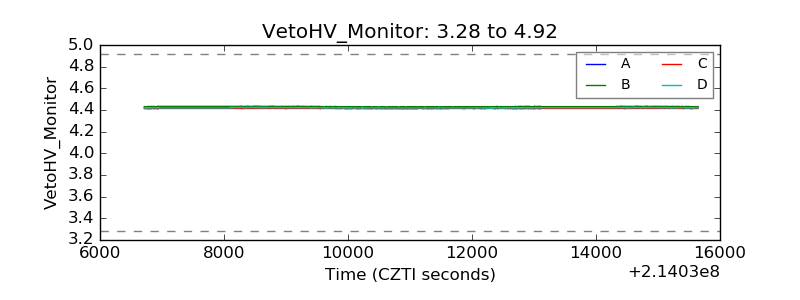 |
| Veto LLD | 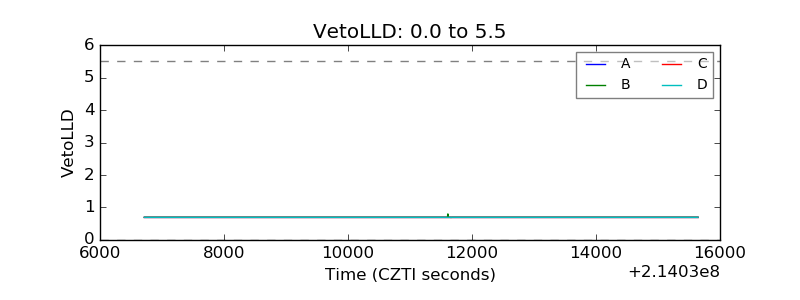 |
| Alpha Counter | 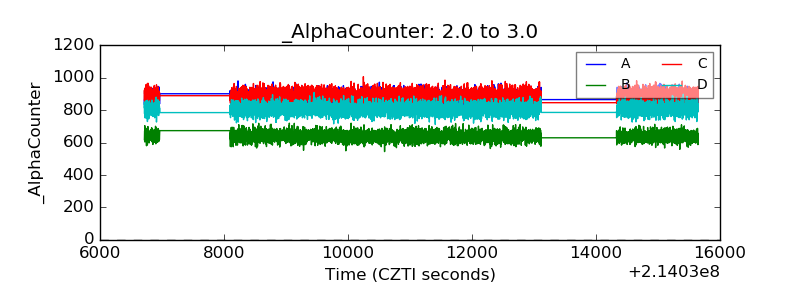 |
| _CPM_Rate | 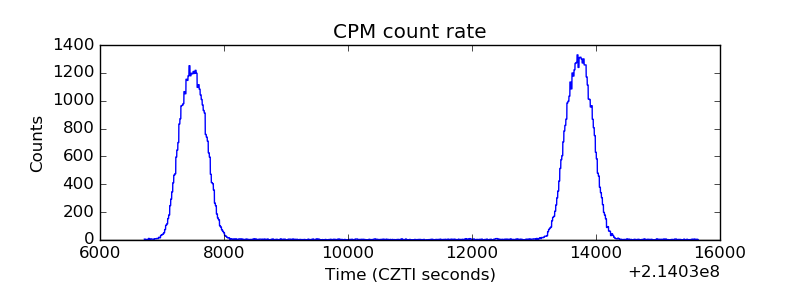 |
| CZT Counter | 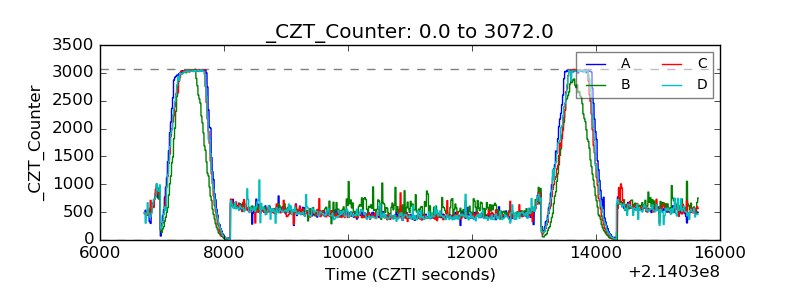 |
| +2.5 Volts monitor |  |
| +5 Volts monitor |  |
| _ROLL_ROT | 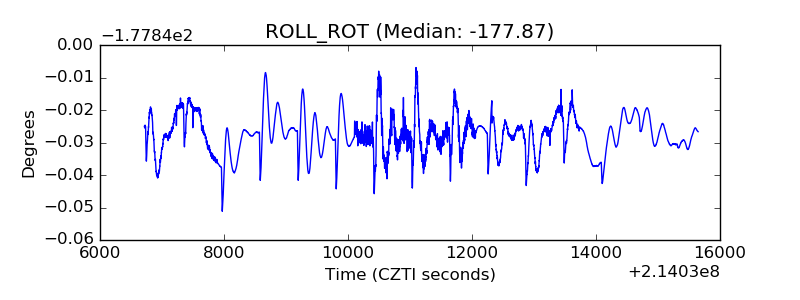 |
| _Roll_DEC | 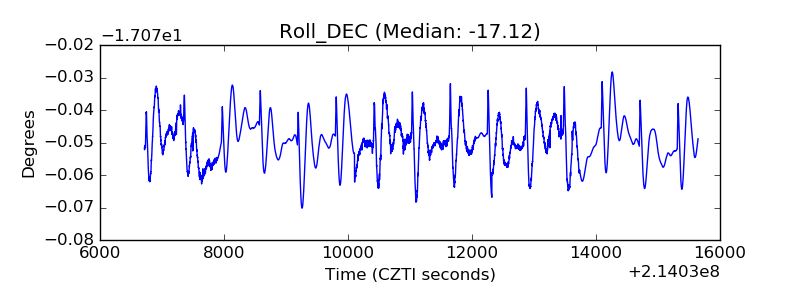 |
| _Roll_RA | 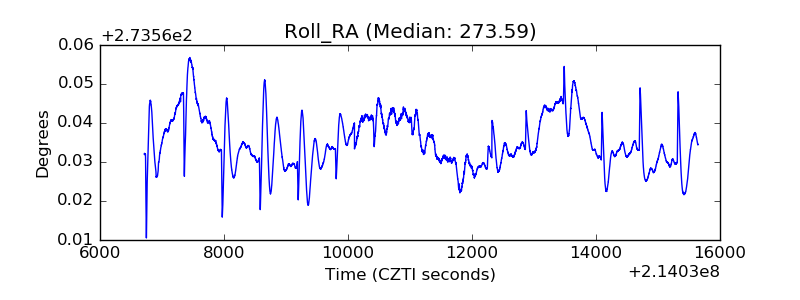 |
| Veto Counter | 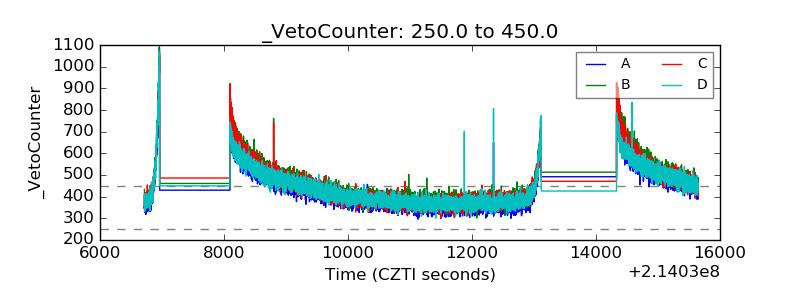 |