| Param | Original file | Final file |
|---|---|---|
| Filename | modeM0/AS1G06_032T02_9000000730_05644cztM0_level2.evt | modeM0/AS1G06_032T02_9000000730_05644cztM0_level2_quad_clean.evt |
| Size (bytes) | 499,345,920 | 91,699,200 |
| Size | 476.2 MB | 87.5 MB |
| Events in quadrant A | 3,379,007 | 596,773 |
| Events in quadrant B | 3,877,095 | 590,665 |
| Events in quadrant C | 3,402,934 | 585,236 |
| Events in quadrant D | 4,025,293 | 553,776 |
| Mode SS | |||
|---|---|---|---|
| Quadrant | BADHDUFLAG | Total packets | Discarded packets |
| A | 0 | 134 | 0 |
| B | 0 | 134 | 0 |
| C | 0 | 134 | 0 |
| D | 0 | 134 | 0 |
| Mode M0 | |||
|---|---|---|---|
| Quadrant | BADHDUFLAG | Total packets | Discarded packets |
| A | 0 | 14130 | 3 |
| B | 0 | 15908 | 2 |
| C | 0 | 14235 | 2 |
| D | 0 | 16116 | 2 |
| Mode M9 | |||
|---|---|---|---|
| Quadrant | BADHDUFLAG | Total packets | Discarded packets |
| A | 0 | 24 | 0 |
| B | 0 | 24 | 0 |
| C | 0 | 24 | 0 |
| D | 0 | 24 | 0 |
| Quadrant | Total seconds | Saturated seconds | Saturation percentage |
|---|---|---|---|
| A | 6454 | 159 | 2.463588% |
| B | 6454 | 158 | 2.448094% |
| C | 6454 | 120 | 1.859312% |
| D | 6454 | 335 | 5.190579% |
Noise dominated data is calculated using 1-second bins in cleaned event files. If a bin has >2000 counts, and if more than 50% of those come from <1% of pixels, then it is considered to be noise-dominated and hence unusable.
| Quadrant | # 1 sec bins | Bins with >0 counts | Bins with >2000 counts | High rate bins dominated by noise | Noise dominated (total time) | Noise dominated (detector-on time) | Marked lightcurve |
|---|---|---|---|---|---|---|---|
| A | 8879 | 6456 | 1 | 1 | 0.01% | 0.02% | 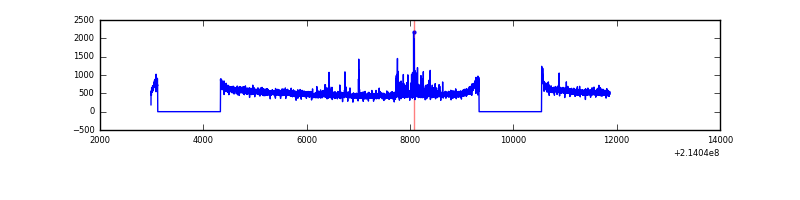 |
| B | 8879 | 6456 | 9 | 9 | 0.10% | 0.14% | 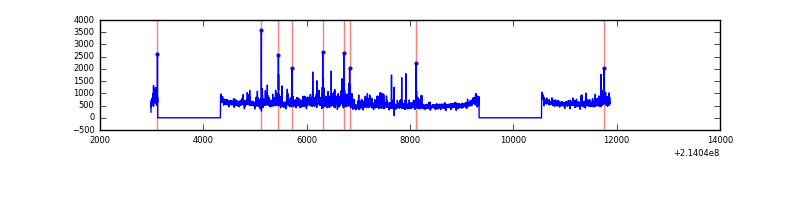 |
| C | 8879 | 6456 | 0 | 0 | 0.00% | 0.00% | 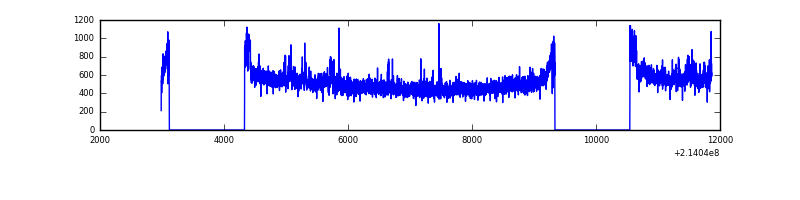 |
| D | 8879 | 6456 | 204 | 204 | 2.30% | 3.16% | 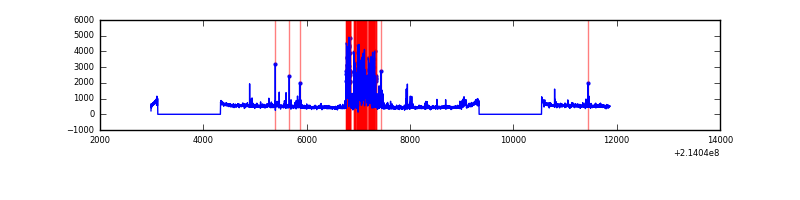 |
Top three noisy pixels from each quadrant. If the there are fewer than three noisy pixels in the level2.evt file, extra rows are filled as -1
| Pixel properties | Quadrant properties | ||||||
|---|---|---|---|---|---|---|---|
| Quadrant | DetID | PixID | Counts | Sigma | Mean | Median | Sigma |
| A | 4 | 2 | 87147 | 501.66 | 846 | 828 | 172.1 |
| A | 13 | 6 | 19877 | 110.71 | 846 | 828 | 172.1 |
| A | 0 | 50 | 10600 | 56.79 | 846 | 828 | 172.1 |
| B | 15 | 204 | 344932 | 2146.35 | 839 | 824 | 160.3 |
| B | 0 | 214 | 125072 | 774.99 | 839 | 824 | 160.3 |
| B | 10 | 245 | 50330 | 308.79 | 839 | 824 | 160.3 |
| C | 1 | 16 | 251293 | 1361.3 | 803 | 807 | 184.0 |
| C | 8 | 128 | 6906 | 33.15 | 803 | 807 | 184.0 |
| C | 13 | 61 | 6529 | 31.1 | 803 | 807 | 184.0 |
| D | 12 | 233 | 807638 | 4055.5 | 809 | 785 | 199.0 |
| D | 2 | 152 | 41706 | 205.68 | 809 | 785 | 199.0 |
| D | 8 | 195 | 33393 | 163.9 | 809 | 785 | 199.0 |
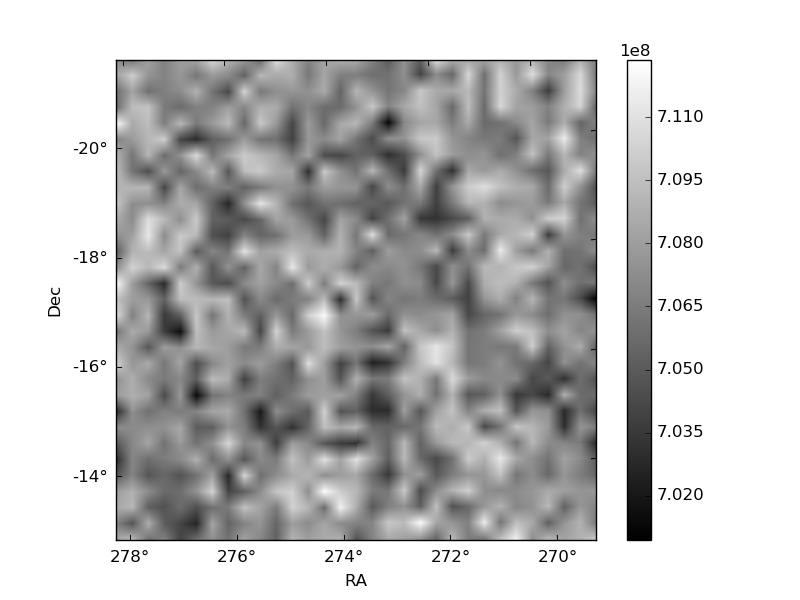
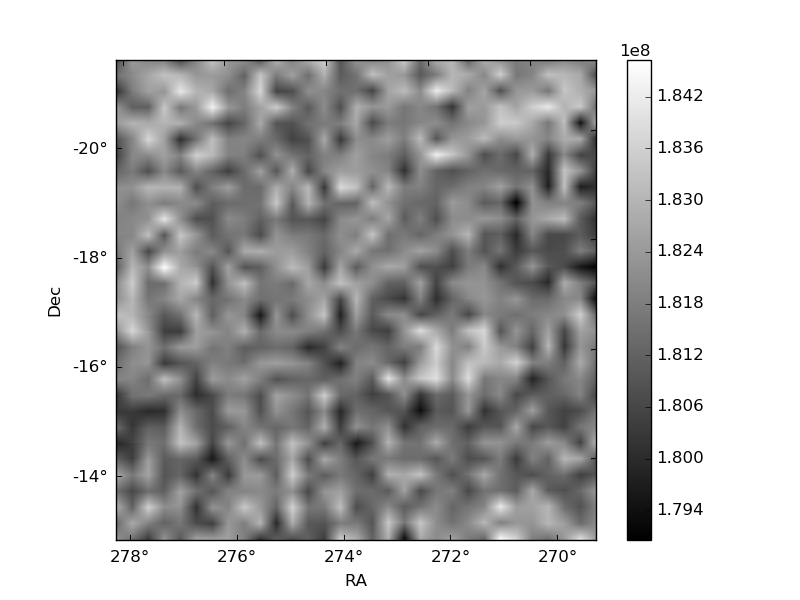
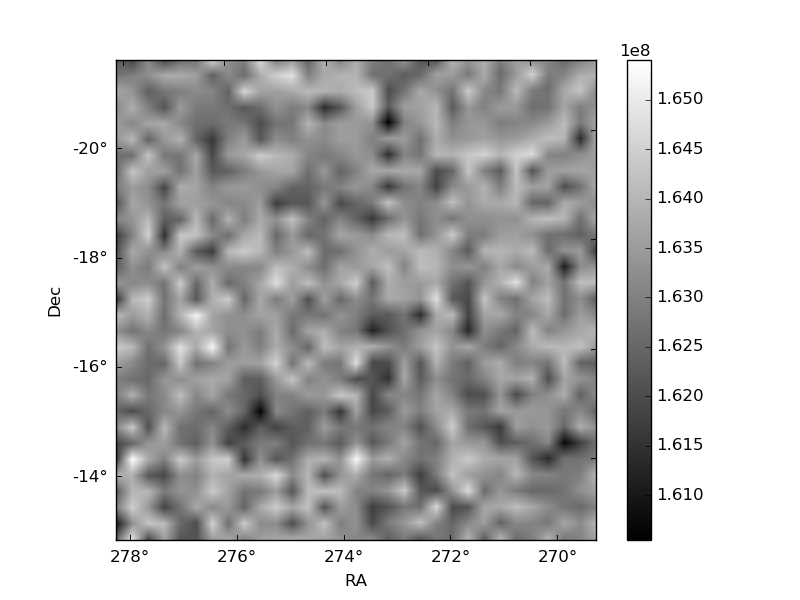
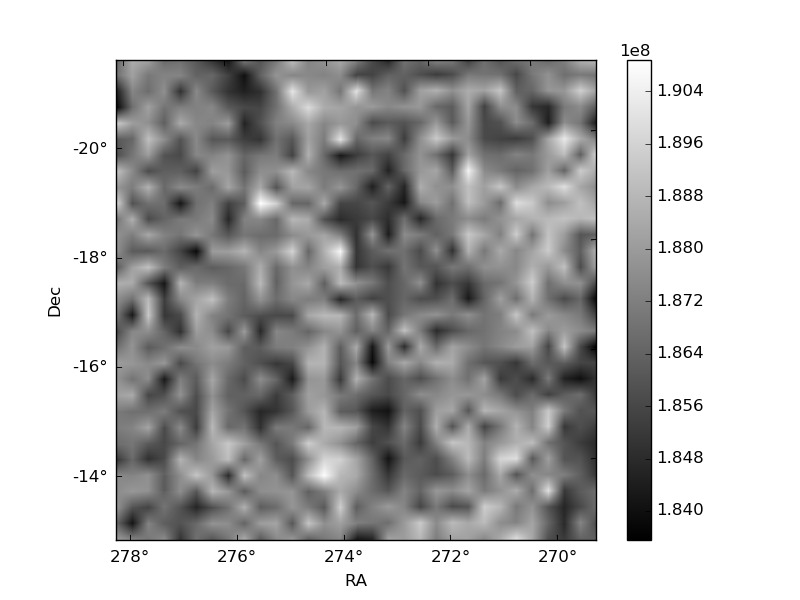
Histogram calculated using DETX and DETY for each event in the final _common_clean file
| Quadrant A | 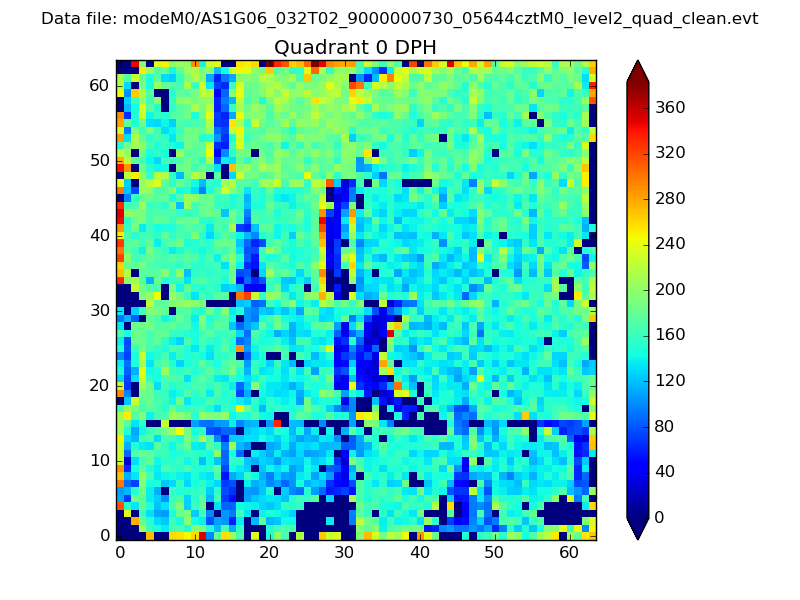 |
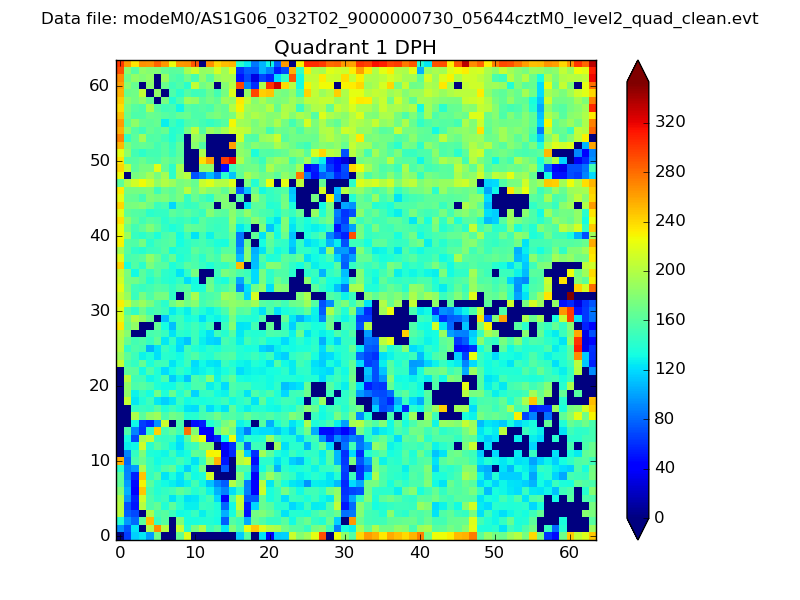 |
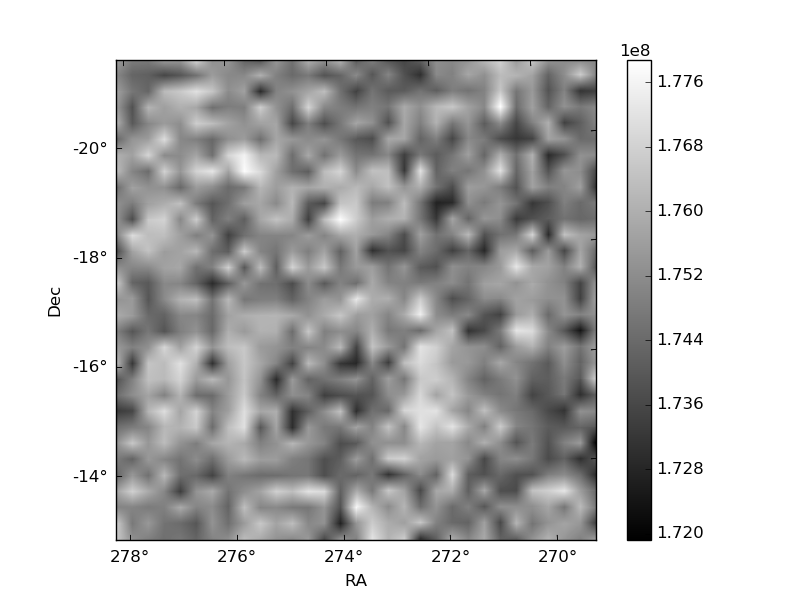
Quadrant B |
|---|---|---|---|
| Quadrant D | 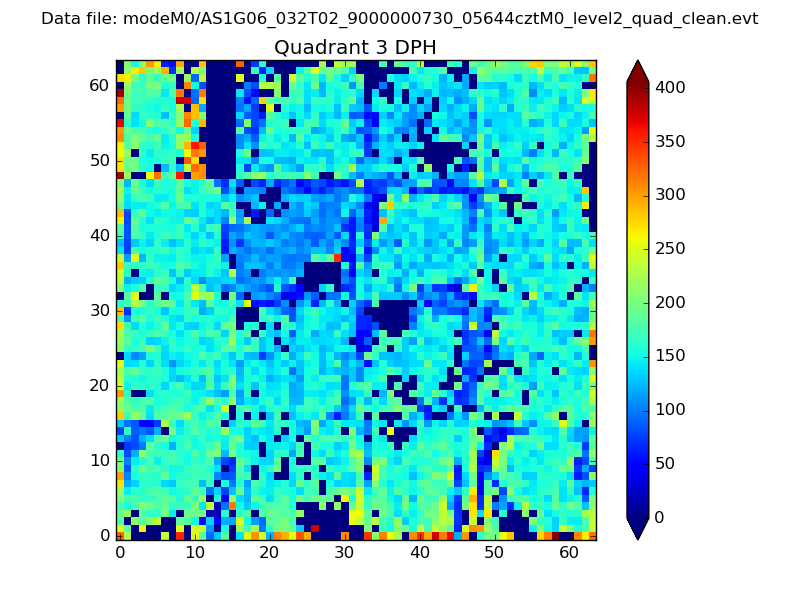 |
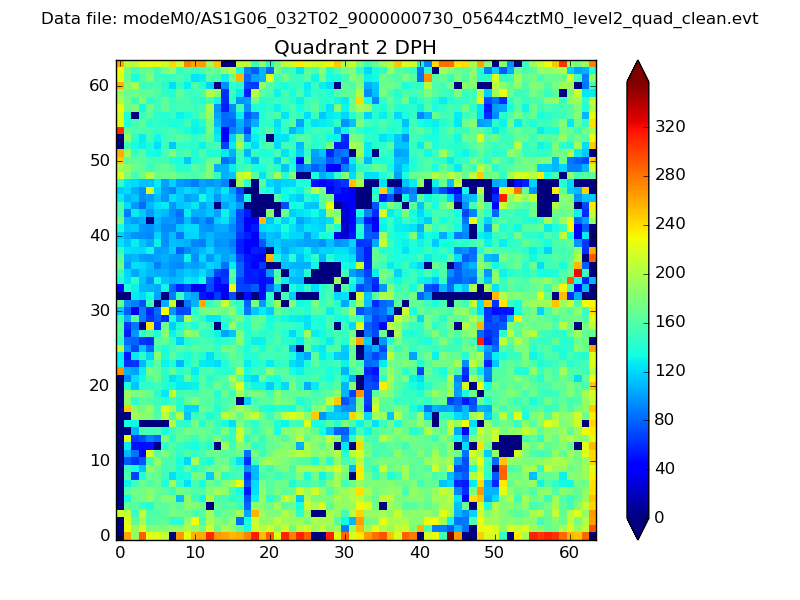 |
Quadrant C |
| Plot type | Count rate plots | Images |
|---|---|---|
| Comparison with Poisson distribution Blue bars denote a histogram of data divided into 1 sec bins. Red curve is a Poisson curve with rate = median count rate of data. |
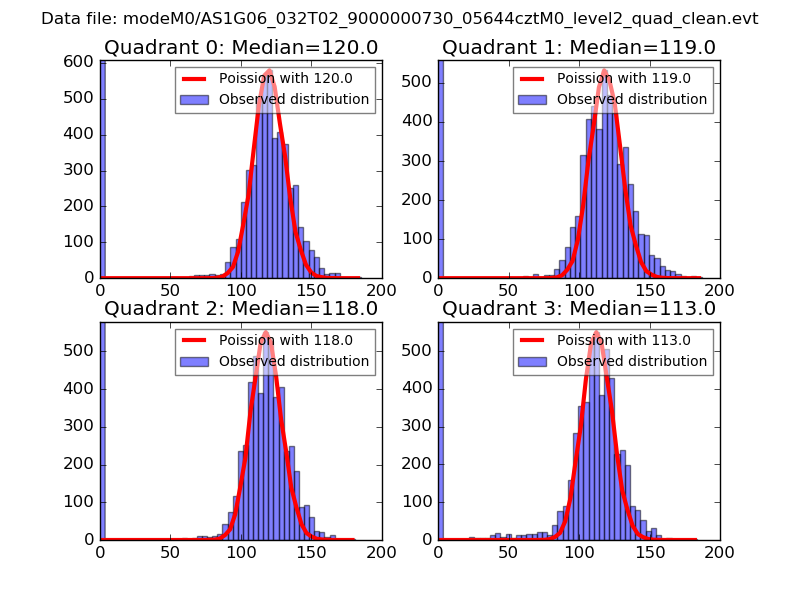 |
 |
| Quadrant-wise count rates Data is divided into 100 sec bins |
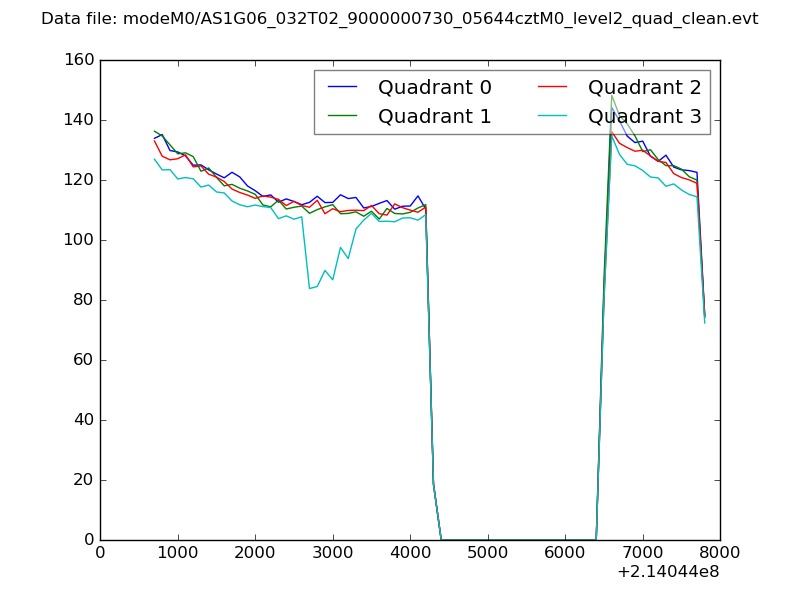 |
|
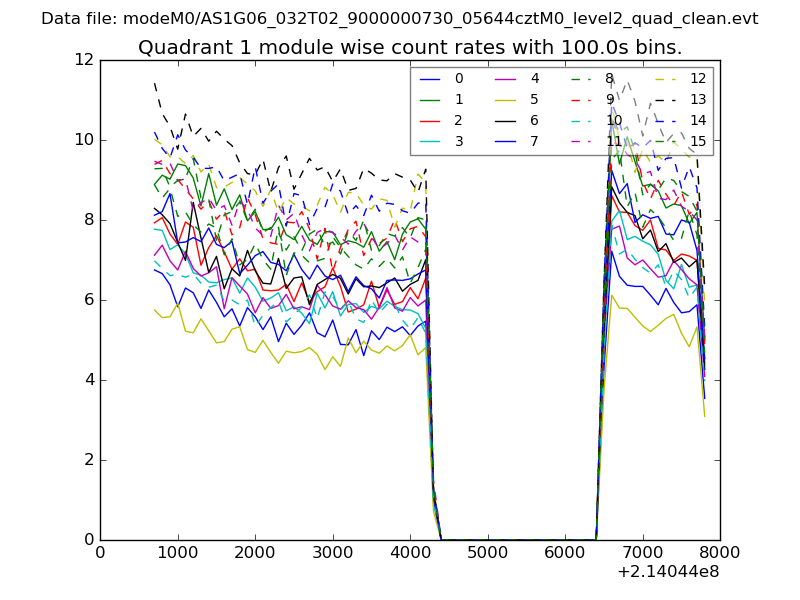
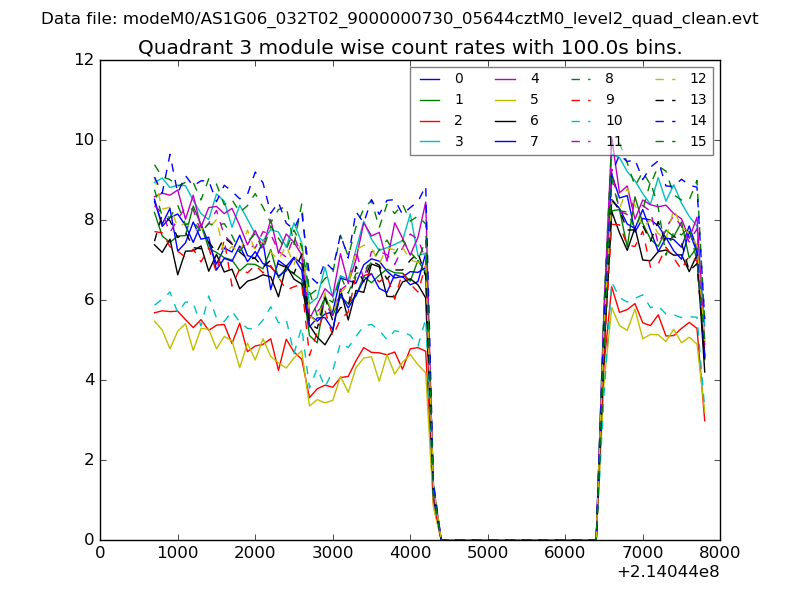
| Module-wise count rates for Quadrant A Data is divided into 100 sec bins |
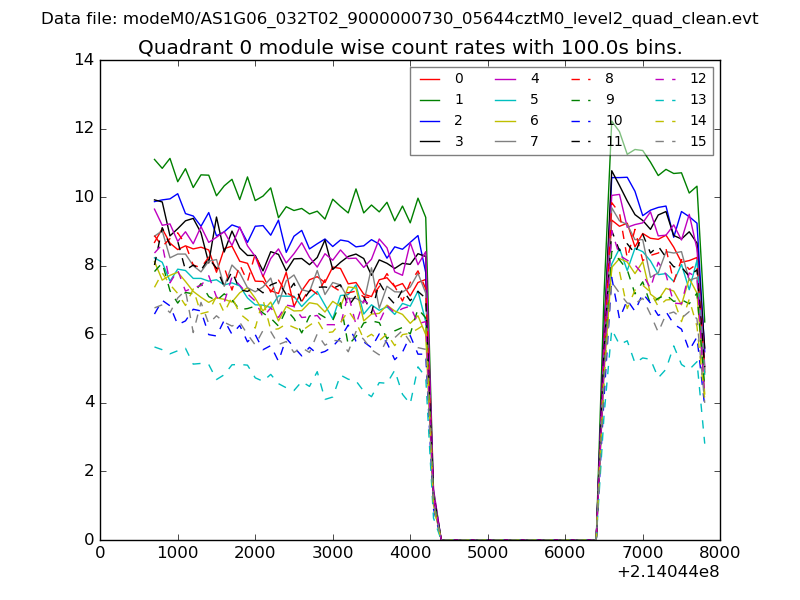 |
 |
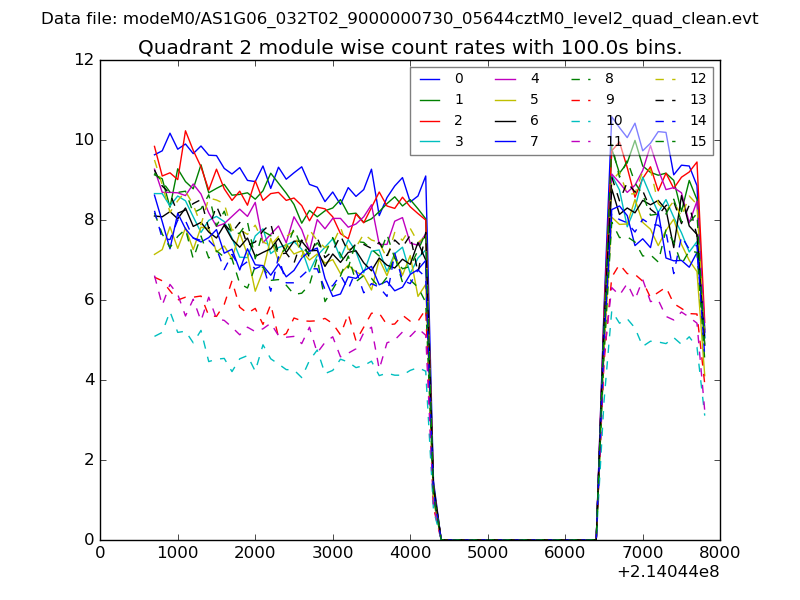
| Module-wise count rates for Quadrant B Data is divided into 100 sec bins |
 |
 |
| Module-wise count rates for Quadrant C Data is divided into 100 sec bins |
 |
 |
| Module-wise count rates for Quadrant D Data is divided into 100 sec bins |
 |
 |
| Parameter | Plot |
|---|---|
| CZT HV Monitor | 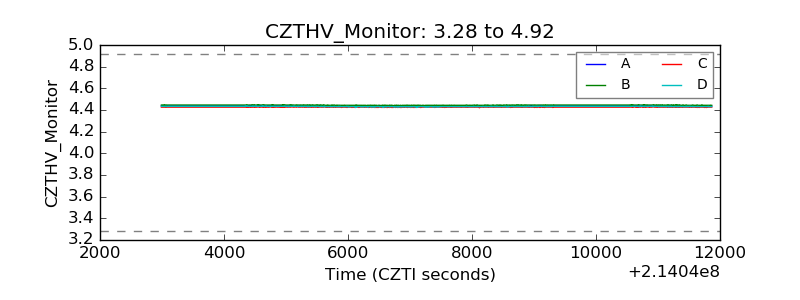 |
| D_VDD | 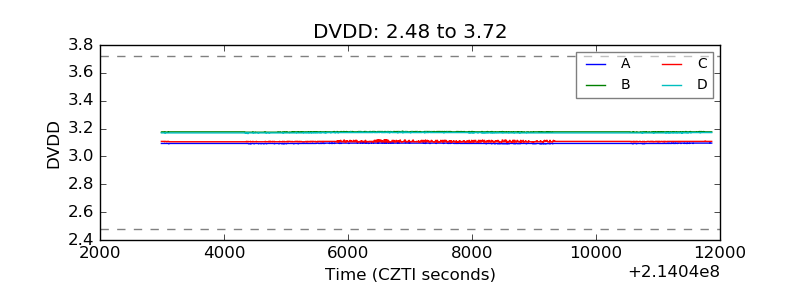 |
| Temperature 1 | 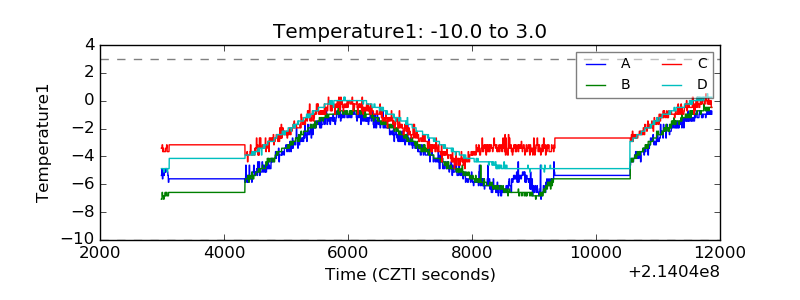 |
| Veto HV Monitor | 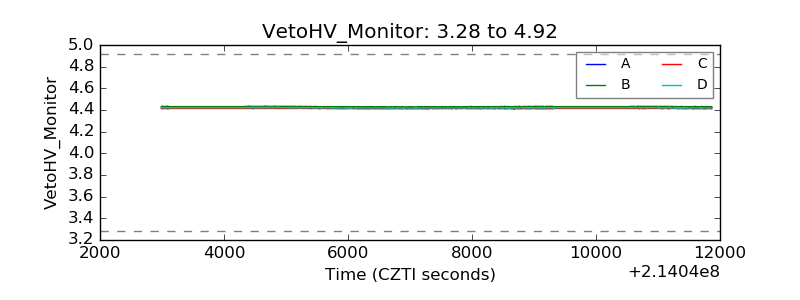 |
| Veto LLD | 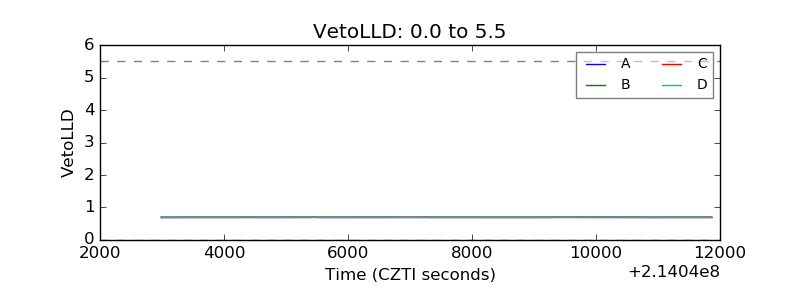 |
| Alpha Counter | 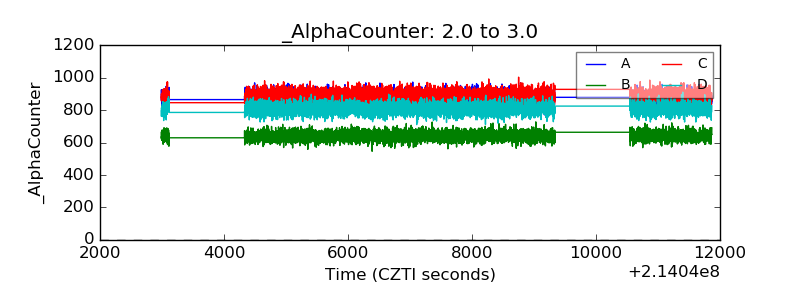 |
| _CPM_Rate | 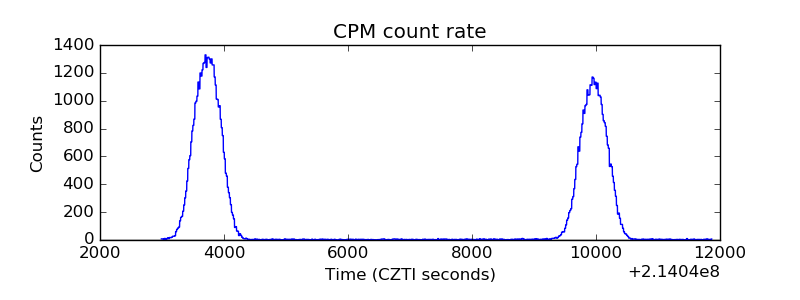 |
| CZT Counter | 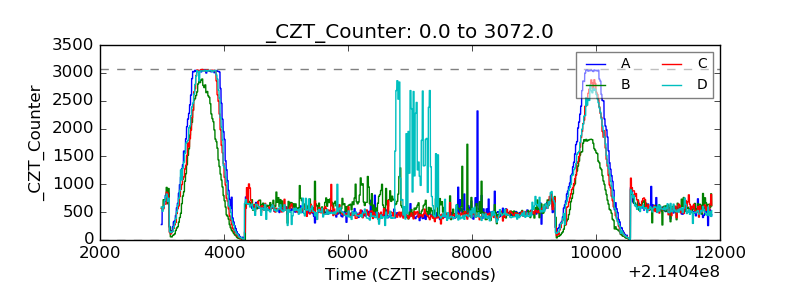 |
| +2.5 Volts monitor |  |
| +5 Volts monitor |  |
| _ROLL_ROT | 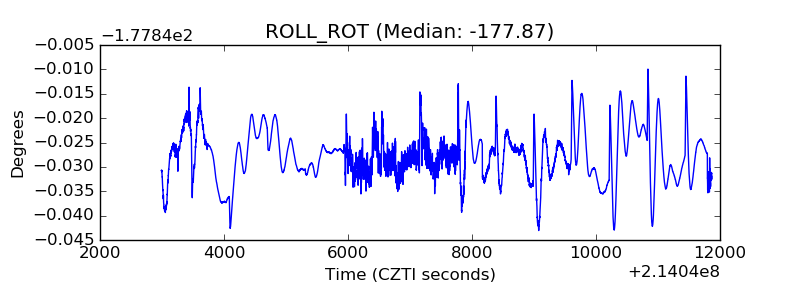 |
| _Roll_DEC | 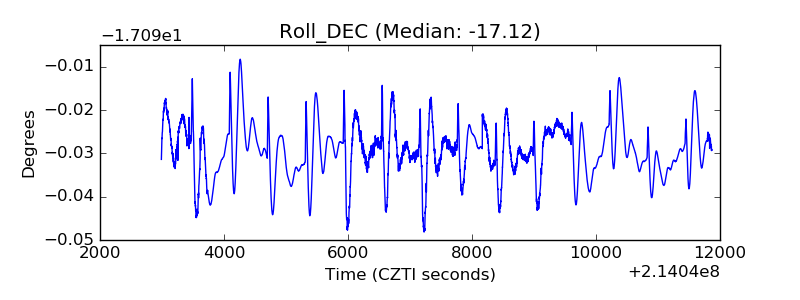 |
| _Roll_RA | 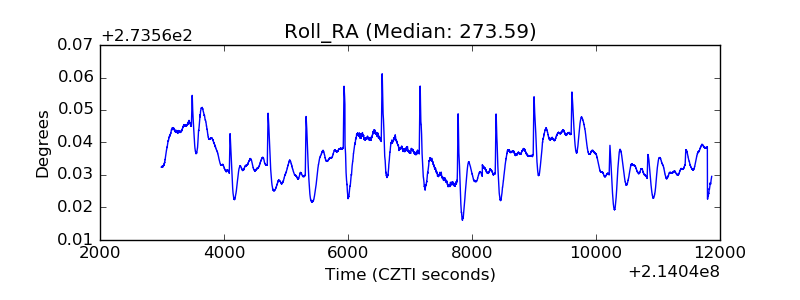 |
| Veto Counter | 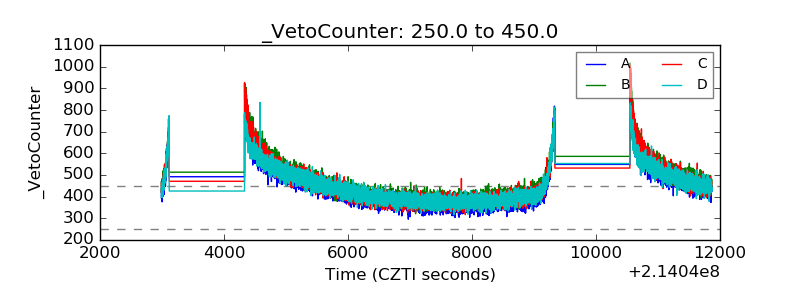 |