| Param | Original file | Final file |
|---|---|---|
| Filename | modeM0/AS1G06_032T02_9000000730_05645cztM0_level2.evt | modeM0/AS1G06_032T02_9000000730_05645cztM0_level2_quad_clean.evt |
| Size (bytes) | 466,750,080 | 86,137,920 |
| Size | 445.1 MB | 82.1 MB |
| Events in quadrant A | 3,102,681 | 558,965 |
| Events in quadrant B | 3,483,584 | 551,373 |
| Events in quadrant C | 3,422,640 | 549,159 |
| Events in quadrant D | 3,703,531 | 514,338 |
| Mode SS | |||
|---|---|---|---|
| Quadrant | BADHDUFLAG | Total packets | Discarded packets |
| A | 0 | 128 | 0 |
| B | 0 | 128 | 0 |
| C | 0 | 128 | 0 |
| D | 0 | 128 | 0 |
| Mode M0 | |||
|---|---|---|---|
| Quadrant | BADHDUFLAG | Total packets | Discarded packets |
| A | 0 | 13178 | 2 |
| B | 0 | 14393 | 1 |
| C | 0 | 14347 | 1 |
| D | 0 | 15099 | 1 |
| Mode M9 | |||
|---|---|---|---|
| Quadrant | BADHDUFLAG | Total packets | Discarded packets |
| A | 0 | 11 | 0 |
| B | 0 | 11 | 0 |
| C | 0 | 11 | 0 |
| D | 0 | 11 | 0 |
| Quadrant | Total seconds | Saturated seconds | Saturation percentage |
|---|---|---|---|
| A | 6221 | 118 | 1.896801% |
| B | 6221 | 141 | 2.266517% |
| C | 6221 | 61 | 0.980550% |
| D | 6221 | 323 | 5.192091% |
Noise dominated data is calculated using 1-second bins in cleaned event files. If a bin has >2000 counts, and if more than 50% of those come from <1% of pixels, then it is considered to be noise-dominated and hence unusable.
| Quadrant | # 1 sec bins | Bins with >0 counts | Bins with >2000 counts | High rate bins dominated by noise | Noise dominated (total time) | Noise dominated (detector-on time) | Marked lightcurve |
|---|---|---|---|---|---|---|---|
| A | 7406 | 6222 | 18 | 18 | 0.24% | 0.29% | 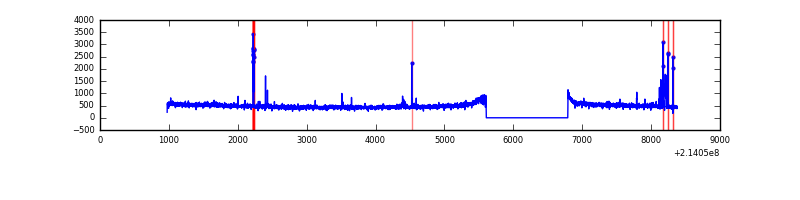 |
| B | 7406 | 6221 | 21 | 21 | 0.28% | 0.34% |  |
| C | 7406 | 6222 | 0 | 0 | 0.00% | 0.00% | 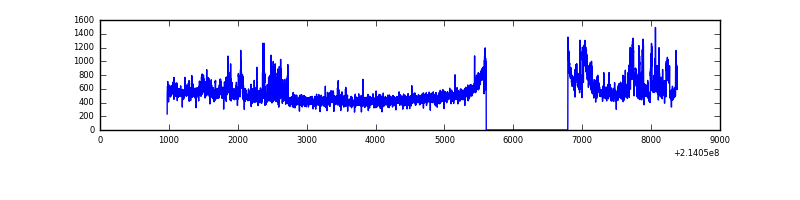 |
| D | 7406 | 6221 | 195 | 195 | 2.63% | 3.13% | 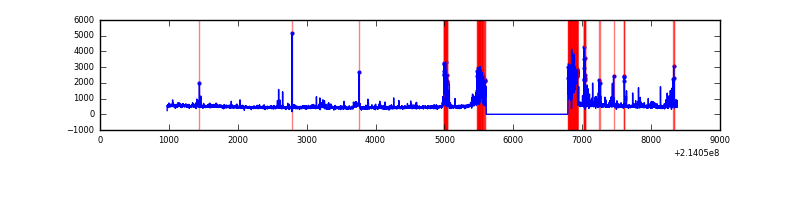 |
Top three noisy pixels from each quadrant. If the there are fewer than three noisy pixels in the level2.evt file, extra rows are filled as -1
| Pixel properties | Quadrant properties | ||||||
|---|---|---|---|---|---|---|---|
| Quadrant | DetID | PixID | Counts | Sigma | Mean | Median | Sigma |
| A | 0 | 50 | 89495 | 556.67 | 776 | 761 | 159.4 |
| A | 13 | 6 | 15236 | 90.81 | 776 | 761 | 159.4 |
| A | 0 | 226 | 7858 | 44.52 | 776 | 761 | 159.4 |
| B | 10 | 16 | 158361 | 1071.8 | 769 | 752 | 147.1 |
| B | 15 | 204 | 106097 | 716.39 | 769 | 752 | 147.1 |
| B | 0 | 214 | 104955 | 708.62 | 769 | 752 | 147.1 |
| C | 1 | 16 | 528141 | 3087.91 | 738 | 742 | 170.8 |
| C | 13 | 61 | 6095 | 31.34 | 738 | 742 | 170.8 |
| C | 14 | 222 | 4361 | 21.19 | 738 | 742 | 170.8 |
| D | 4 | 95 | 565984 | 3162.56 | 719 | 696 | 178.7 |
| D | 12 | 233 | 183730 | 1024.0 | 719 | 696 | 178.7 |
| D | 2 | 152 | 47150 | 259.89 | 719 | 696 | 178.7 |
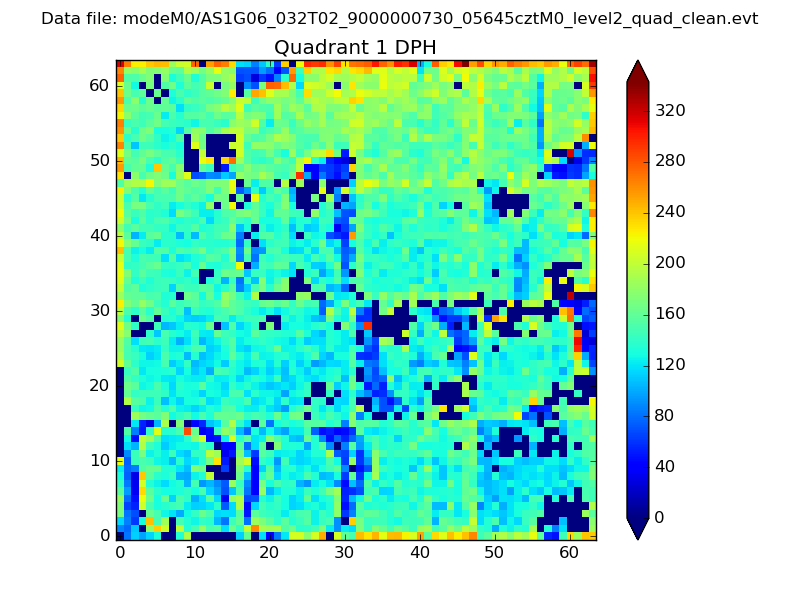
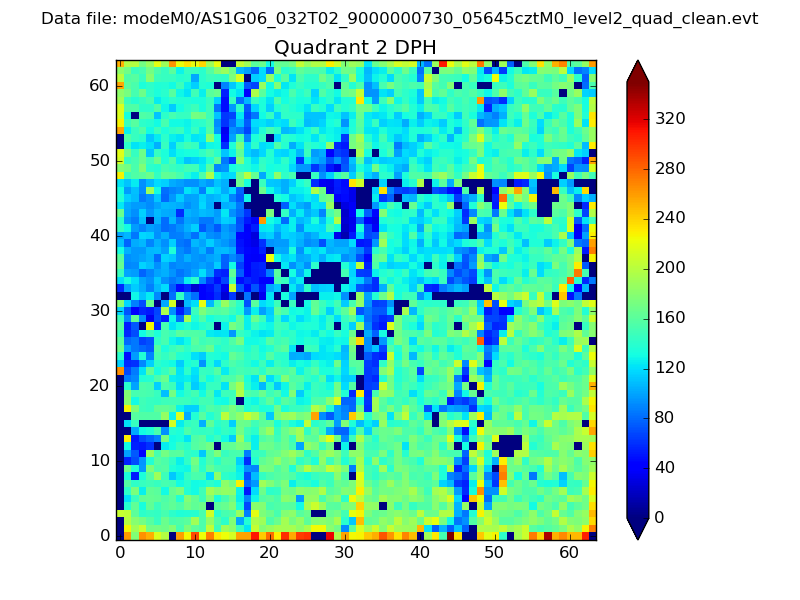
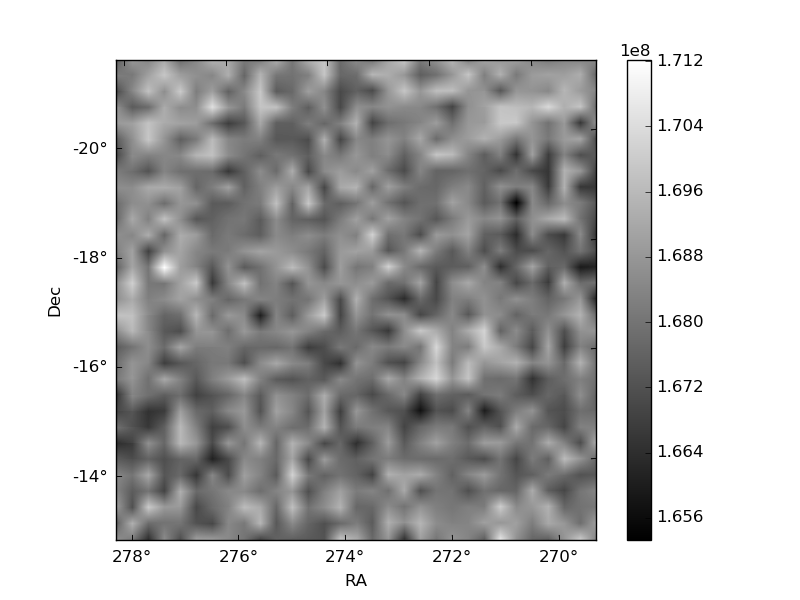
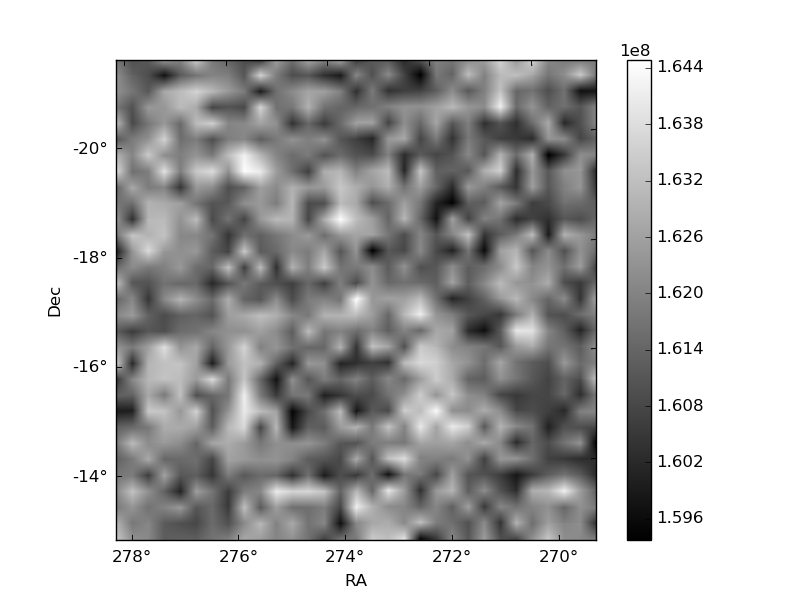
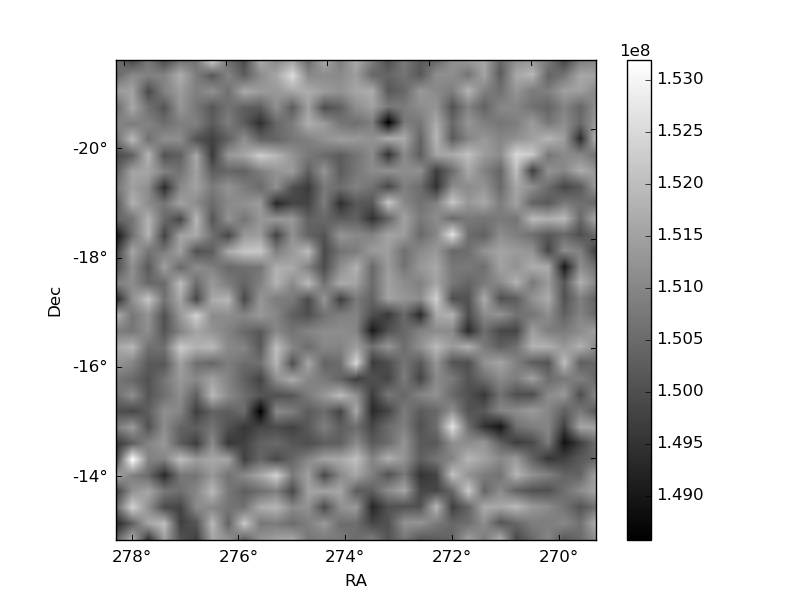
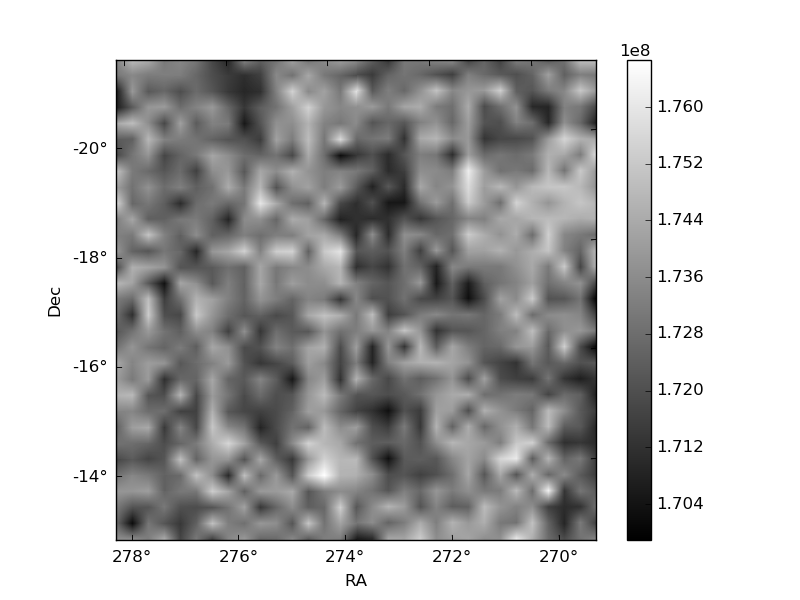
Histogram calculated using DETX and DETY for each event in the final _common_clean file
| Quadrant A | 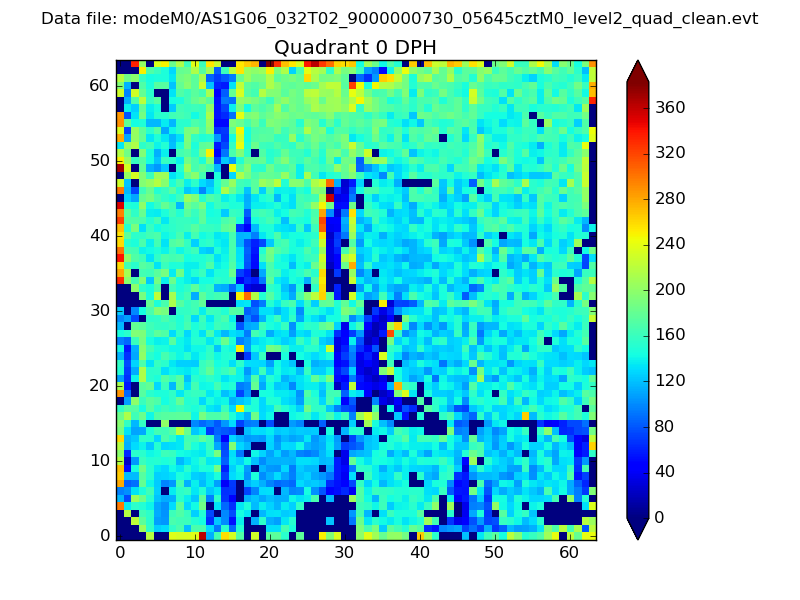 |
 |
Quadrant B |
|---|---|---|---|
| Quadrant D | 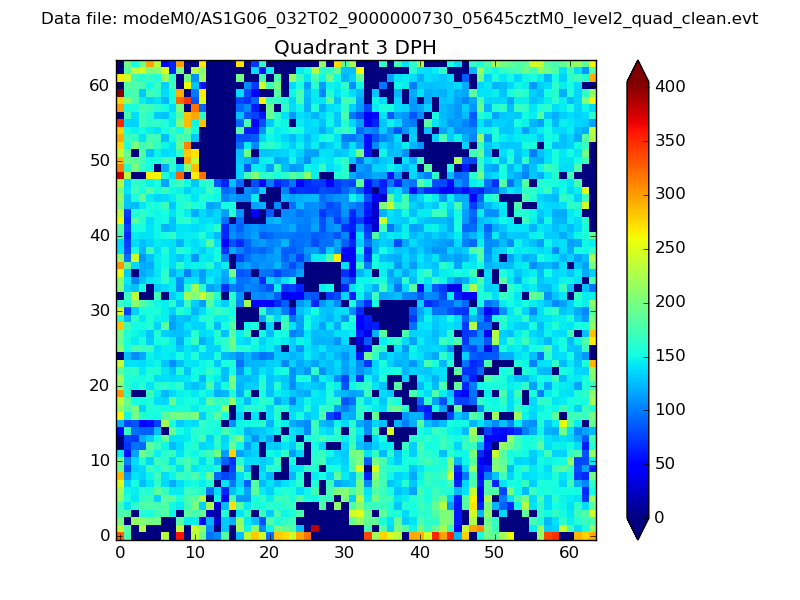 |
 |
Quadrant C |
| Plot type | Count rate plots | Images |
|---|---|---|
| Comparison with Poisson distribution Blue bars denote a histogram of data divided into 1 sec bins. Red curve is a Poisson curve with rate = median count rate of data. |
 |
 |
| Quadrant-wise count rates Data is divided into 100 sec bins |
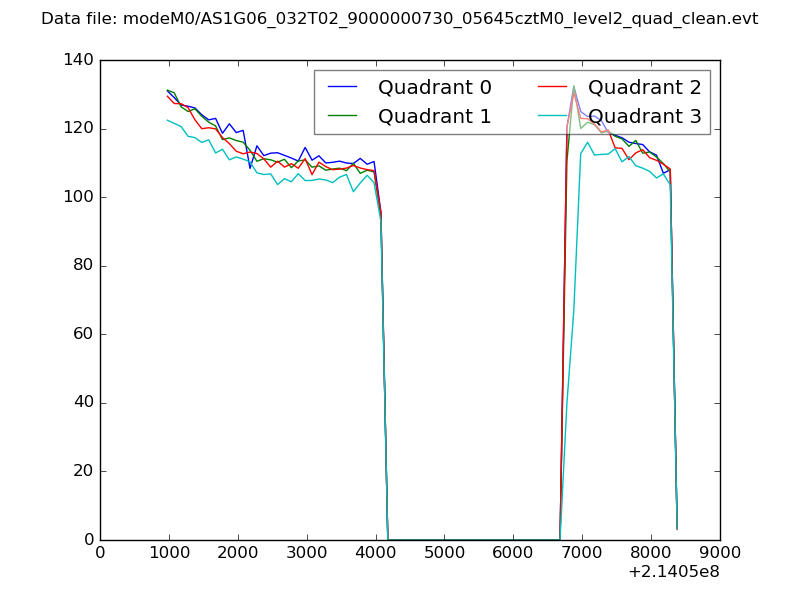 |
|
| Module-wise count rates for Quadrant A Data is divided into 100 sec bins |
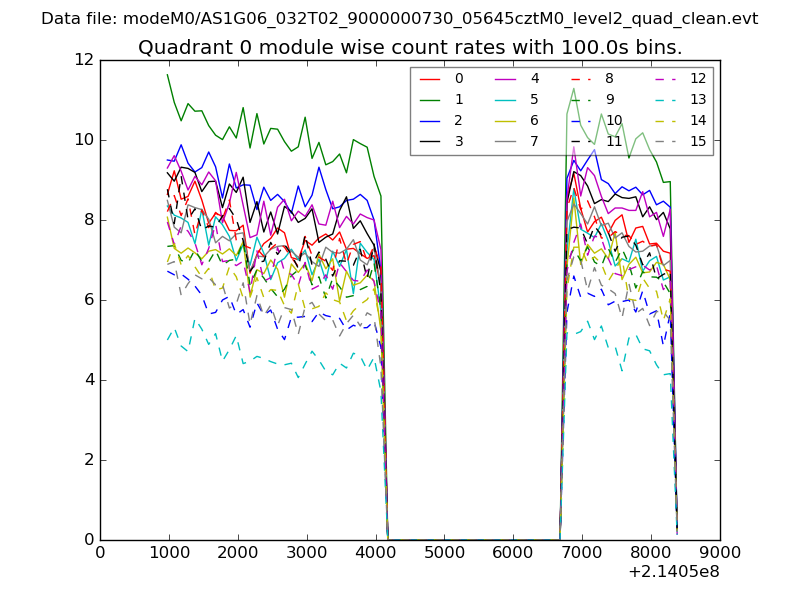 |
 |
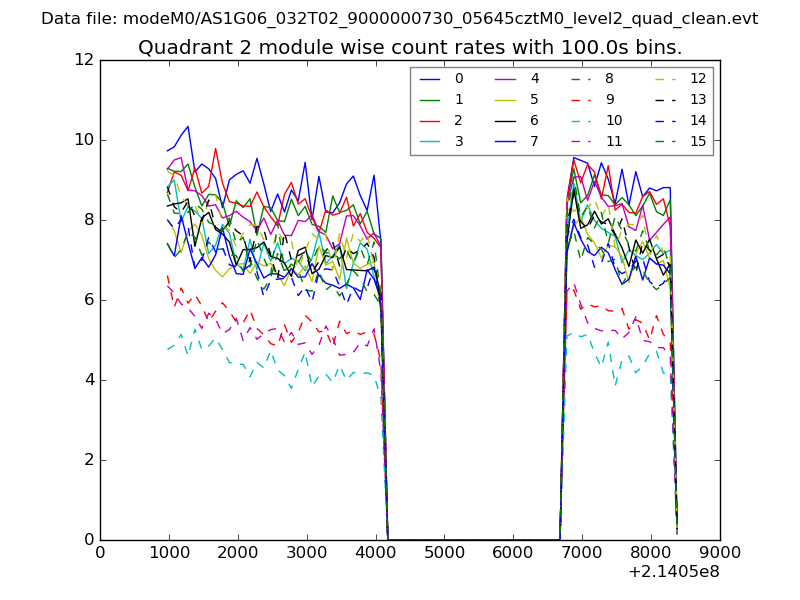
| Module-wise count rates for Quadrant B Data is divided into 100 sec bins |
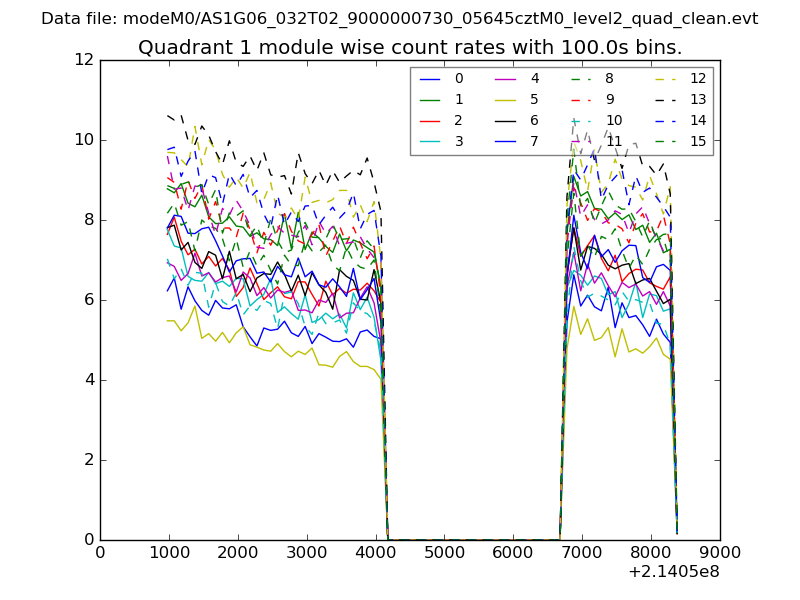 |
 |
| Module-wise count rates for Quadrant C Data is divided into 100 sec bins |
 |
 |
| Module-wise count rates for Quadrant D Data is divided into 100 sec bins |
 |
 |
| Parameter | Plot |
|---|---|
| CZT HV Monitor | 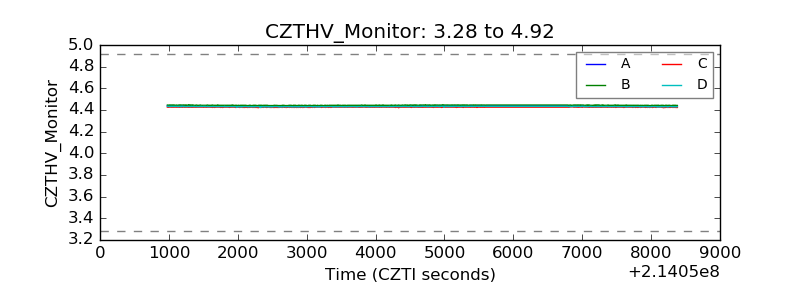 |
| D_VDD | 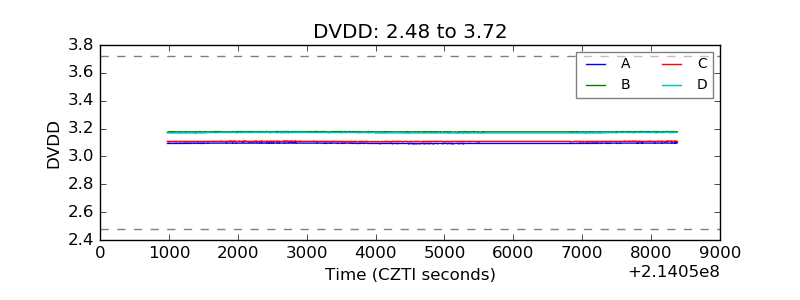 |
| Temperature 1 | 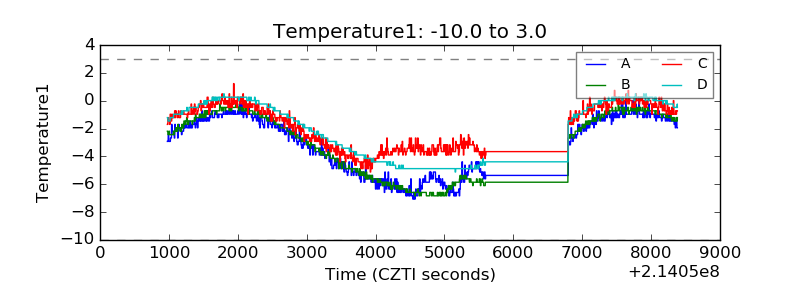 |
| Veto HV Monitor | 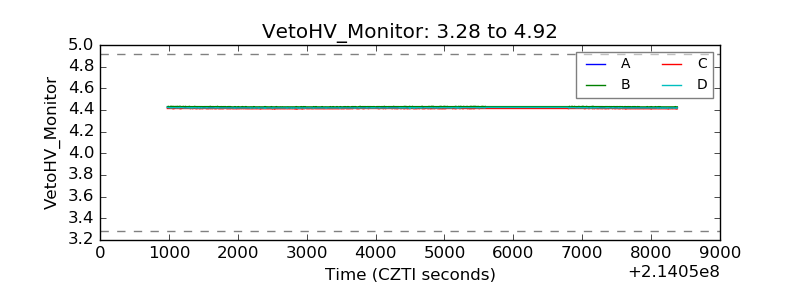 |
| Veto LLD | 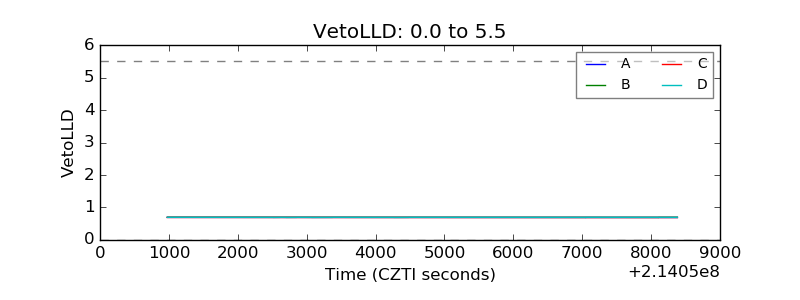 |
| Alpha Counter | 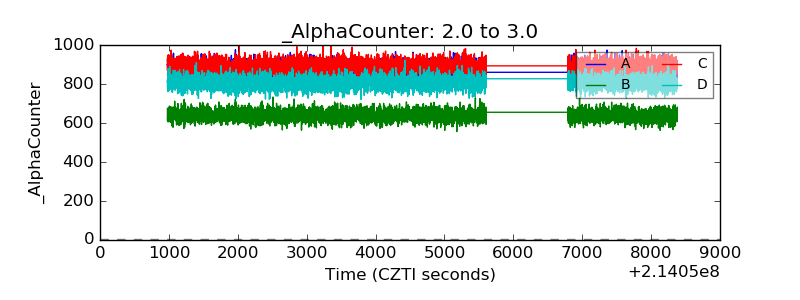 |
| _CPM_Rate | 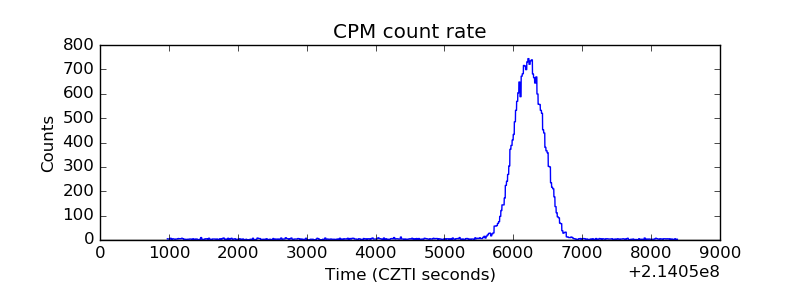 |
| CZT Counter | 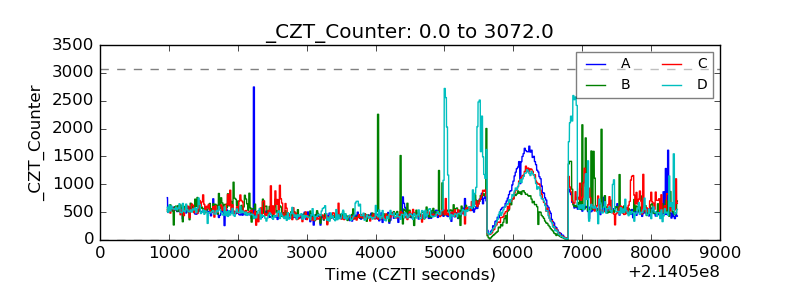 |
| +2.5 Volts monitor |  |
| +5 Volts monitor |  |
| _ROLL_ROT |  |
| _Roll_DEC |  |
| _Roll_RA | 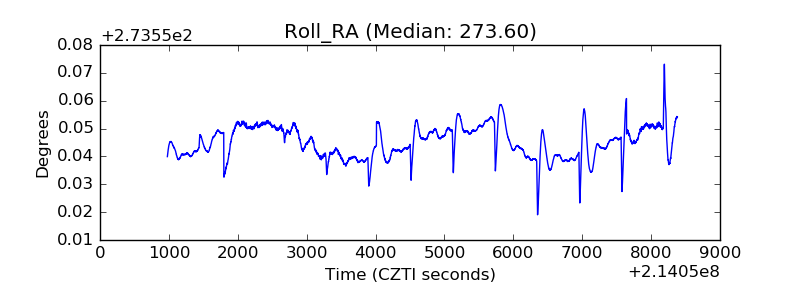 |
| Veto Counter | 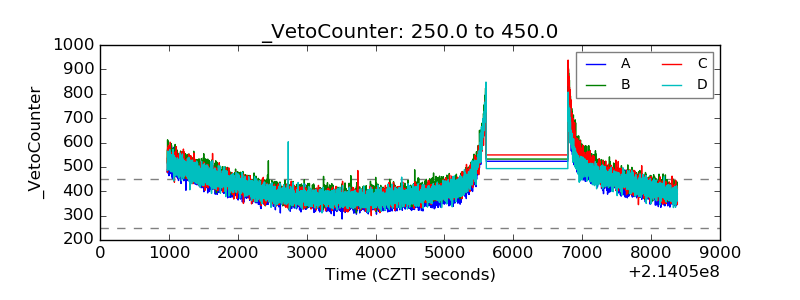 |