| Param | Original file | Final file |
|---|---|---|
| Filename | modeM0/AS1G06_032T02_9000000730_05646cztM0_level2.evt | modeM0/AS1G06_032T02_9000000730_05646cztM0_level2_quad_clean.evt |
| Size (bytes) | 509,322,240 | 78,197,760 |
| Size | 485.7 MB | 74.6 MB |
| Events in quadrant A | 3,194,558 | 490,914 |
| Events in quadrant B | 3,936,017 | 484,153 |
| Events in quadrant C | 4,268,829 | 479,882 |
| Events in quadrant D | 3,592,619 | 467,643 |
| Mode SS | |||
|---|---|---|---|
| Quadrant | BADHDUFLAG | Total packets | Discarded packets |
| A | 0 | 130 | 0 |
| B | 0 | 130 | 0 |
| C | 0 | 130 | 0 |
| D | 0 | 130 | 0 |
| Mode M0 | |||
|---|---|---|---|
| Quadrant | BADHDUFLAG | Total packets | Discarded packets |
| A | 0 | 13758 | 2 |
| B | 0 | 15850 | 1 |
| C | 0 | 17154 | 1 |
| D | 0 | 14999 | 1 |
| Mode M9 | |||
|---|---|---|---|
| Quadrant | BADHDUFLAG | Total packets | Discarded packets |
| A | 0 | 11 | 0 |
| B | 0 | 11 | 0 |
| C | 0 | 11 | 0 |
| D | 0 | 11 | 0 |
| Quadrant | Total seconds | Saturated seconds | Saturation percentage |
|---|---|---|---|
| A | 6380 | 104 | 1.630094% |
| B | 6380 | 203 | 3.181818% |
| C | 6380 | 123 | 1.927900% |
| D | 6380 | 101 | 1.583072% |
Noise dominated data is calculated using 1-second bins in cleaned event files. If a bin has >2000 counts, and if more than 50% of those come from <1% of pixels, then it is considered to be noise-dominated and hence unusable.
| Quadrant | # 1 sec bins | Bins with >0 counts | Bins with >2000 counts | High rate bins dominated by noise | Noise dominated (total time) | Noise dominated (detector-on time) | Marked lightcurve |
|---|---|---|---|---|---|---|---|
| A | 7490 | 6381 | 40 | 40 | 0.53% | 0.63% | 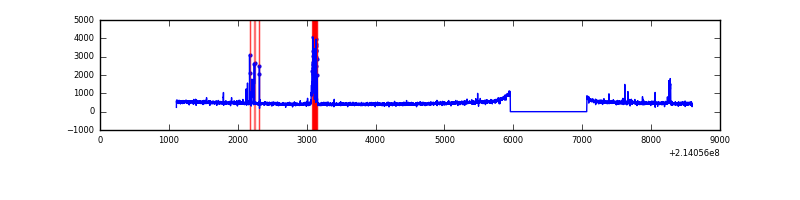 |
| B | 7490 | 6381 | 79 | 79 | 1.05% | 1.24% | 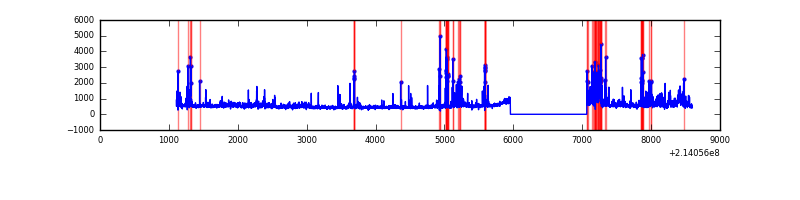 |
| C | 7490 | 6381 | 61 | 61 | 0.81% | 0.96% | 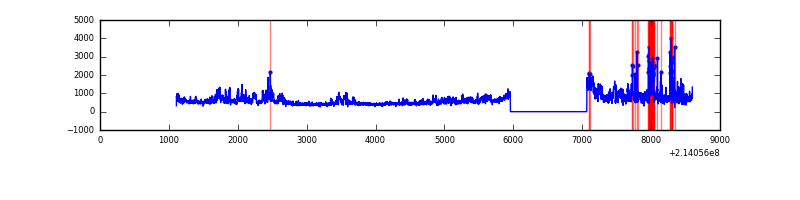 |
| D | 7490 | 6381 | 80 | 80 | 1.07% | 1.25% | 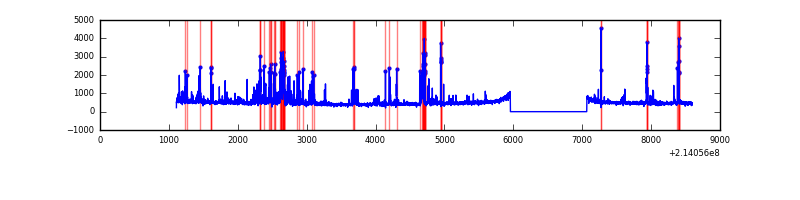 |
Top three noisy pixels from each quadrant. If the there are fewer than three noisy pixels in the level2.evt file, extra rows are filled as -1
| Pixel properties | Quadrant properties | ||||||
|---|---|---|---|---|---|---|---|
| Quadrant | DetID | PixID | Counts | Sigma | Mean | Median | Sigma |
| A | 0 | 50 | 212716 | 1346.72 | 767 | 753 | 157.4 |
| A | 13 | 6 | 13719 | 82.38 | 767 | 753 | 157.4 |
| A | 12 | 194 | 7910 | 45.47 | 767 | 753 | 157.4 |
| B | 10 | 16 | 472943 | 3206.58 | 763 | 747 | 147.3 |
| B | 15 | 204 | 160185 | 1082.71 | 763 | 747 | 147.3 |
| B | 0 | 219 | 109117 | 735.92 | 763 | 747 | 147.3 |
| C | 1 | 16 | 1216066 | 7153.13 | 731 | 735 | 169.9 |
| C | 5 | 250 | 158953 | 931.23 | 731 | 735 | 169.9 |
| C | 5 | 233 | 27460 | 157.3 | 731 | 735 | 169.9 |
| D | 12 | 233 | 222589 | 1211.21 | 738 | 714 | 183.2 |
| D | 2 | 136 | 219316 | 1193.35 | 738 | 714 | 183.2 |
| D | 4 | 95 | 97224 | 526.85 | 738 | 714 | 183.2 |
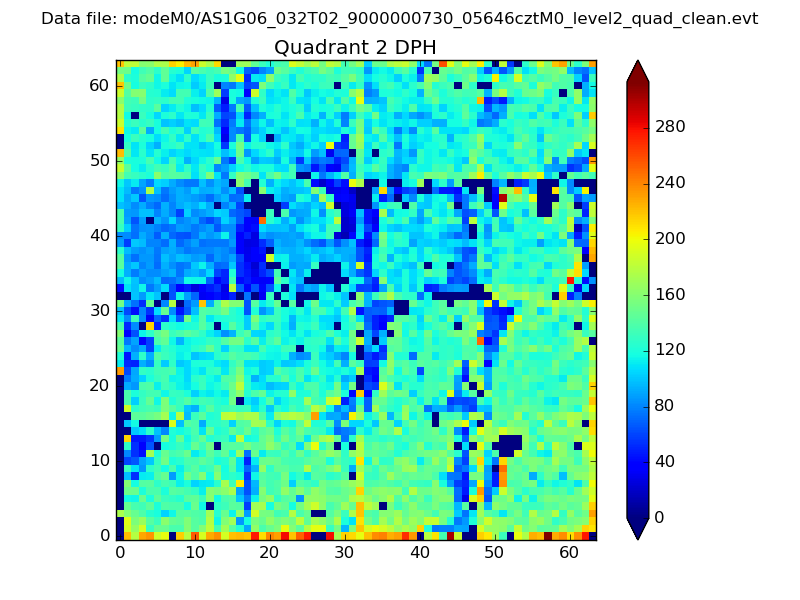
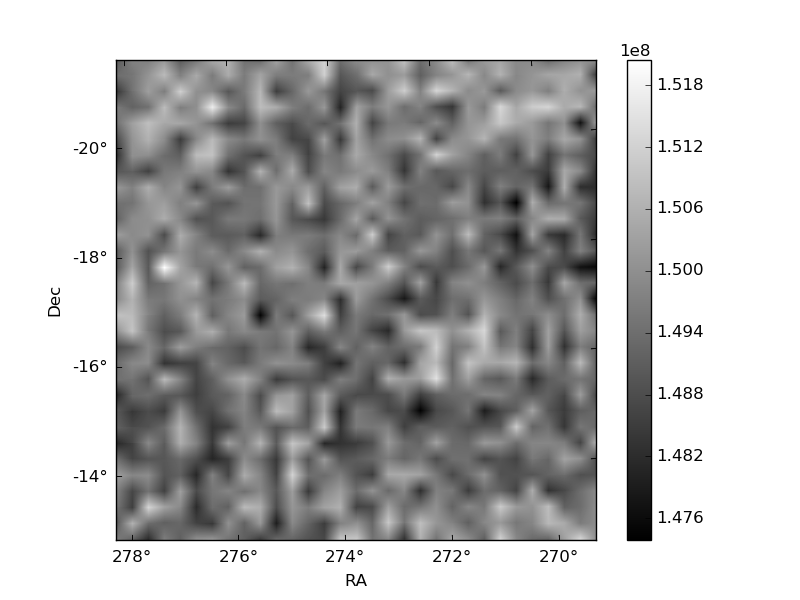
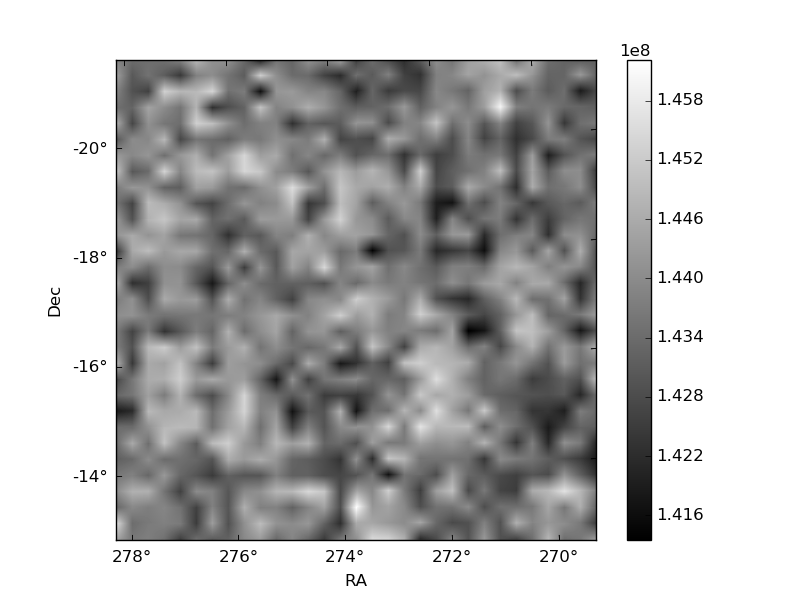
Histogram calculated using DETX and DETY for each event in the final _common_clean file
| Quadrant A | 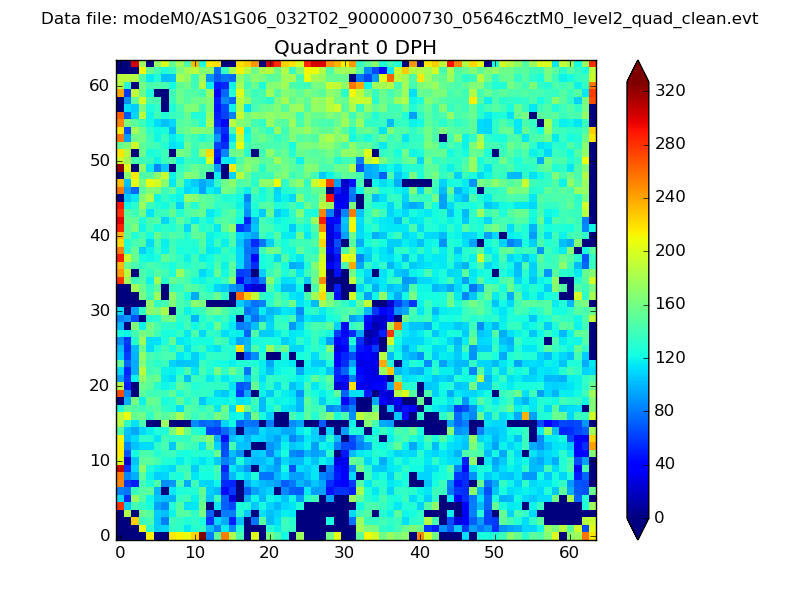 |
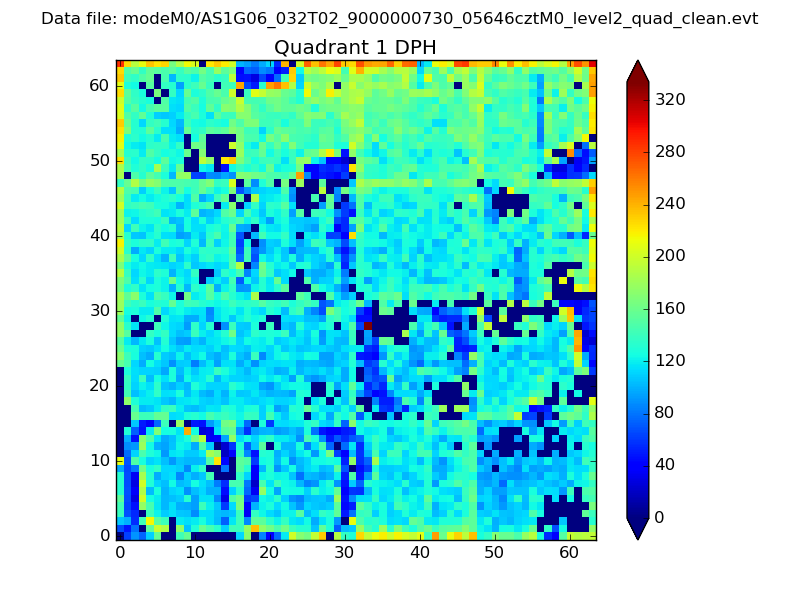 |
Quadrant B |
|---|---|---|---|
| Quadrant D | 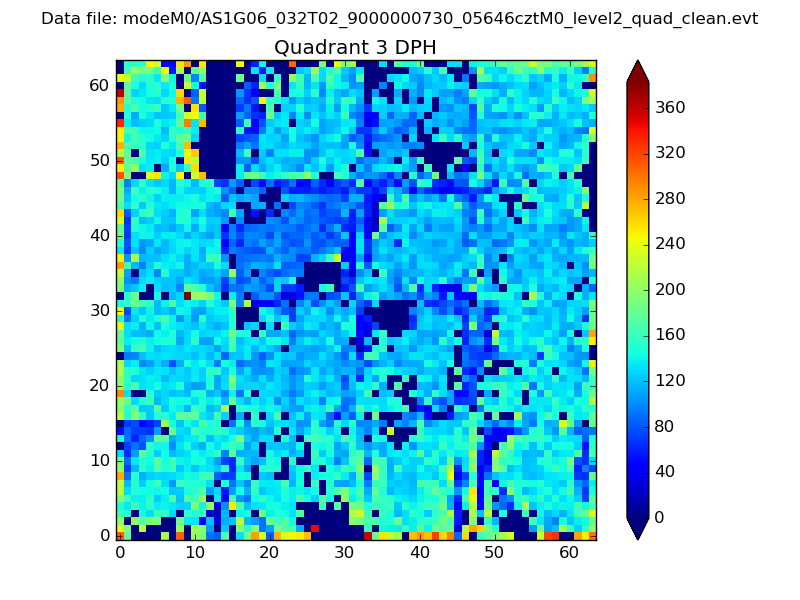 |
 |
Quadrant C |
| Plot type | Count rate plots | Images |
|---|---|---|
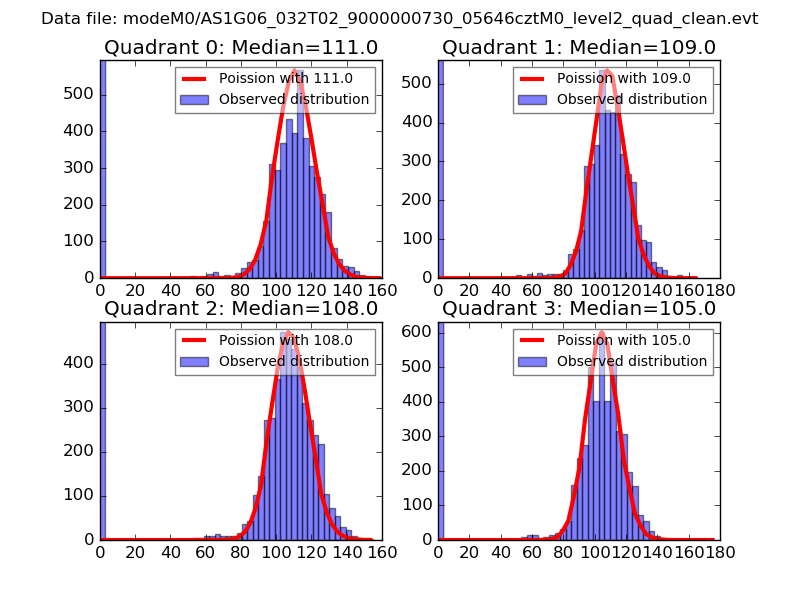
| Comparison with Poisson distribution Blue bars denote a histogram of data divided into 1 sec bins. Red curve is a Poisson curve with rate = median count rate of data. |
 |
 |
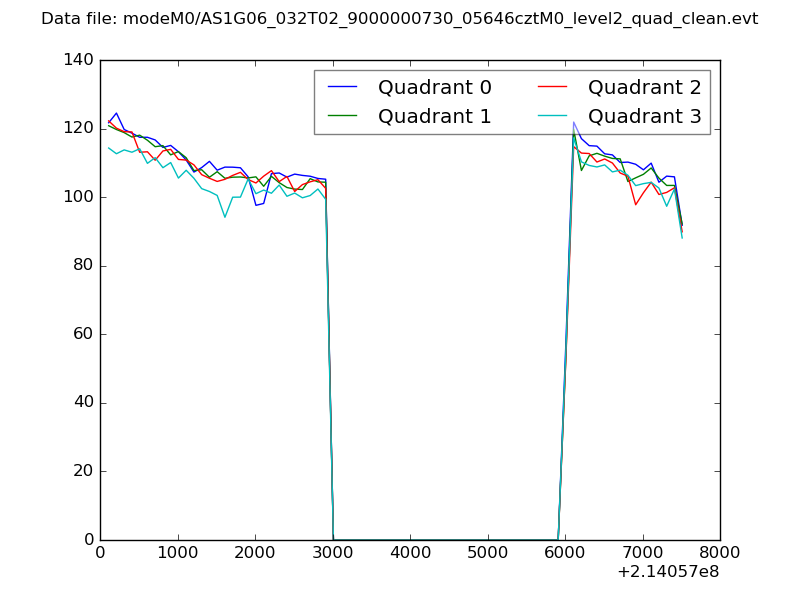
| Quadrant-wise count rates Data is divided into 100 sec bins |
 |
|
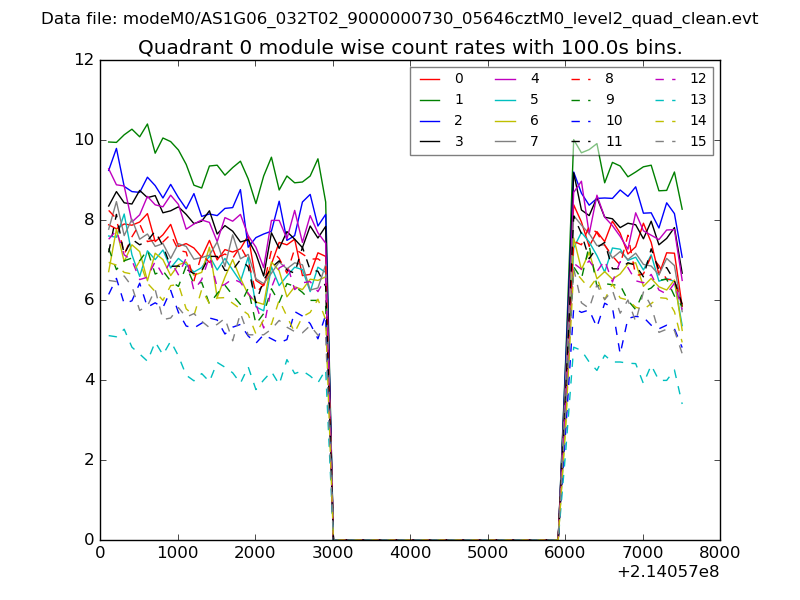
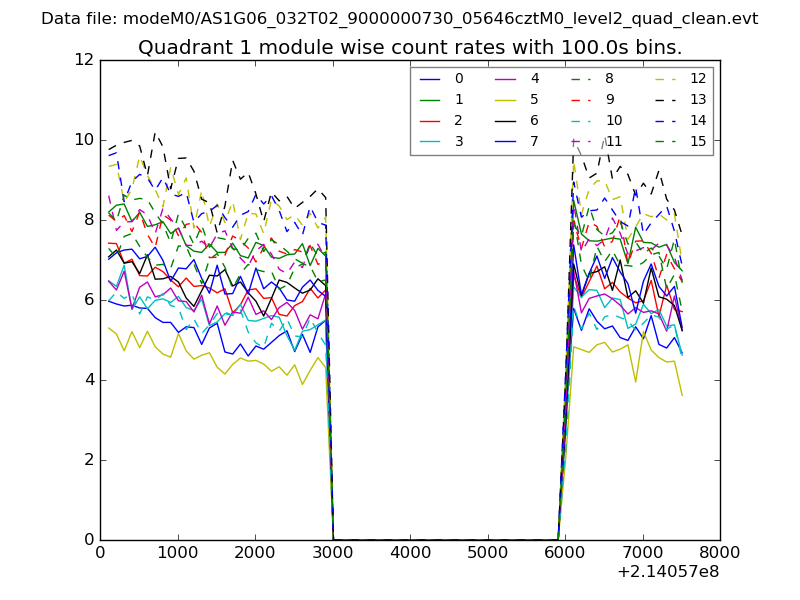
| Module-wise count rates for Quadrant A Data is divided into 100 sec bins |
 |
 |
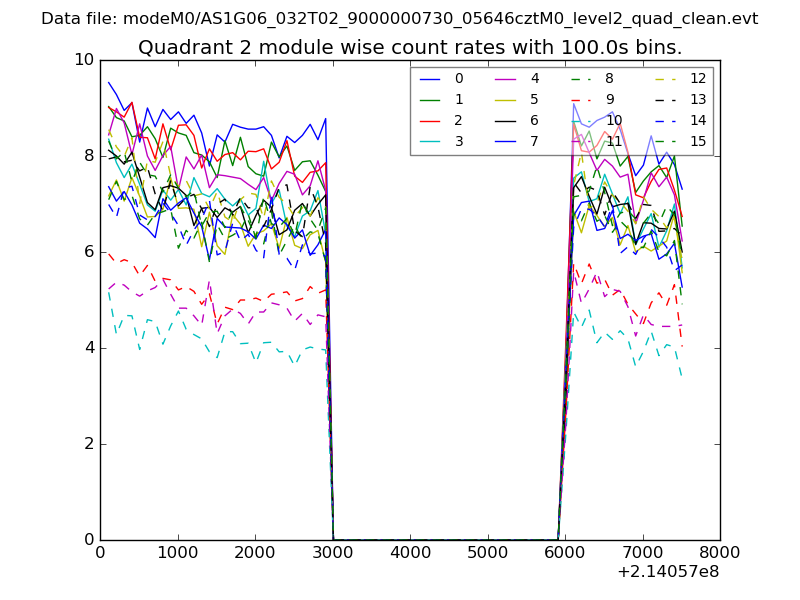
| Module-wise count rates for Quadrant B Data is divided into 100 sec bins |
 |
 |
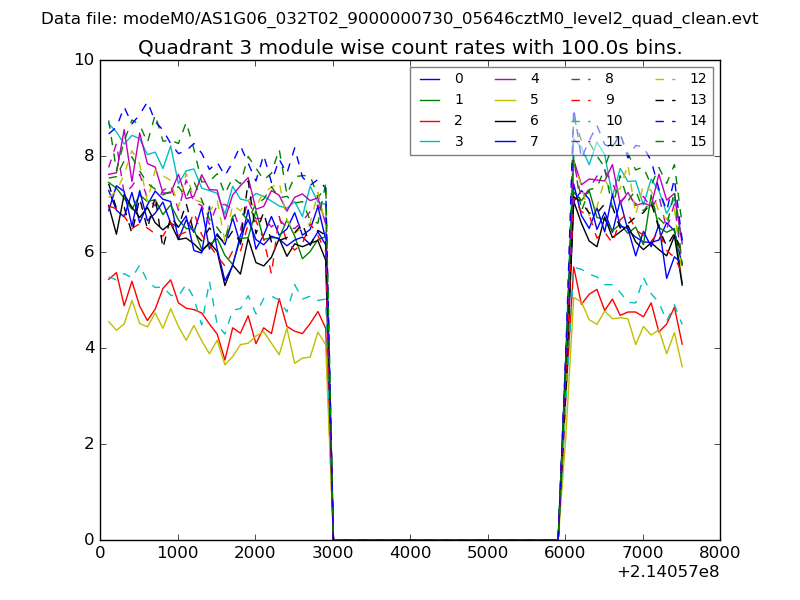
| Module-wise count rates for Quadrant C Data is divided into 100 sec bins |
 |
 |
| Module-wise count rates for Quadrant D Data is divided into 100 sec bins |
 |
 |
| Parameter | Plot |
|---|---|
| CZT HV Monitor | 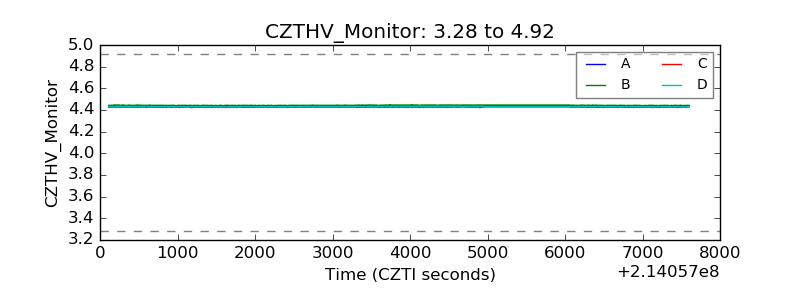 |
| D_VDD | 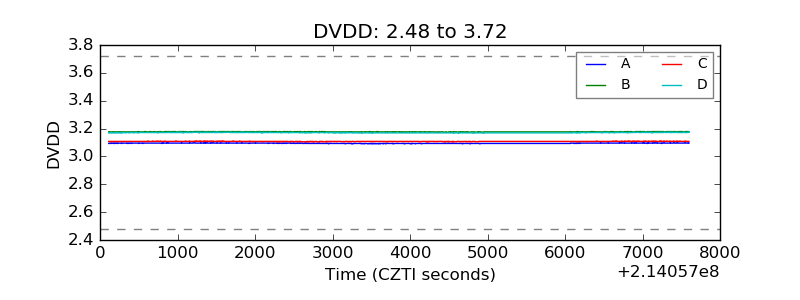 |
| Temperature 1 | 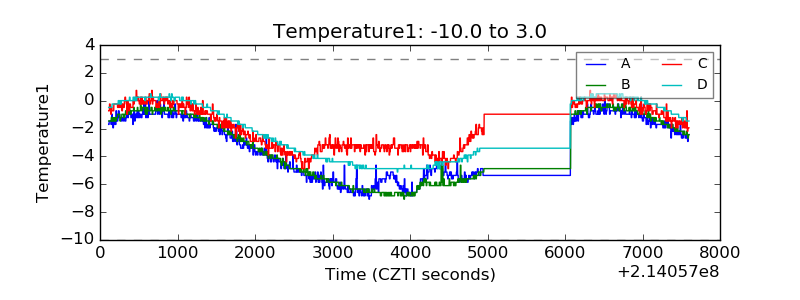 |
| Veto HV Monitor | 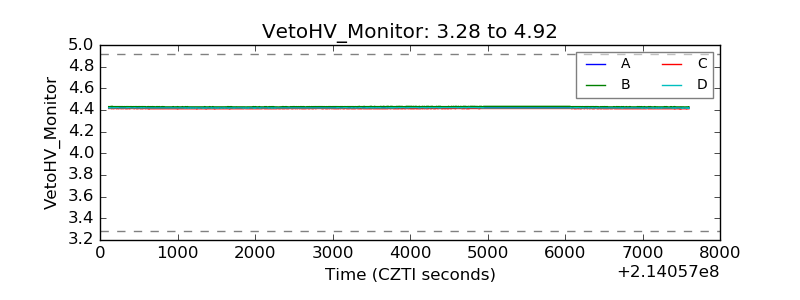 |
| Veto LLD | 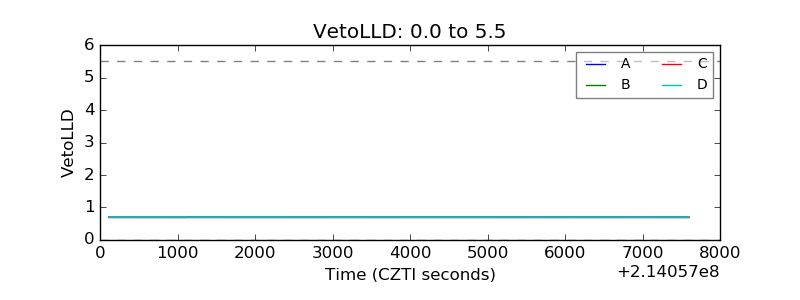 |
| Alpha Counter | 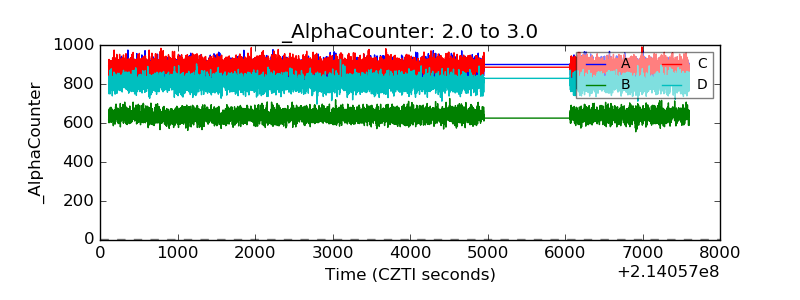 |
| _CPM_Rate | 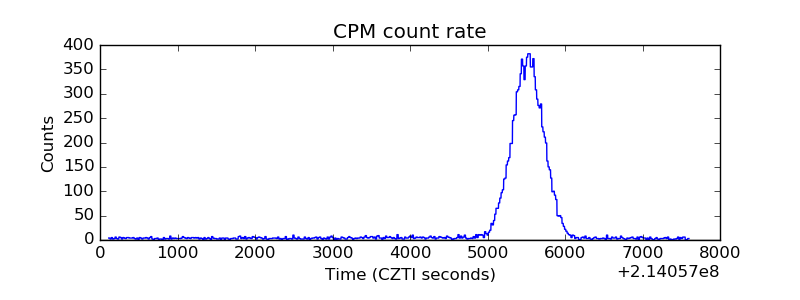 |
| CZT Counter | 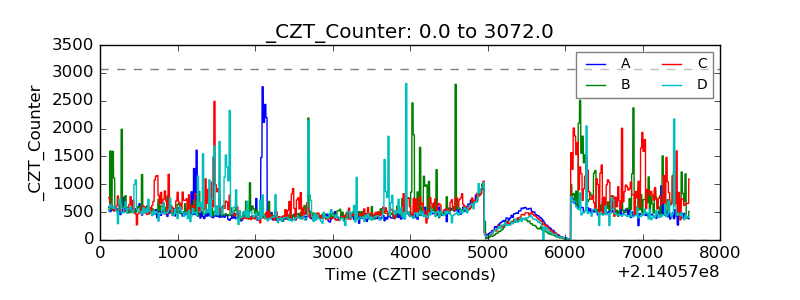 |
| +2.5 Volts monitor | 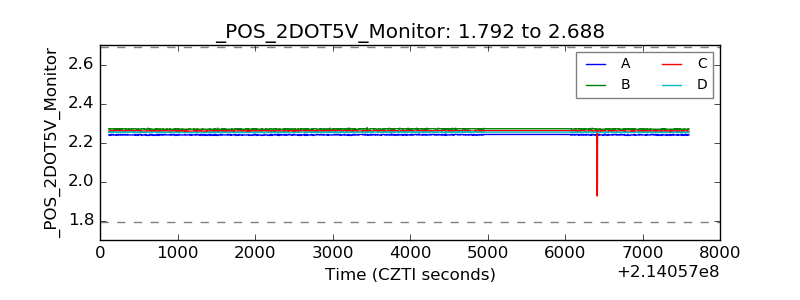 |
| +5 Volts monitor | 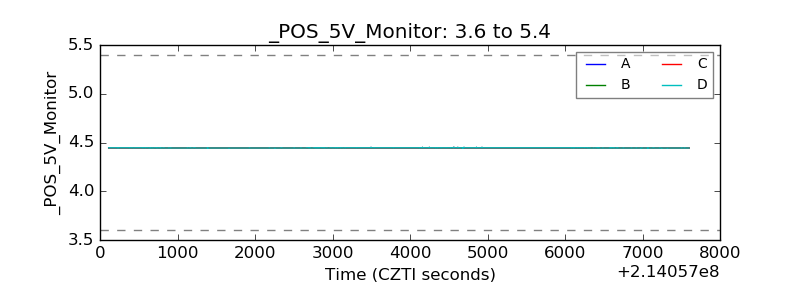 |
| _ROLL_ROT | 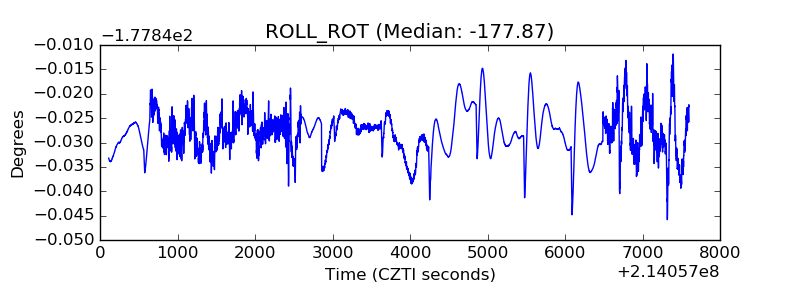 |
| _Roll_DEC | 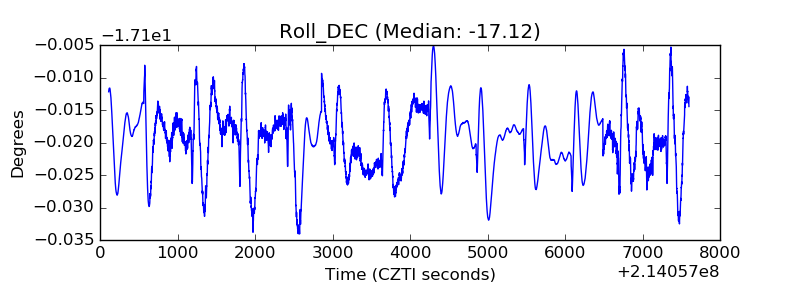 |
| _Roll_RA | 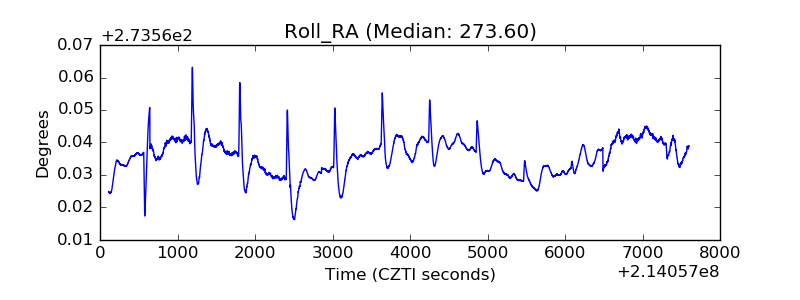 |
| Veto Counter | 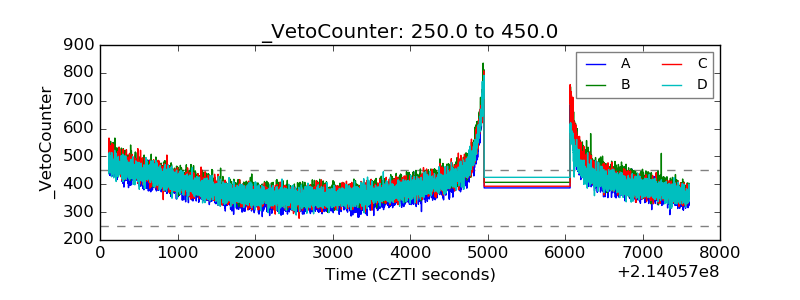 |