| Param | Original file | Final file |
|---|---|---|
| Filename | modeM0/AS1G06_032T02_9000000730_05649cztM0_level2.evt | modeM0/AS1G06_032T02_9000000730_05649cztM0_level2_quad_clean.evt |
| Size (bytes) | 603,066,240 | 98,035,200 |
| Size | 575.1 MB | 93.5 MB |
| Events in quadrant A | 3,789,296 | 618,115 |
| Events in quadrant B | 5,654,355 | 591,006 |
| Events in quadrant C | 4,079,726 | 616,314 |
| Events in quadrant D | 4,198,741 | 587,884 |
| Mode SS | |||
|---|---|---|---|
| Quadrant | BADHDUFLAG | Total packets | Discarded packets |
| A | 0 | 162 | 0 |
| B | 0 | 162 | 0 |
| C | 0 | 162 | 0 |
| D | 0 | 162 | 0 |
| Mode M0 | |||
|---|---|---|---|
| Quadrant | BADHDUFLAG | Total packets | Discarded packets |
| A | 0 | 16874 | 5 |
| B | 0 | 22251 | 7 |
| C | 0 | 17532 | 2 |
| D | 0 | 18083 | 2 |
| Mode M9 | |||
|---|---|---|---|
| Quadrant | BADHDUFLAG | Total packets | Discarded packets |
| A | 0 | 5 | 0 |
| B | 0 | 5 | 0 |
| C | 0 | 5 | 0 |
| D | 0 | 5 | 0 |
| Quadrant | Total seconds | Saturated seconds | Saturation percentage |
|---|---|---|---|
| A | 7995 | 106 | 1.325829% |
| B | 7994 | 522 | 6.529897% |
| C | 7996 | 67 | 0.837919% |
| D | 7996 | 110 | 1.375688% |
Noise dominated data is calculated using 1-second bins in cleaned event files. If a bin has >2000 counts, and if more than 50% of those come from <1% of pixels, then it is considered to be noise-dominated and hence unusable.
| Quadrant | # 1 sec bins | Bins with >0 counts | Bins with >2000 counts | High rate bins dominated by noise | Noise dominated (total time) | Noise dominated (detector-on time) | Marked lightcurve |
|---|---|---|---|---|---|---|---|
| A | 8421 | 7999 | 14 | 14 | 0.17% | 0.18% | 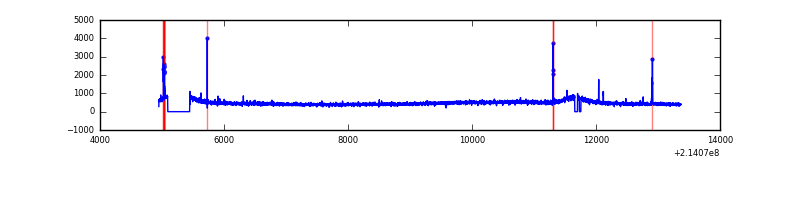 |
| B | 8421 | 7999 | 242 | 242 | 2.87% | 3.03% | 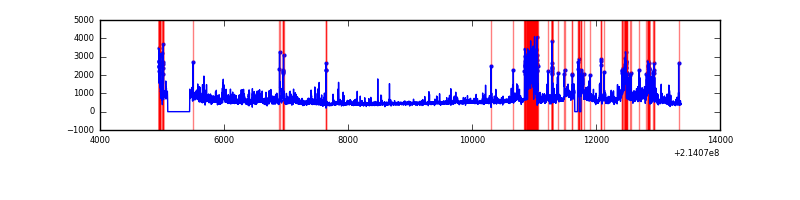 |
| C | 8421 | 7999 | 9 | 9 | 0.11% | 0.11% | 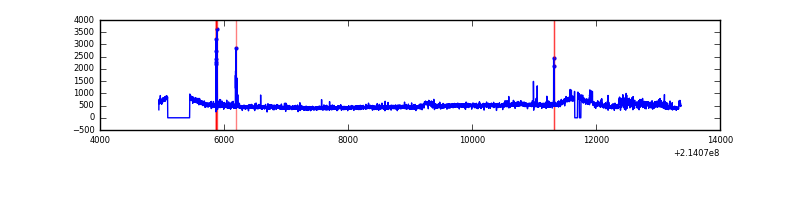 |
| D | 8421 | 7999 | 24 | 24 | 0.29% | 0.30% | 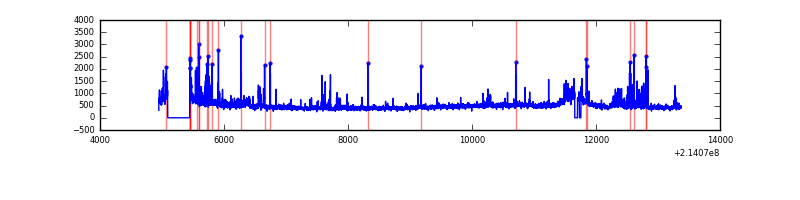 |
Top three noisy pixels from each quadrant. If the there are fewer than three noisy pixels in the level2.evt file, extra rows are filled as -1
| Pixel properties | Quadrant properties | ||||||
|---|---|---|---|---|---|---|---|
| Quadrant | DetID | PixID | Counts | Sigma | Mean | Median | Sigma |
| A | 0 | 50 | 63431 | 314.72 | 958 | 934 | 198.6 |
| A | 13 | 6 | 23088 | 111.56 | 958 | 934 | 198.6 |
| A | 12 | 194 | 9633 | 43.81 | 958 | 934 | 198.6 |
| B | 10 | 16 | 981885 | 5322.58 | 947 | 923 | 184.3 |
| B | 15 | 204 | 465361 | 2519.98 | 947 | 923 | 184.3 |
| B | 5 | 172 | 196219 | 1059.65 | 947 | 923 | 184.3 |
| C | 1 | 16 | 377512 | 1743.5 | 927 | 929 | 216.0 |
| C | 5 | 250 | 41672 | 188.63 | 927 | 929 | 216.0 |
| C | 8 | 128 | 12734 | 54.65 | 927 | 929 | 216.0 |
| D | 2 | 136 | 234821 | 1028.65 | 925 | 895 | 227.4 |
| D | 8 | 195 | 143290 | 626.16 | 925 | 895 | 227.4 |
| D | 12 | 233 | 133550 | 583.33 | 925 | 895 | 227.4 |
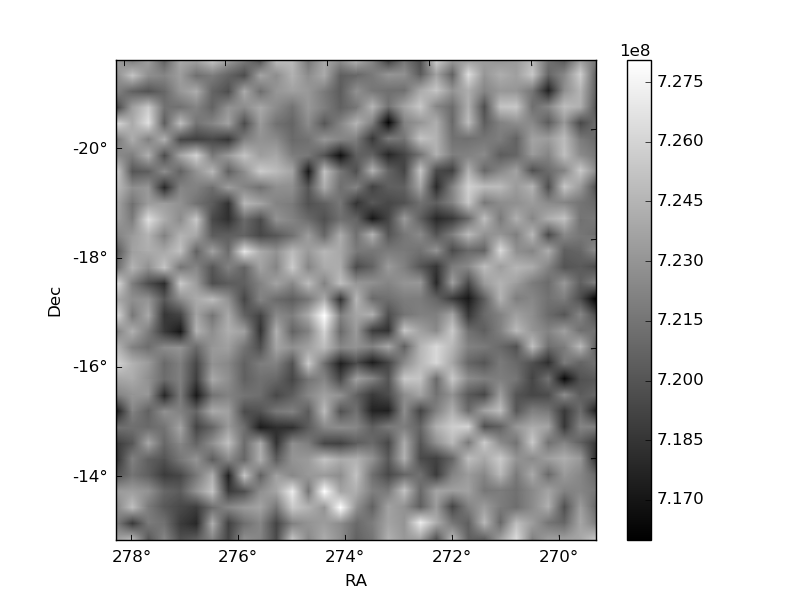
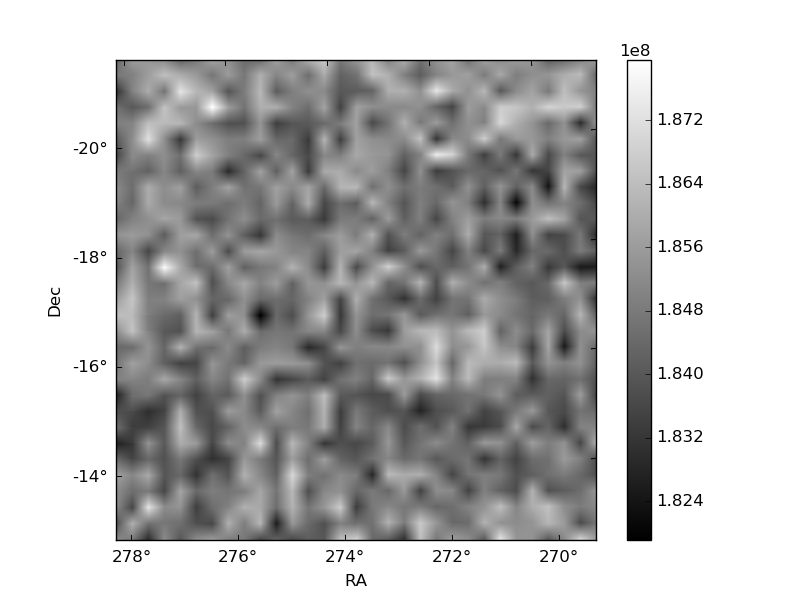
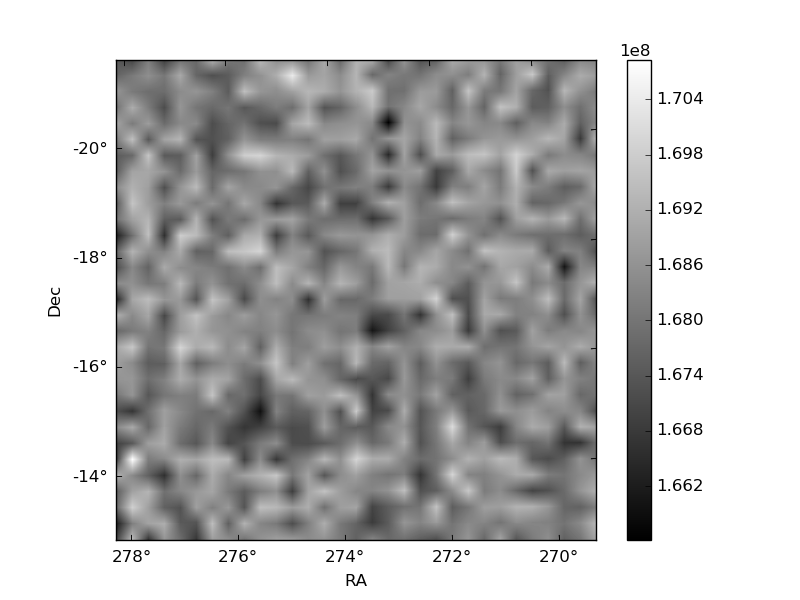
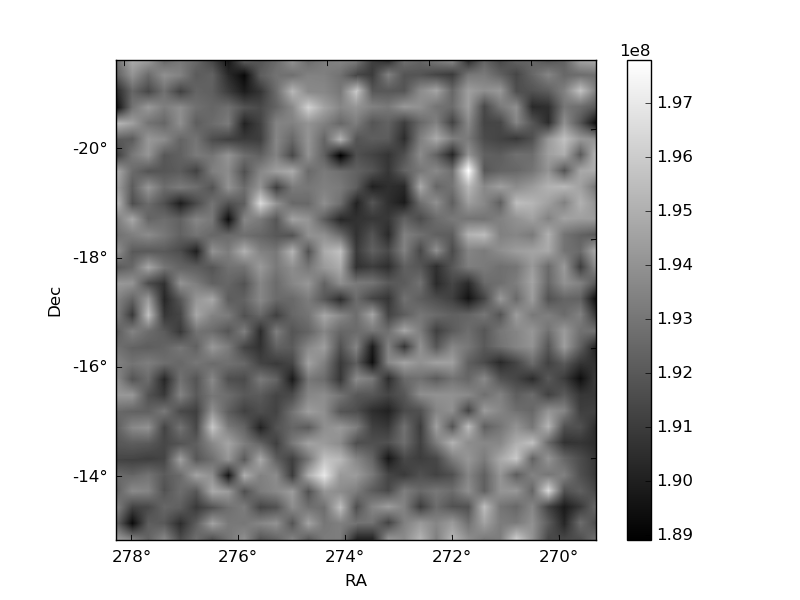
Histogram calculated using DETX and DETY for each event in the final _common_clean file
| Quadrant A | 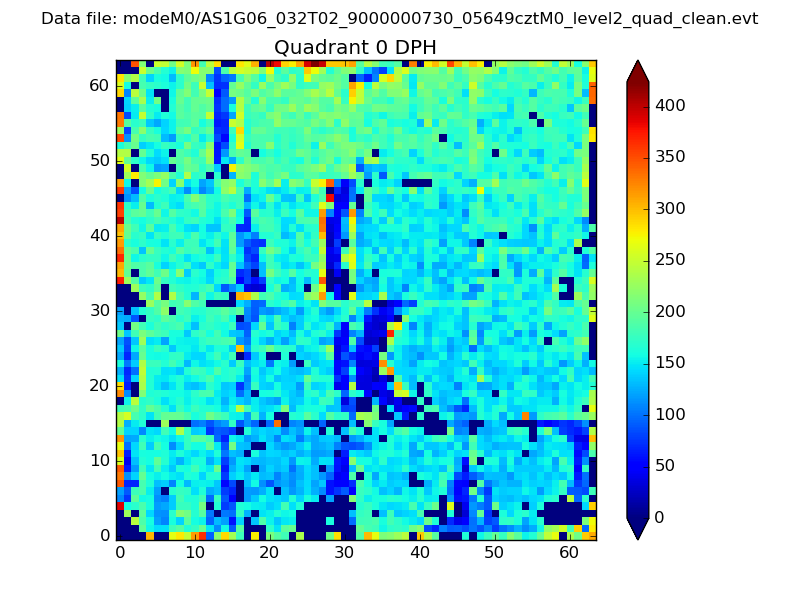 |
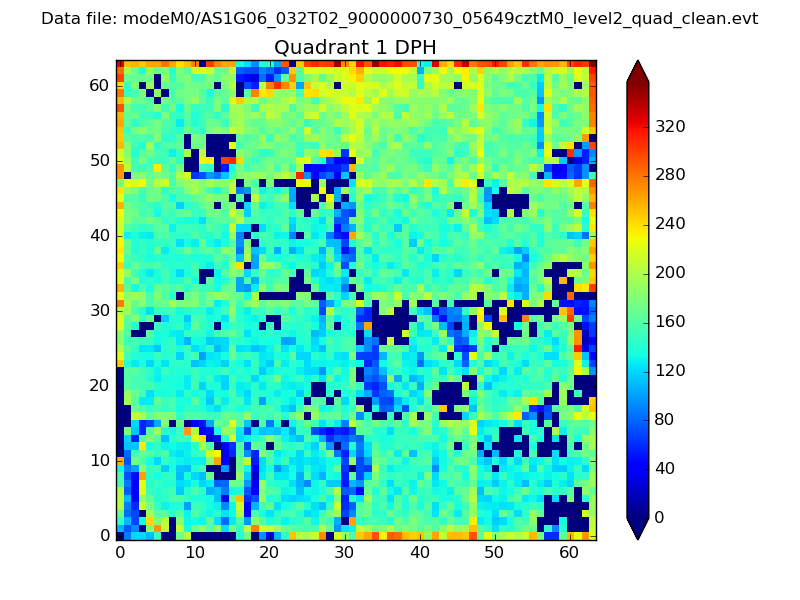 |
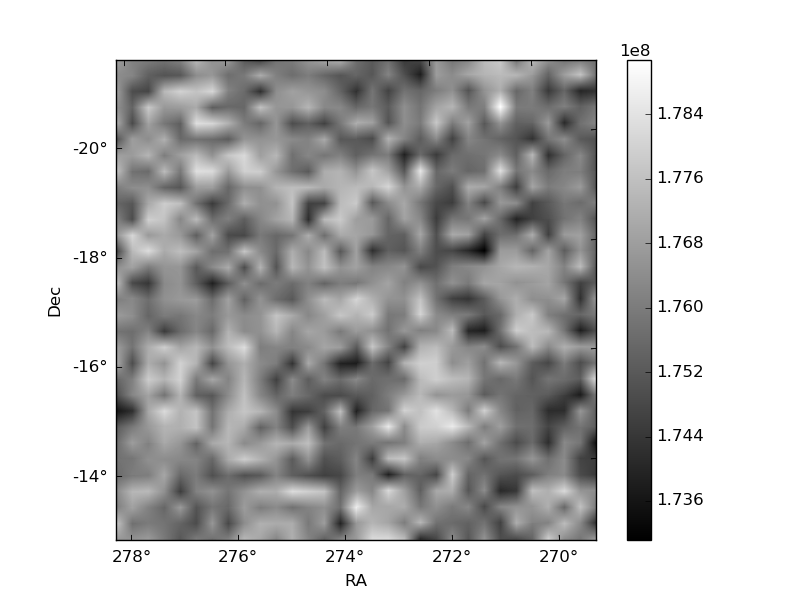
Quadrant B |
|---|---|---|---|
| Quadrant D | 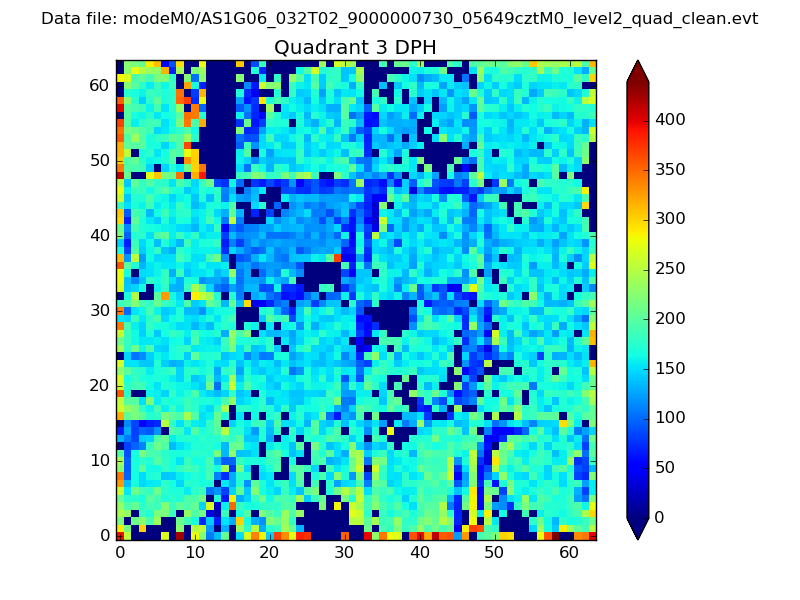 |
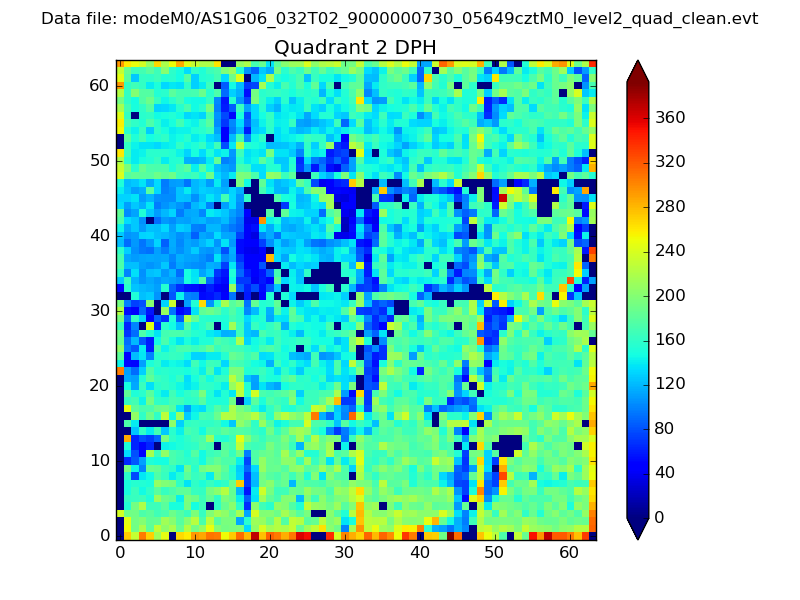 |
Quadrant C |
| Plot type | Count rate plots | Images |
|---|---|---|
| Comparison with Poisson distribution Blue bars denote a histogram of data divided into 1 sec bins. Red curve is a Poisson curve with rate = median count rate of data. |
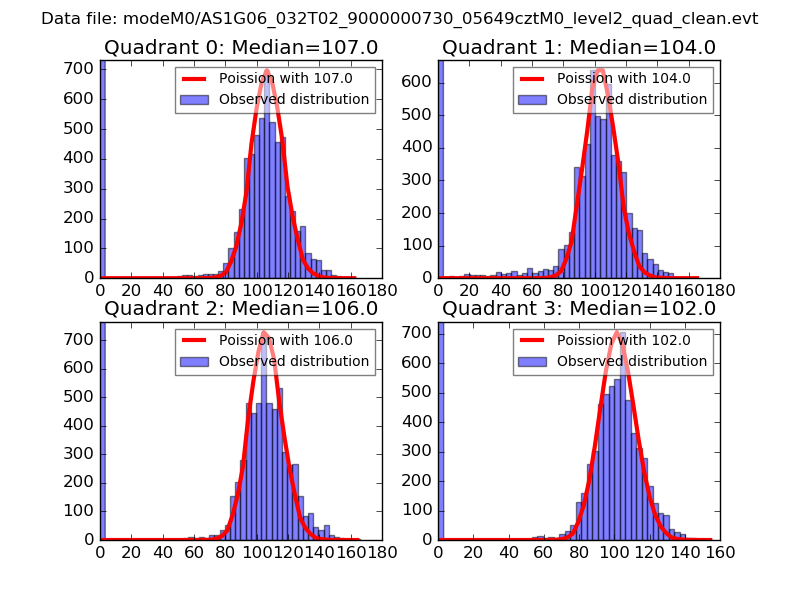 |
 |
| Quadrant-wise count rates Data is divided into 100 sec bins |
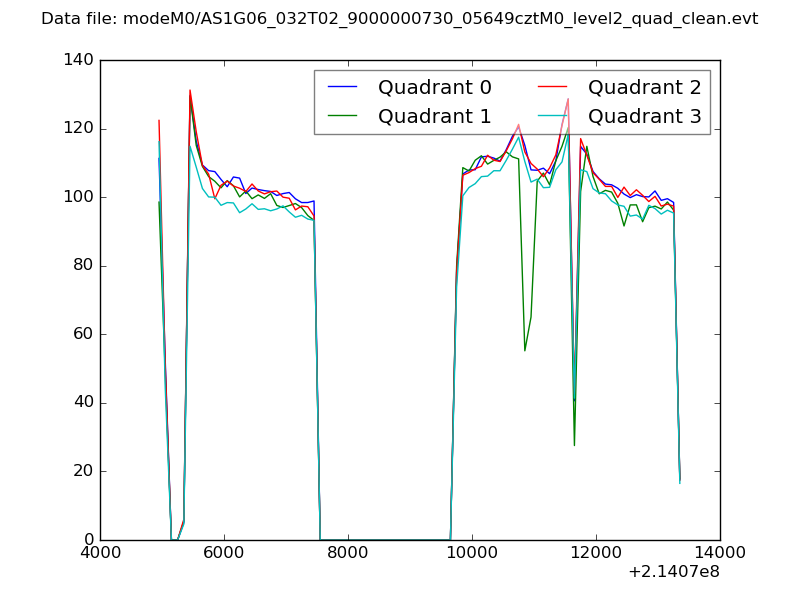 |
|
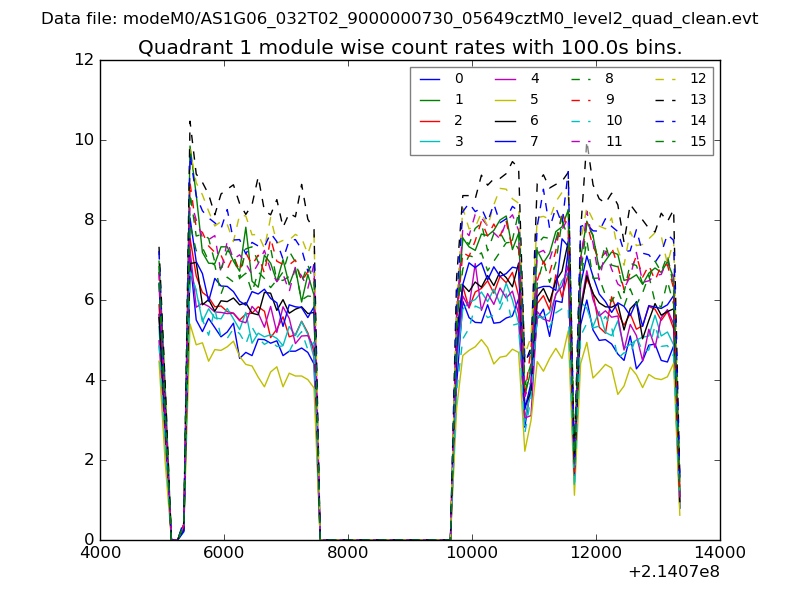
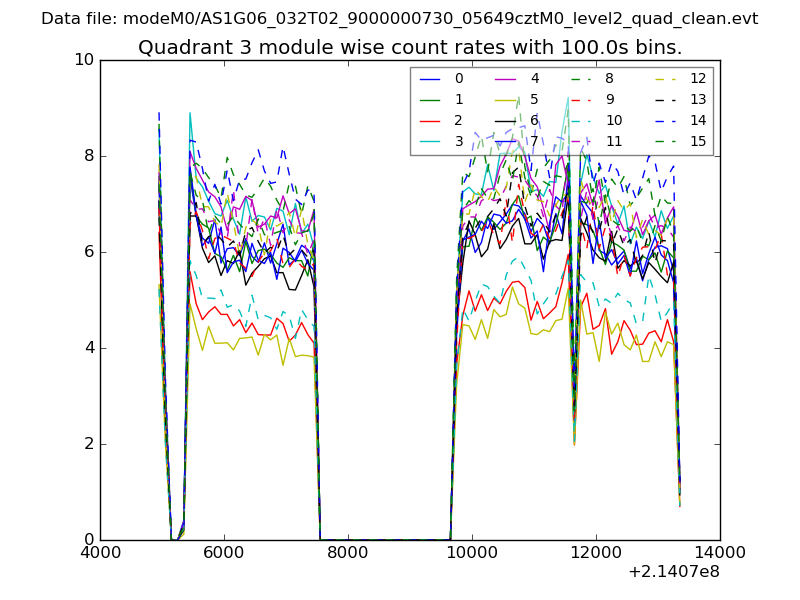
| Module-wise count rates for Quadrant A Data is divided into 100 sec bins |
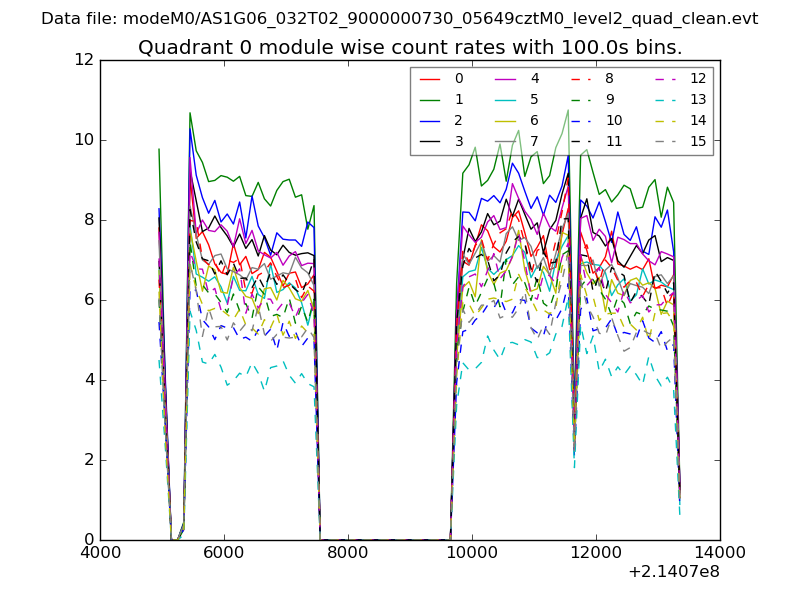 |
 |
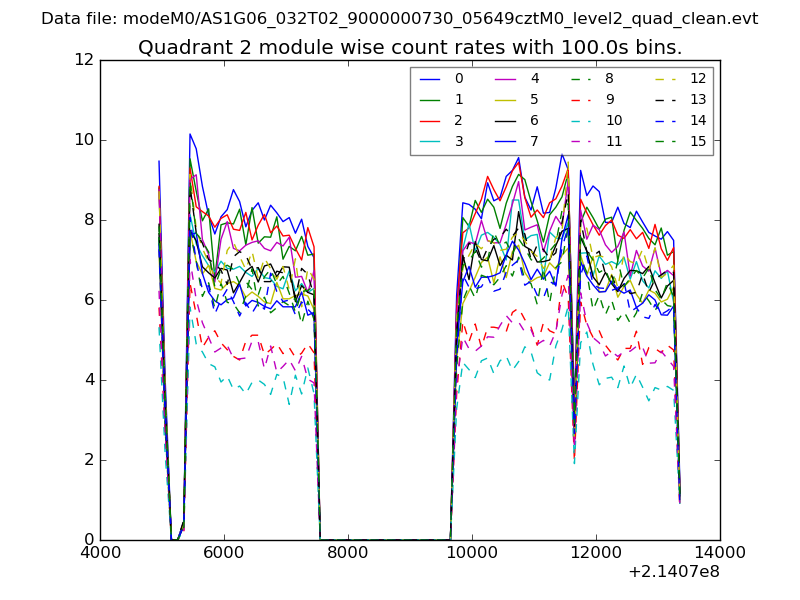
| Module-wise count rates for Quadrant B Data is divided into 100 sec bins |
 |
 |
| Module-wise count rates for Quadrant C Data is divided into 100 sec bins |
 |
 |
| Module-wise count rates for Quadrant D Data is divided into 100 sec bins |
 |
 |
| Parameter | Plot |
|---|---|
| CZT HV Monitor | 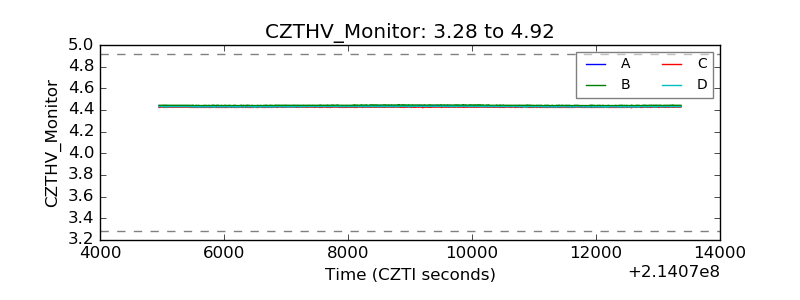 |
| D_VDD | 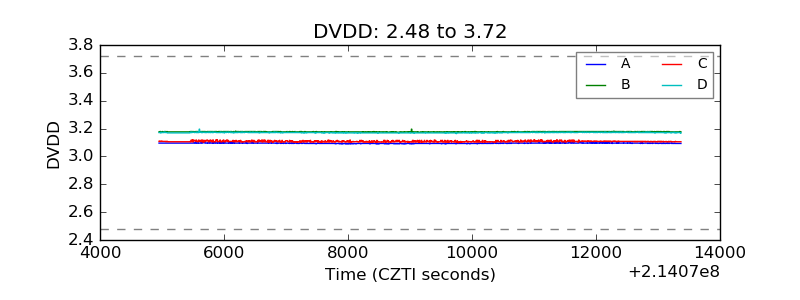 |
| Temperature 1 | 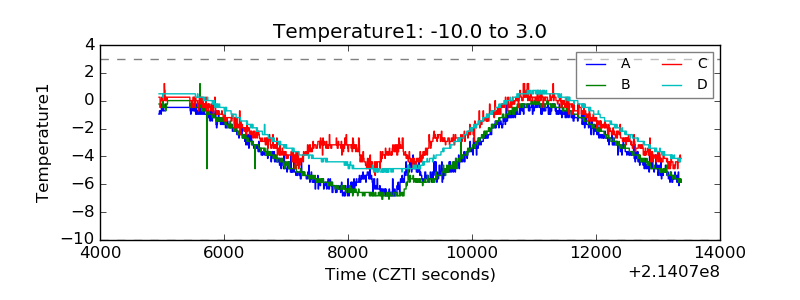 |
| Veto HV Monitor | 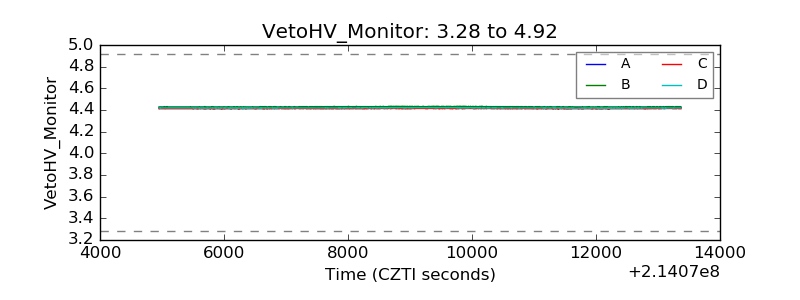 |
| Veto LLD | 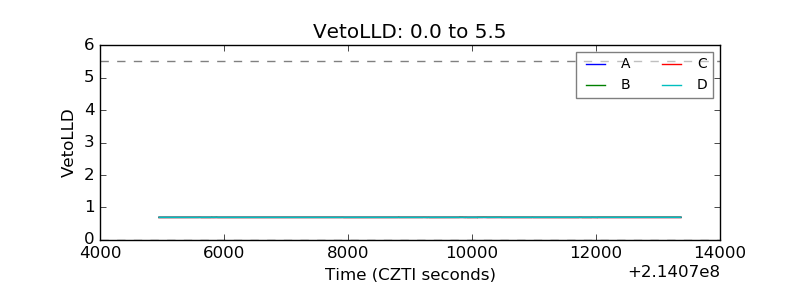 |
| Alpha Counter | 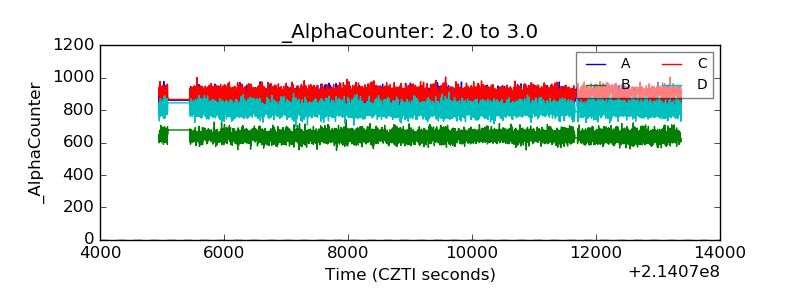 |
| _CPM_Rate | 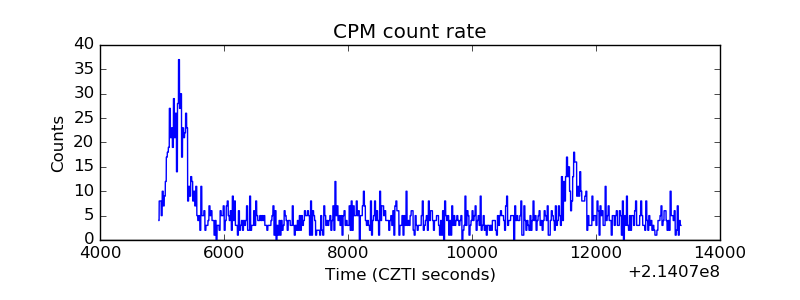 |
| CZT Counter |  |
| +2.5 Volts monitor | 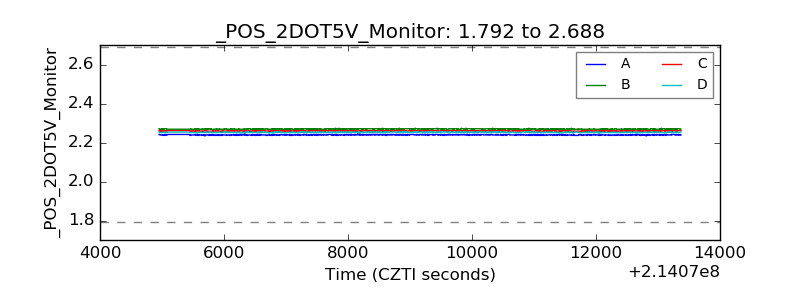 |
| +5 Volts monitor | 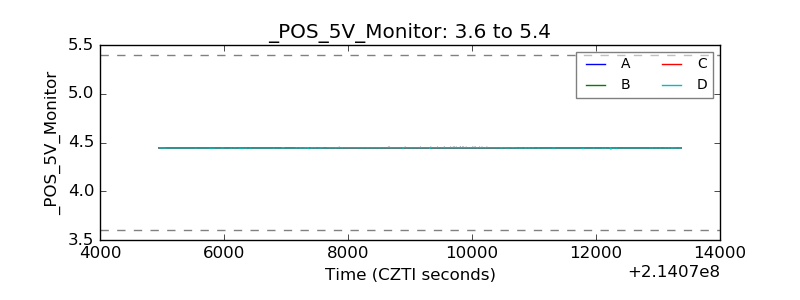 |
| _ROLL_ROT | 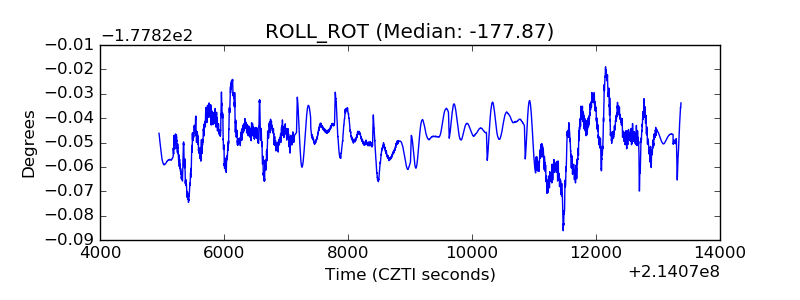 |
| _Roll_DEC | 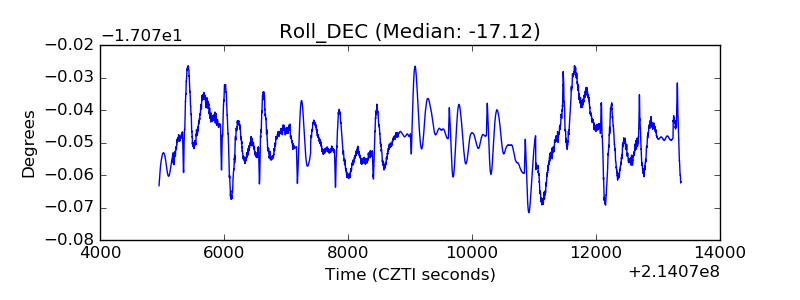 |
| _Roll_RA | 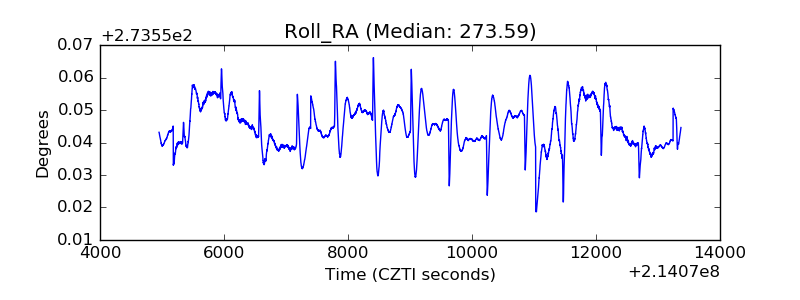 |
| Veto Counter | 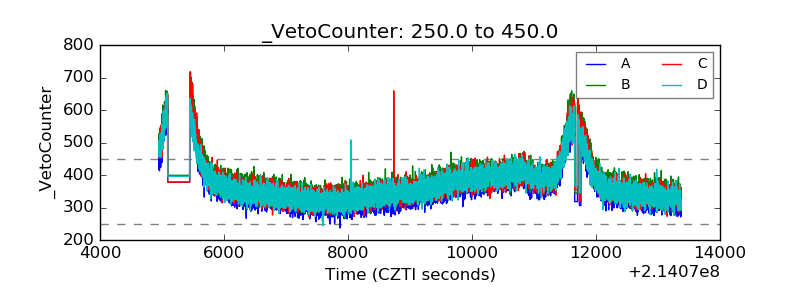 |