| Param | Original file | Final file |
|---|---|---|
| Filename | modeM0/AS1G06_032T02_9000000730_05650cztM0_level2.evt | modeM0/AS1G06_032T02_9000000730_05650cztM0_level2_quad_clean.evt |
| Size (bytes) | 581,785,920 | 86,184,000 |
| Size | 554.8 MB | 82.2 MB |
| Events in quadrant A | 3,489,187 | 531,845 |
| Events in quadrant B | 5,079,417 | 516,506 |
| Events in quadrant C | 3,968,586 | 527,680 |
| Events in quadrant D | 4,567,823 | 505,765 |
| Mode SS | |||
|---|---|---|---|
| Quadrant | BADHDUFLAG | Total packets | Discarded packets |
| A | 0 | 156 | 0 |
| B | 0 | 156 | 0 |
| C | 0 | 156 | 0 |
| D | 0 | 156 | 2 |
| Mode M0 | |||
|---|---|---|---|
| Quadrant | BADHDUFLAG | Total packets | Discarded packets |
| A | 0 | 15836 | 132 |
| B | 0 | 20423 | 155 |
| C | 0 | 16883 | 118 |
| D | 0 | 19051 | 198 |
| Mode M9 | |||
|---|---|---|---|
| Quadrant | BADHDUFLAG | Total packets | Discarded packets |
| A | 0 | 2 | 0 |
| B | 0 | 2 | 0 |
| C | 0 | 2 | 0 |
| D | 0 | 2 | 0 |
| Quadrant | Total seconds | Saturated seconds | Saturation percentage |
|---|---|---|---|
| A | 7582 | 92 | 1.213400% |
| B | 7573 | 339 | 4.476429% |
| C | 7590 | 85 | 1.119895% |
| D | 7574 | 161 | 2.125693% |
Noise dominated data is calculated using 1-second bins in cleaned event files. If a bin has >2000 counts, and if more than 50% of those come from <1% of pixels, then it is considered to be noise-dominated and hence unusable.
| Quadrant | # 1 sec bins | Bins with >0 counts | Bins with >2000 counts | High rate bins dominated by noise | Noise dominated (total time) | Noise dominated (detector-on time) | Marked lightcurve |
|---|---|---|---|---|---|---|---|
| A | 7828 | 7626 | 2 | 2 | 0.03% | 0.03% |  |
| B | 7828 | 7623 | 134 | 134 | 1.71% | 1.76% | 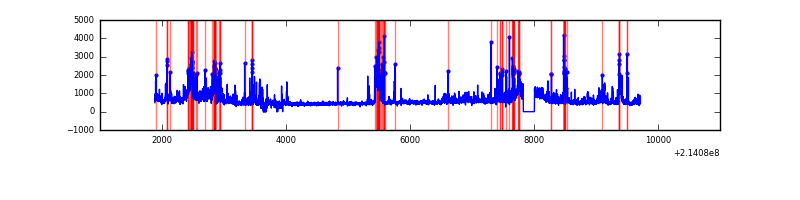 |
| C | 7828 | 7631 | 12 | 12 | 0.15% | 0.16% | 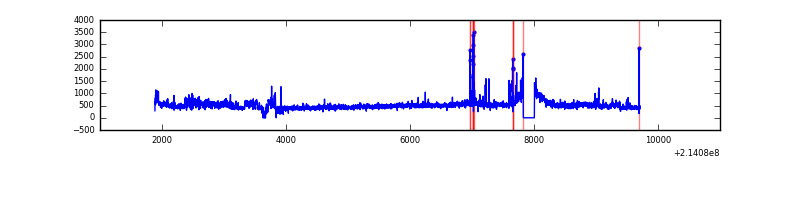 |
| D | 7828 | 7618 | 27 | 27 | 0.34% | 0.35% |  |
Top three noisy pixels from each quadrant. If the there are fewer than three noisy pixels in the level2.evt file, extra rows are filled as -1
| Pixel properties | Quadrant properties | ||||||
|---|---|---|---|---|---|---|---|
| Quadrant | DetID | PixID | Counts | Sigma | Mean | Median | Sigma |
| A | 0 | 50 | 25096 | 132.08 | 889 | 870 | 183.4 |
| A | 7 | 16 | 12231 | 61.94 | 889 | 870 | 183.4 |
| A | 0 | 254 | 11809 | 59.64 | 889 | 870 | 183.4 |
| B | 10 | 16 | 964908 | 5628.55 | 887 | 864 | 171.3 |
| B | 15 | 204 | 372047 | 2167.14 | 887 | 864 | 171.3 |
| B | 4 | 48 | 128366 | 744.42 | 887 | 864 | 171.3 |
| C | 1 | 16 | 525551 | 2603.72 | 858 | 860 | 201.5 |
| C | 5 | 250 | 69295 | 339.6 | 858 | 860 | 201.5 |
| C | 5 | 233 | 10826 | 49.45 | 858 | 860 | 201.5 |
| D | 1 | 20 | 780781 | 3707.45 | 854 | 827 | 210.4 |
| D | 2 | 136 | 221428 | 1048.61 | 854 | 827 | 210.4 |
| D | 8 | 195 | 131066 | 619.08 | 854 | 827 | 210.4 |
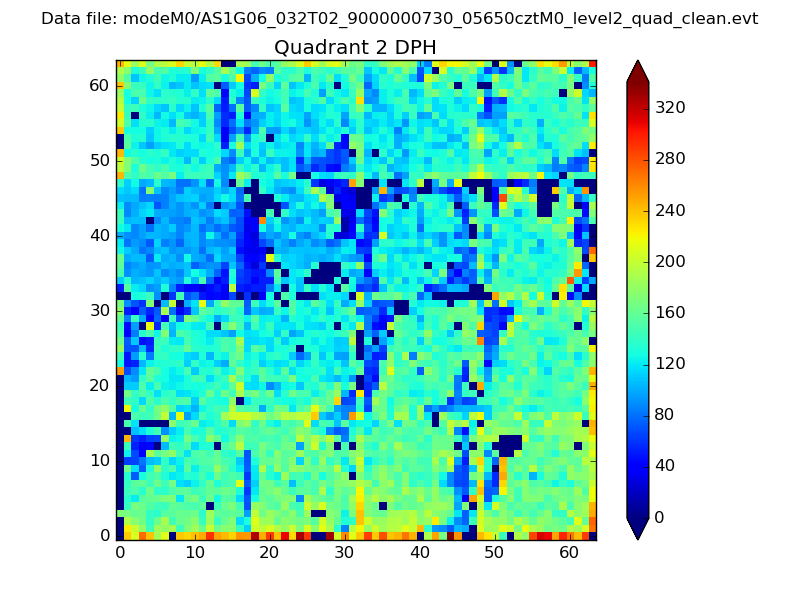
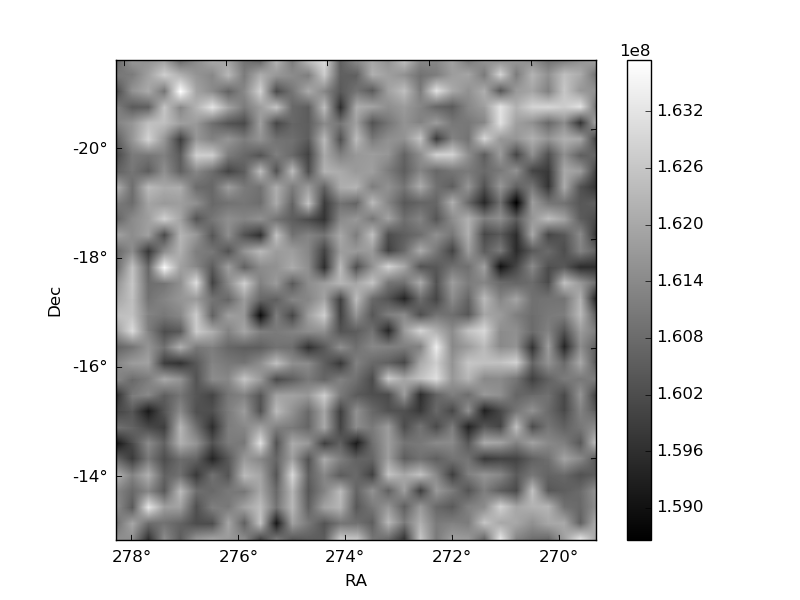
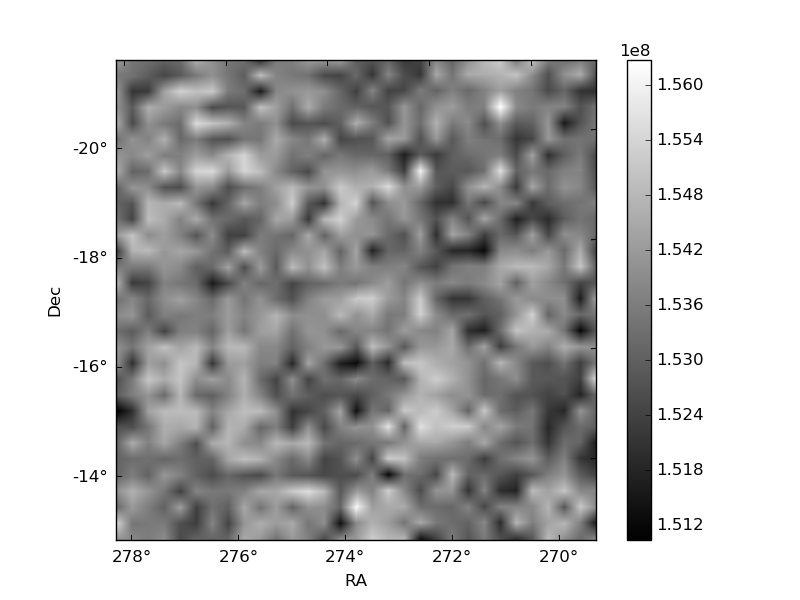
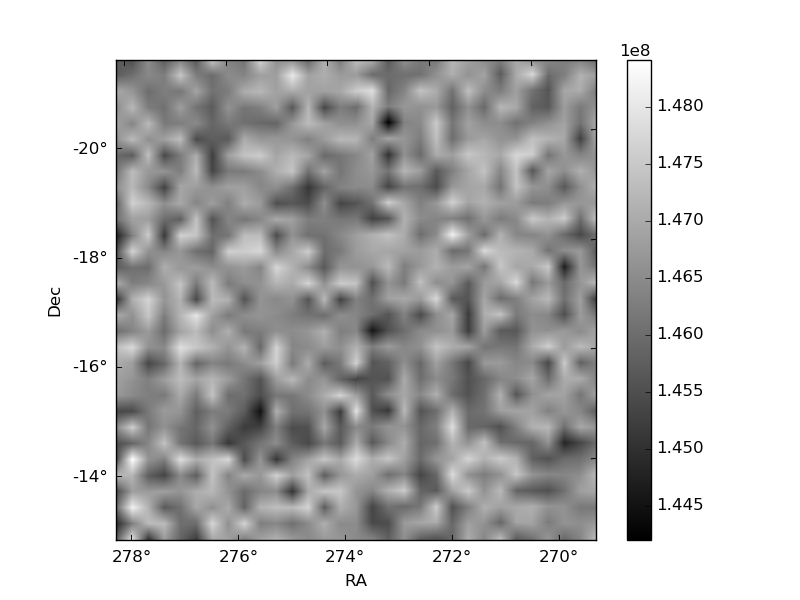
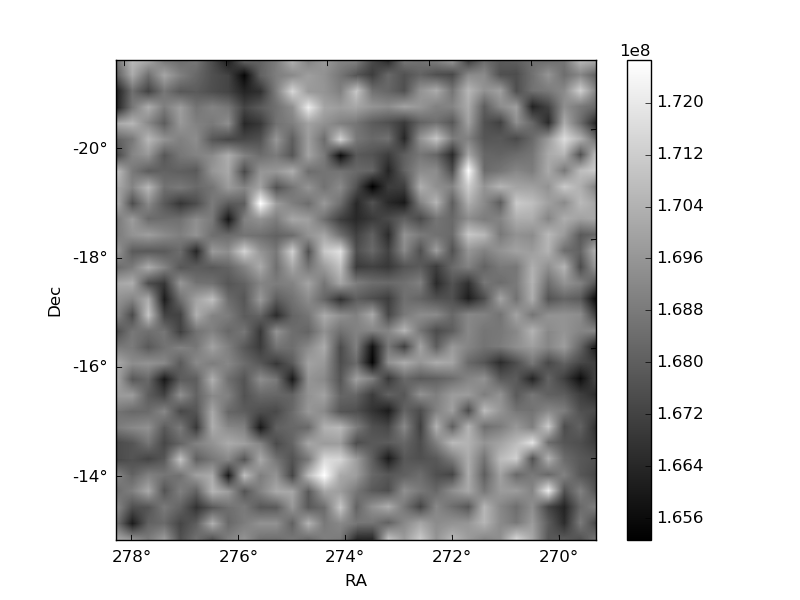
Histogram calculated using DETX and DETY for each event in the final _common_clean file
| Quadrant A | 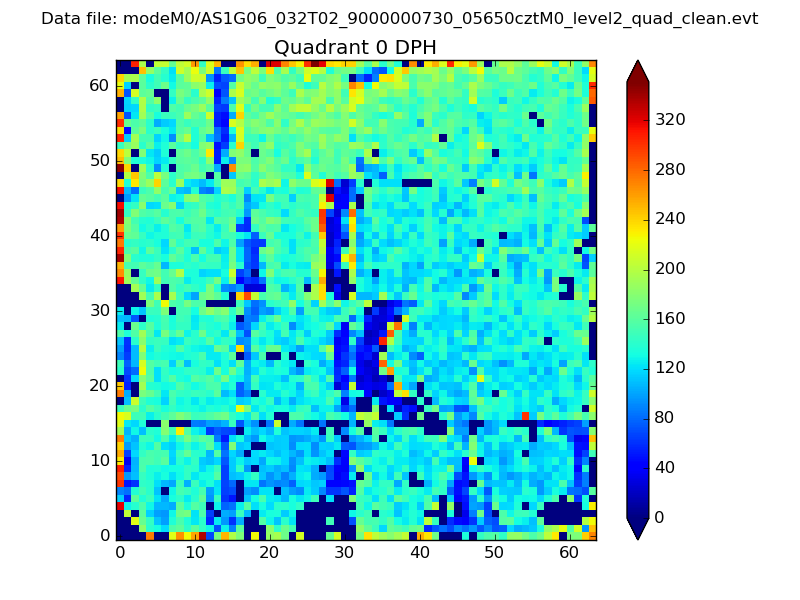 |
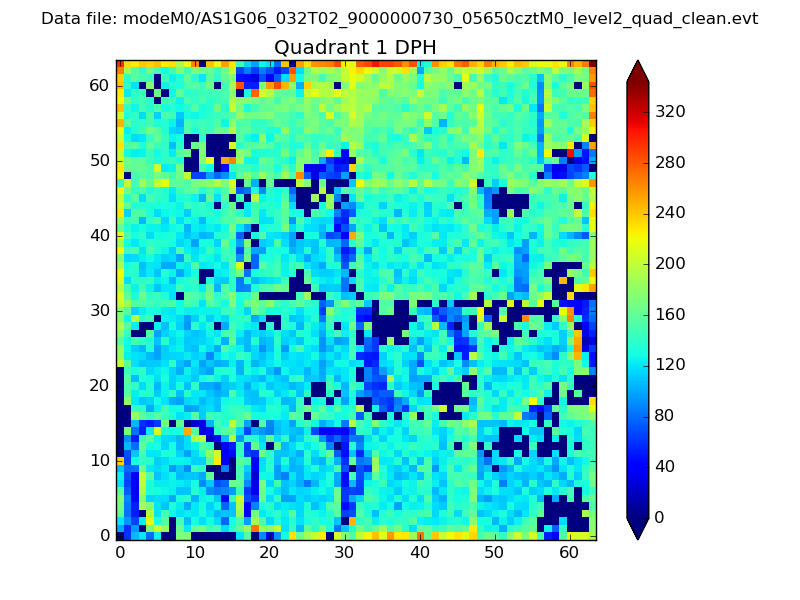 |
Quadrant B |
|---|---|---|---|
| Quadrant D | 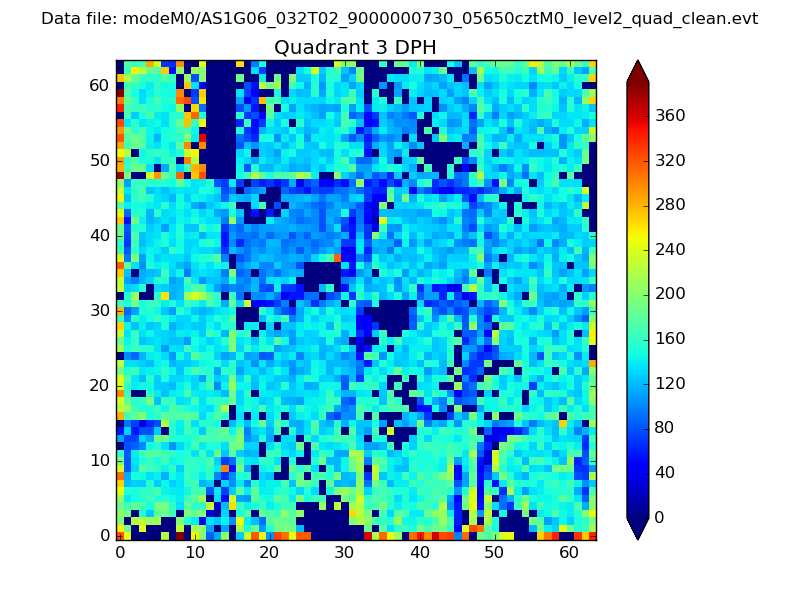 |
 |
Quadrant C |
| Plot type | Count rate plots | Images |
|---|---|---|
| Comparison with Poisson distribution Blue bars denote a histogram of data divided into 1 sec bins. Red curve is a Poisson curve with rate = median count rate of data. |
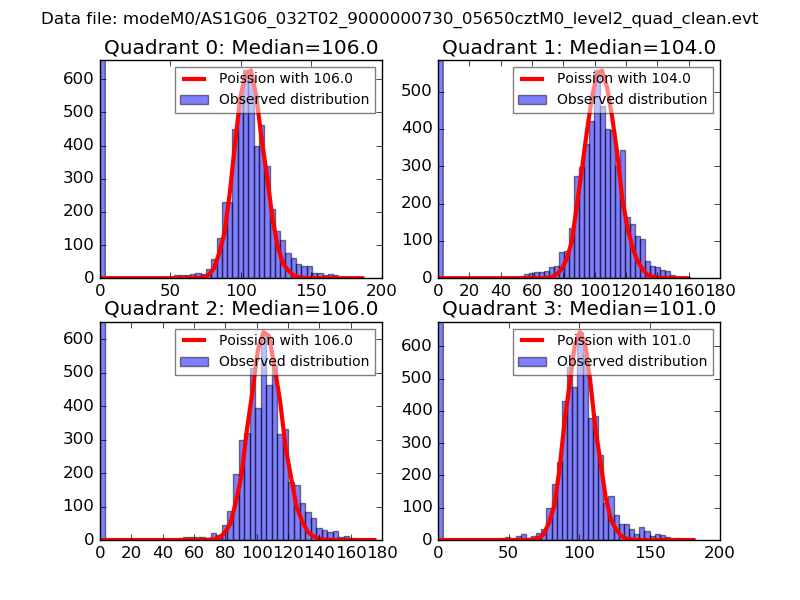 |
 |
| Quadrant-wise count rates Data is divided into 100 sec bins |
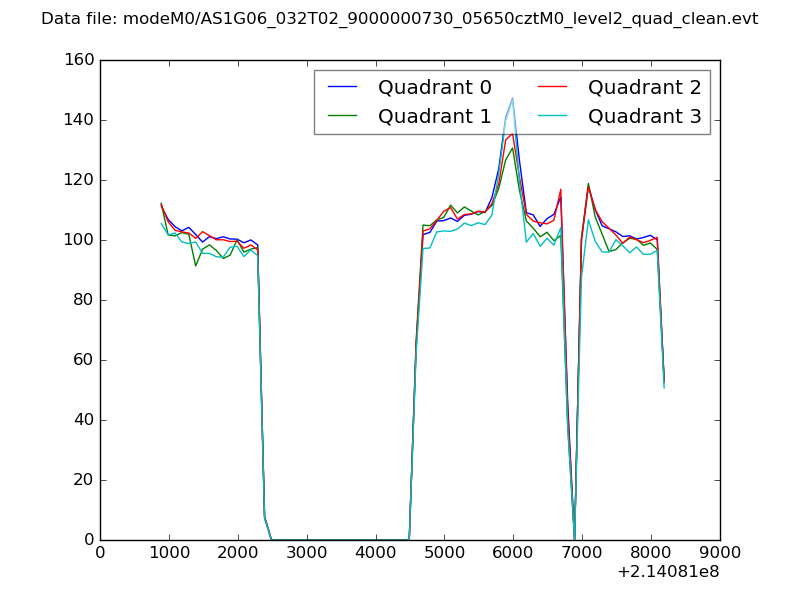 |
|
| Module-wise count rates for Quadrant A Data is divided into 100 sec bins |
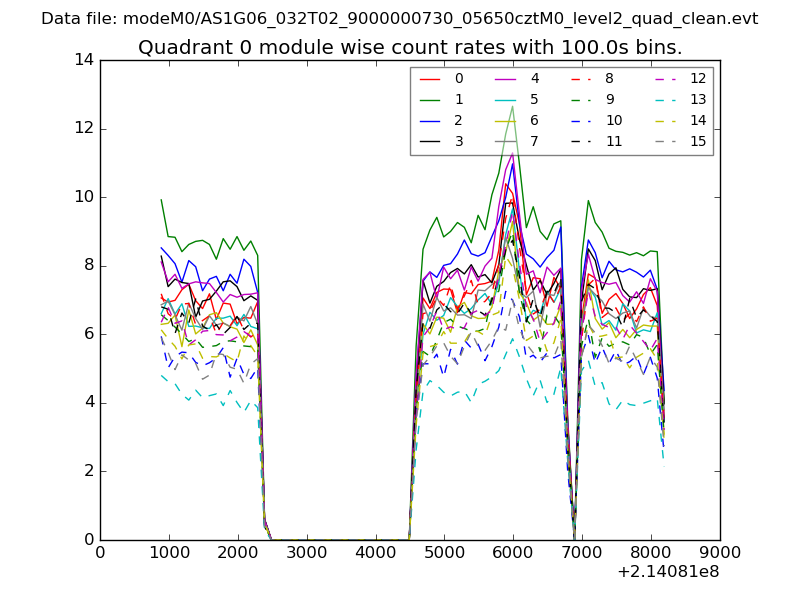 |
 |
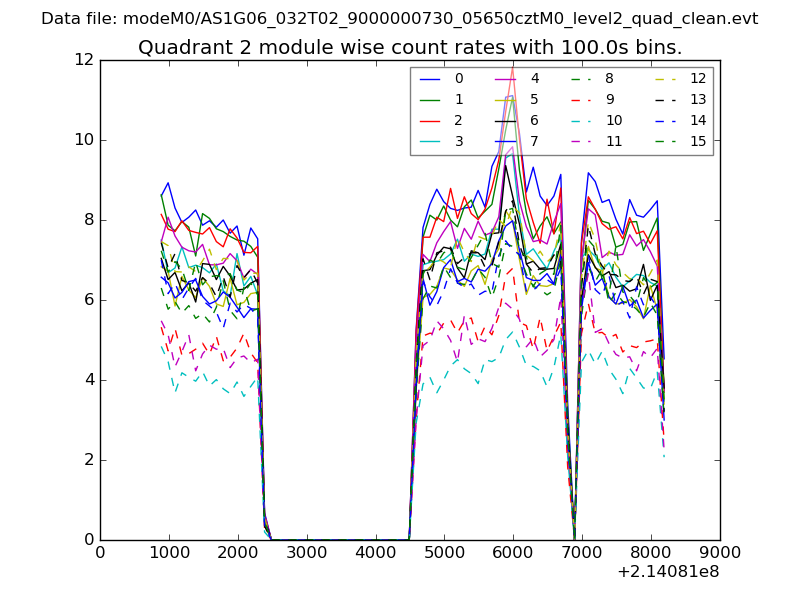
| Module-wise count rates for Quadrant B Data is divided into 100 sec bins |
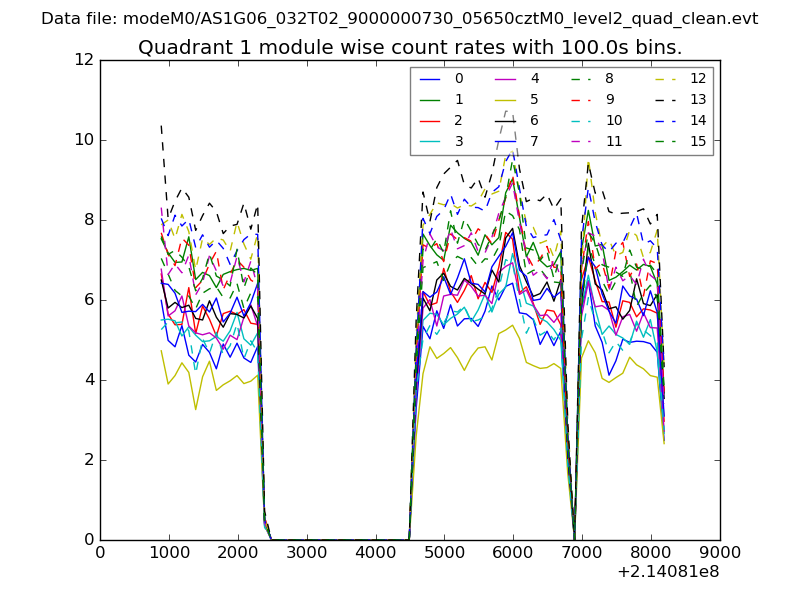 |
 |
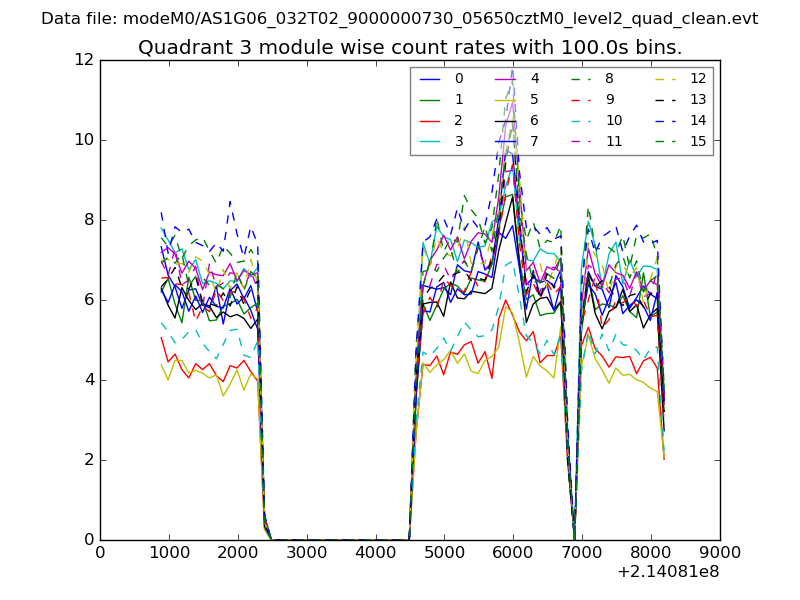
| Module-wise count rates for Quadrant C Data is divided into 100 sec bins |
 |
 |
| Module-wise count rates for Quadrant D Data is divided into 100 sec bins |
 |
 |
| Parameter | Plot |
|---|---|
| CZT HV Monitor | 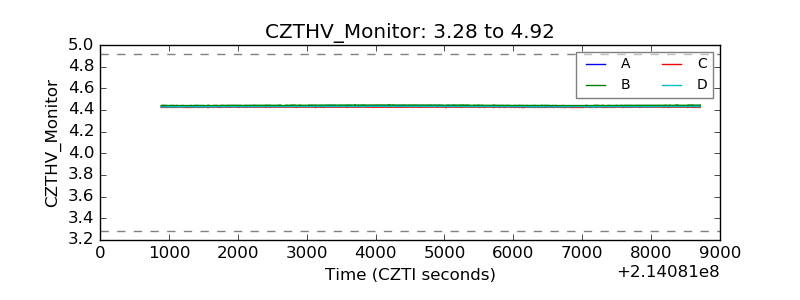 |
| D_VDD | 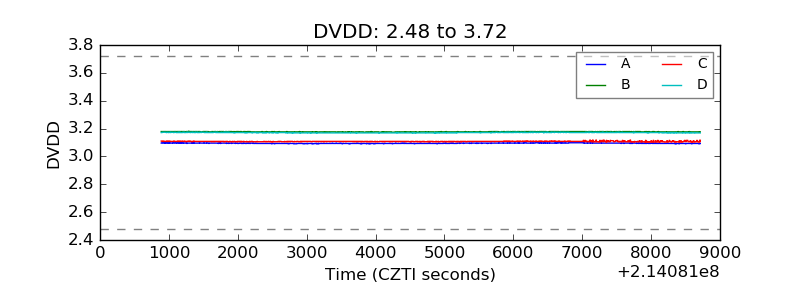 |
| Temperature 1 | 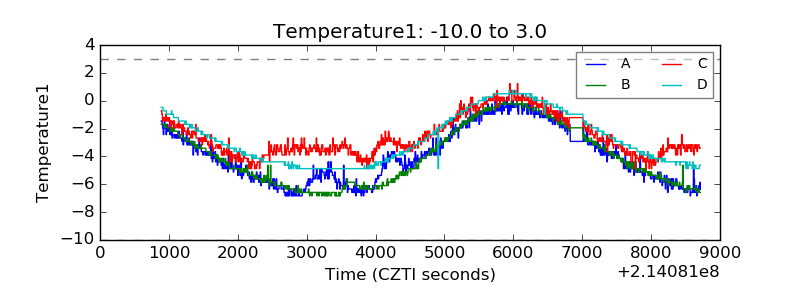 |
| Veto HV Monitor | 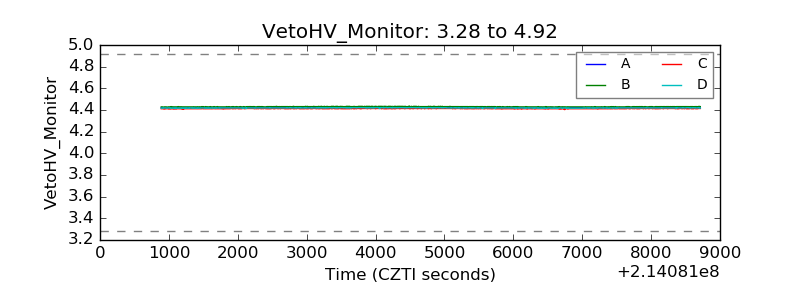 |
| Veto LLD | 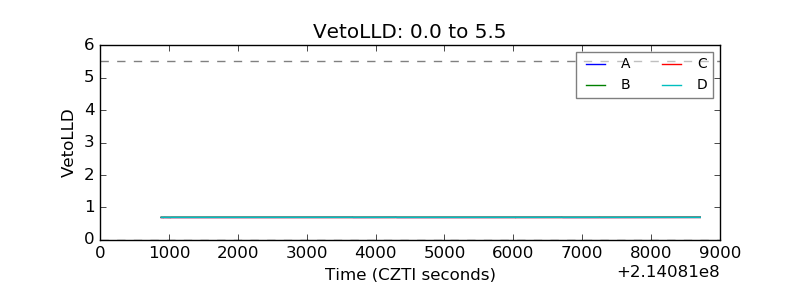 |
| Alpha Counter | 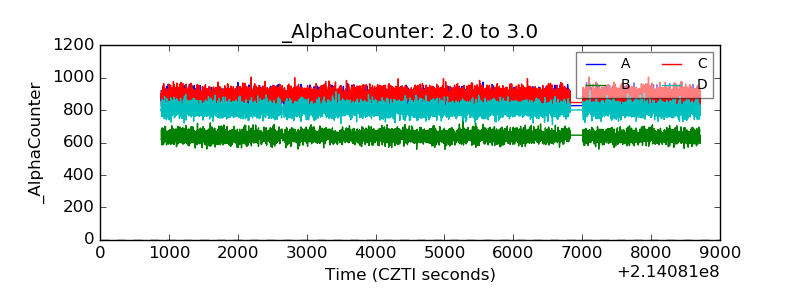 |
| _CPM_Rate | 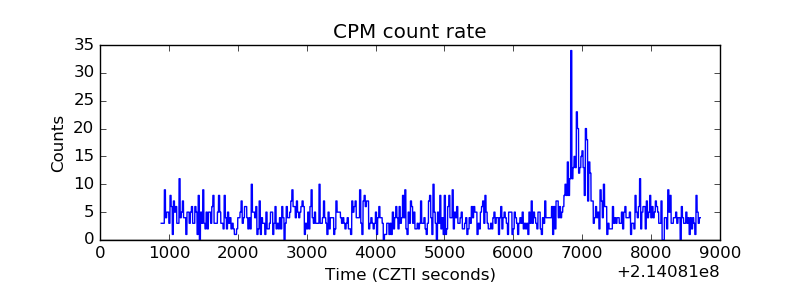 |
| CZT Counter | 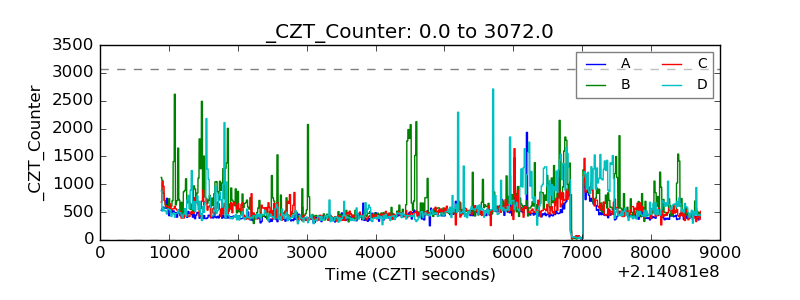 |
| +2.5 Volts monitor |  |
| +5 Volts monitor |  |
| _ROLL_ROT | 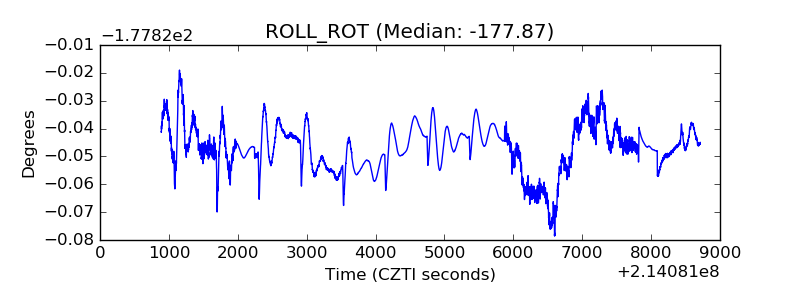 |
| _Roll_DEC | 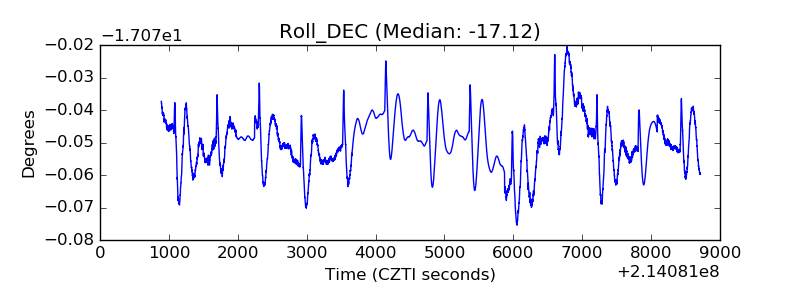 |
| _Roll_RA | 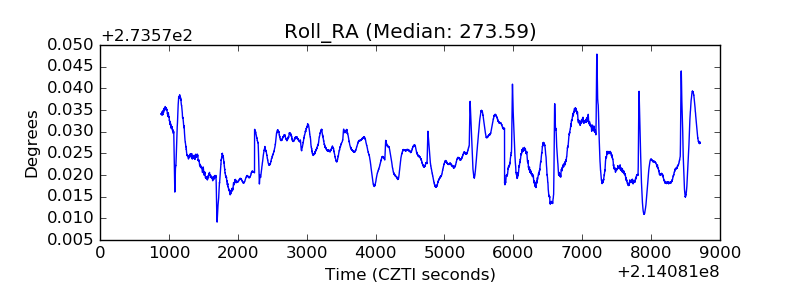 |
| Veto Counter | 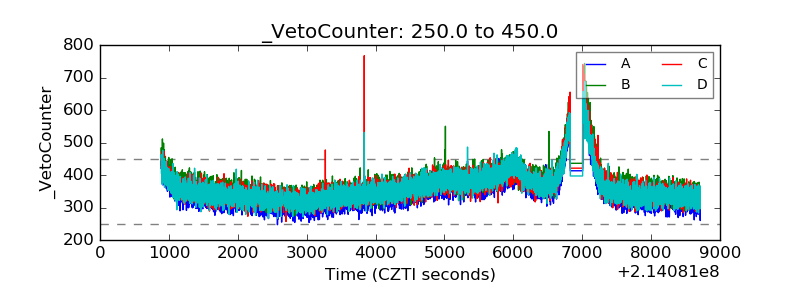 |