| Param | Original file | Final file |
|---|---|---|
| Filename | modeM0/AS1G06_032T02_9000000730_05654cztM0_level2.evt | modeM0/AS1G06_032T02_9000000730_05654cztM0_level2_quad_clean.evt |
| Size (bytes) | 473,443,200 | 67,703,040 |
| Size | 451.5 MB | 64.6 MB |
| Events in quadrant A | 3,347,098 | 395,380 |
| Events in quadrant B | 3,698,938 | 388,646 |
| Events in quadrant C | 3,361,396 | 395,671 |
| Events in quadrant D | 3,458,319 | 385,694 |
| Mode SS | |||
|---|---|---|---|
| Quadrant | BADHDUFLAG | Total packets | Discarded packets |
| A | 0 | 142 | 0 |
| B | 0 | 142 | 0 |
| C | 0 | 142 | 0 |
| D | 0 | 142 | 0 |
| Mode M0 | |||
|---|---|---|---|
| Quadrant | BADHDUFLAG | Total packets | Discarded packets |
| A | 0 | 14604 | 10 |
| B | 0 | 15356 | 19 |
| C | 0 | 14713 | 6 |
| D | 0 | 15074 | 8 |
| Mode M9 | |||
|---|---|---|---|
| Quadrant | BADHDUFLAG | Total packets | Discarded packets |
| A | 0 | 18 | 0 |
| B | 0 | 18 | 0 |
| C | 0 | 18 | 0 |
| D | 0 | 18 | 0 |
| Quadrant | Total seconds | Saturated seconds | Saturation percentage |
|---|---|---|---|
| A | 6958 | 121 | 1.739005% |
| B | 6954 | 116 | 1.668105% |
| C | 6958 | 76 | 1.092268% |
| D | 6957 | 101 | 1.451775% |
Noise dominated data is calculated using 1-second bins in cleaned event files. If a bin has >2000 counts, and if more than 50% of those come from <1% of pixels, then it is considered to be noise-dominated and hence unusable.
| Quadrant | # 1 sec bins | Bins with >0 counts | Bins with >2000 counts | High rate bins dominated by noise | Noise dominated (total time) | Noise dominated (detector-on time) | Marked lightcurve |
|---|---|---|---|---|---|---|---|
| A | 8705 | 6962 | 29 | 29 | 0.33% | 0.42% | 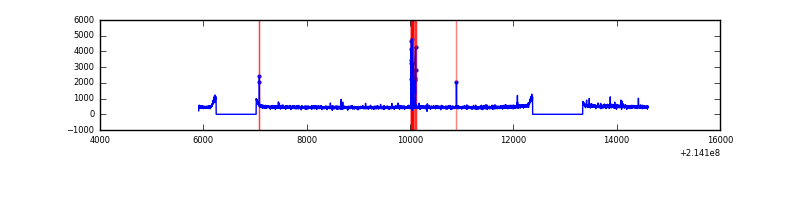 |
| B | 8705 | 6961 | 7 | 7 | 0.08% | 0.10% | 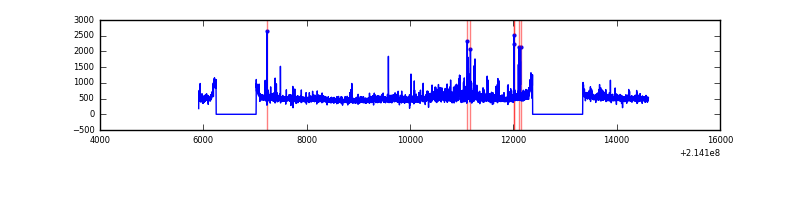 |
| C | 8705 | 6962 | 1 | 1 | 0.01% | 0.01% | 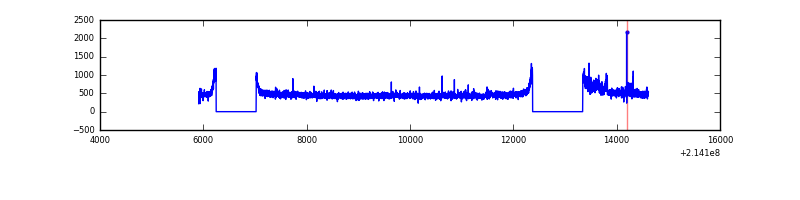 |
| D | 8705 | 6962 | 27 | 27 | 0.31% | 0.39% | 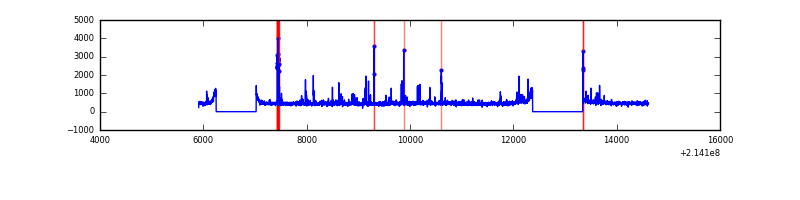 |
Top three noisy pixels from each quadrant. If the there are fewer than three noisy pixels in the level2.evt file, extra rows are filled as -1
| Pixel properties | Quadrant properties | ||||||
|---|---|---|---|---|---|---|---|
| Quadrant | DetID | PixID | Counts | Sigma | Mean | Median | Sigma |
| A | 0 | 50 | 93041 | 534.13 | 836 | 819 | 172.7 |
| A | 13 | 6 | 14788 | 80.91 | 836 | 819 | 172.7 |
| A | 0 | 254 | 9795 | 51.99 | 836 | 819 | 172.7 |
| B | 15 | 204 | 178423 | 1082.44 | 848 | 827 | 164.1 |
| B | 11 | 51 | 68254 | 410.96 | 848 | 827 | 164.1 |
| B | 0 | 214 | 67358 | 405.5 | 848 | 827 | 164.1 |
| C | 1 | 16 | 155873 | 798.78 | 817 | 821 | 194.1 |
| C | 9 | 16 | 6890 | 31.27 | 817 | 821 | 194.1 |
| C | 13 | 61 | 6597 | 29.76 | 817 | 821 | 194.1 |
| D | 2 | 152 | 123957 | 615.98 | 811 | 787 | 200.0 |
| D | 8 | 195 | 87980 | 436.05 | 811 | 787 | 200.0 |
| D | 2 | 33 | 71097 | 351.62 | 811 | 787 | 200.0 |
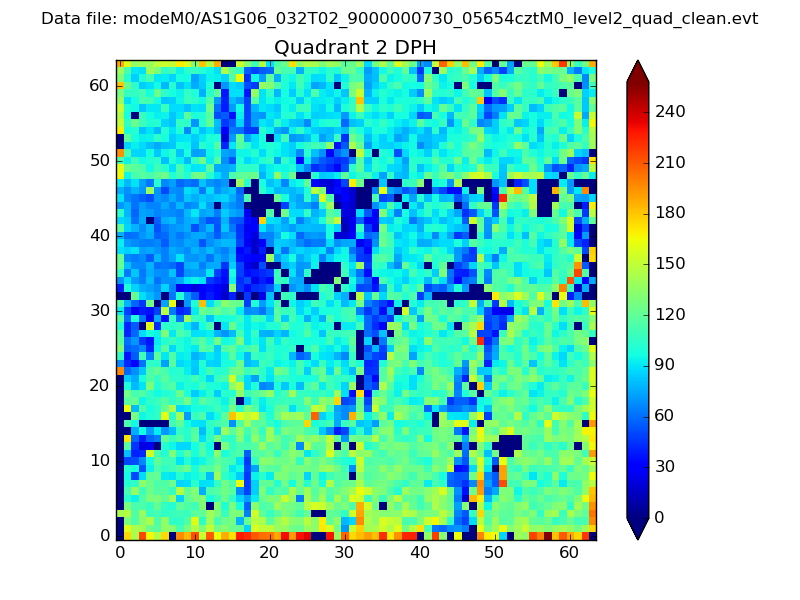
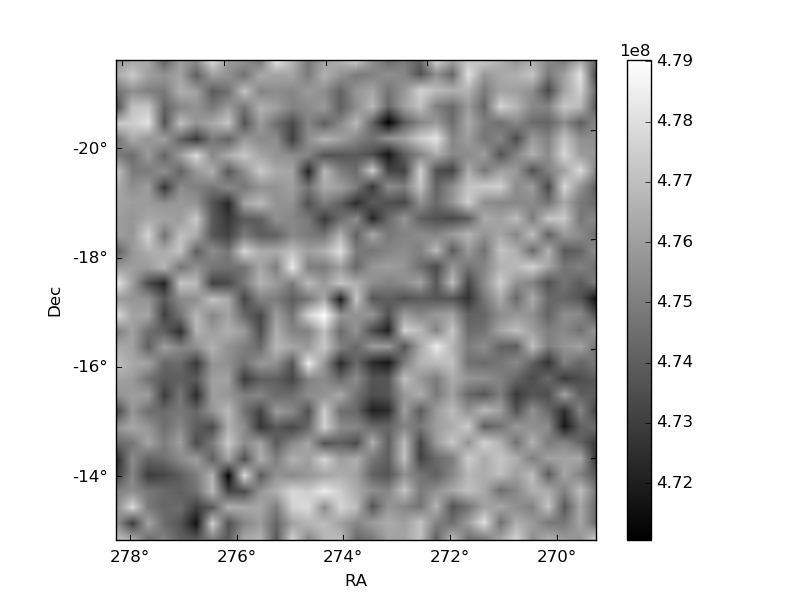
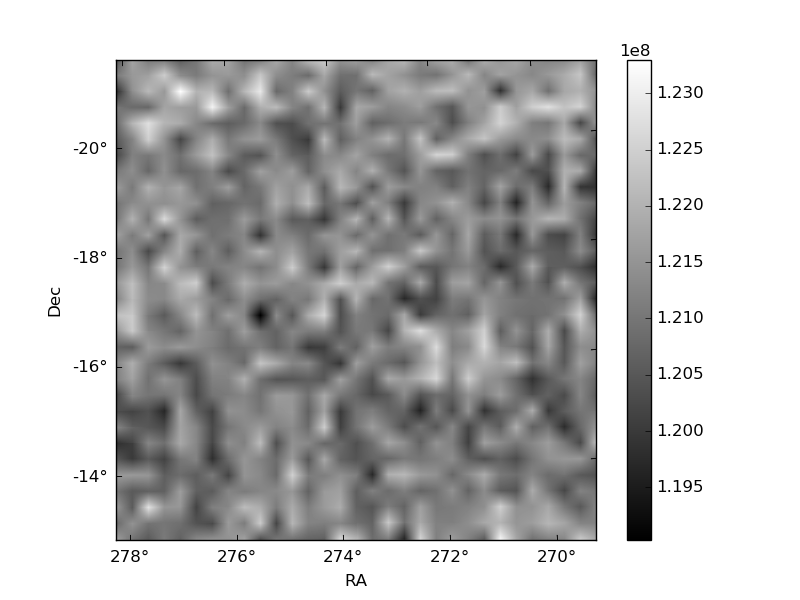
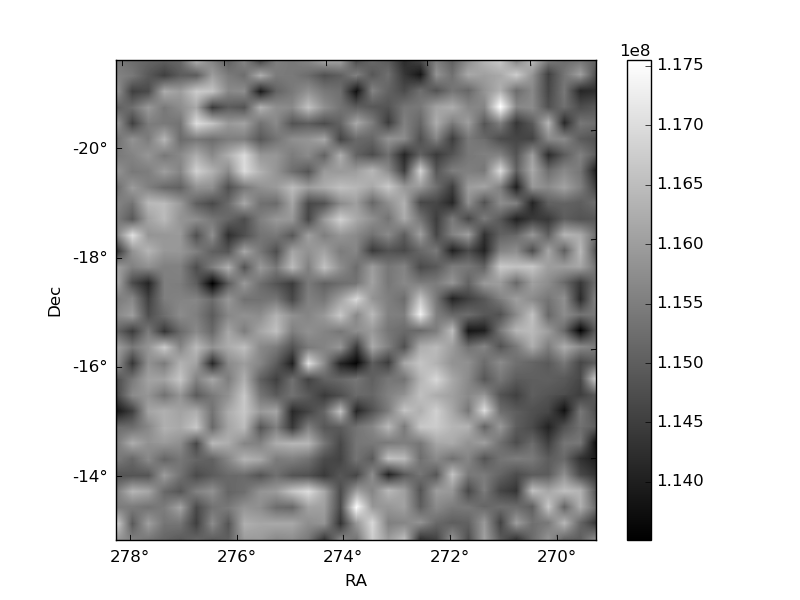
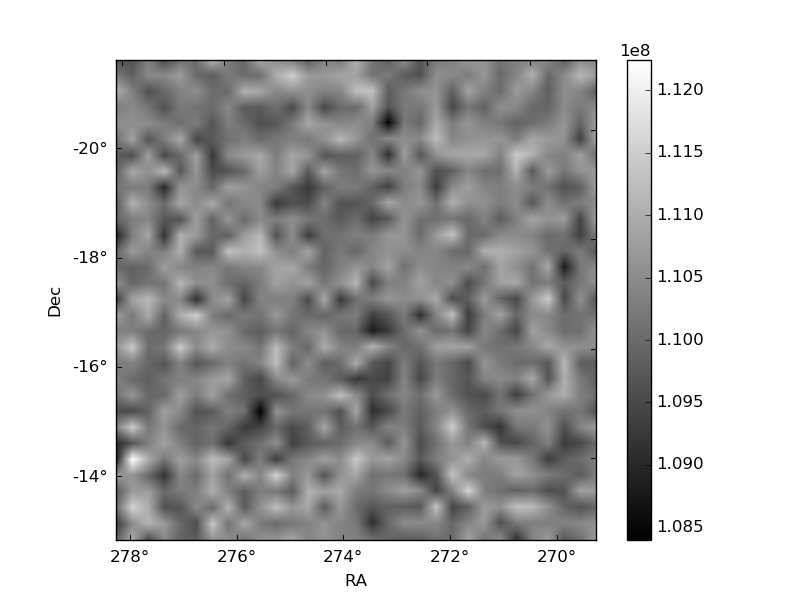
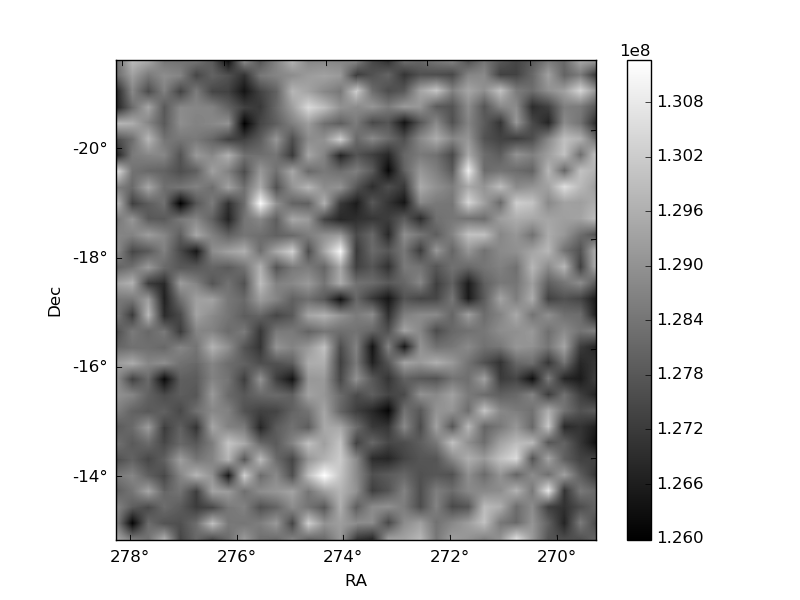
Histogram calculated using DETX and DETY for each event in the final _common_clean file
| Quadrant A | 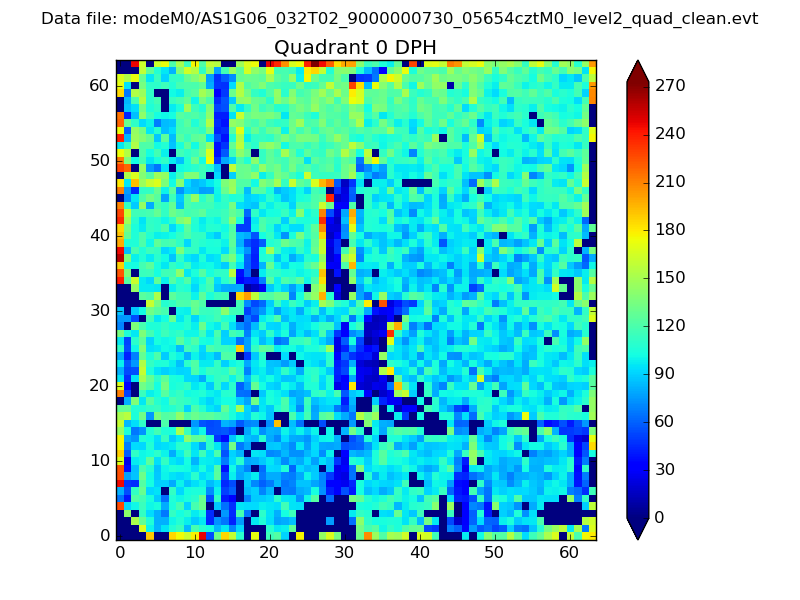 |
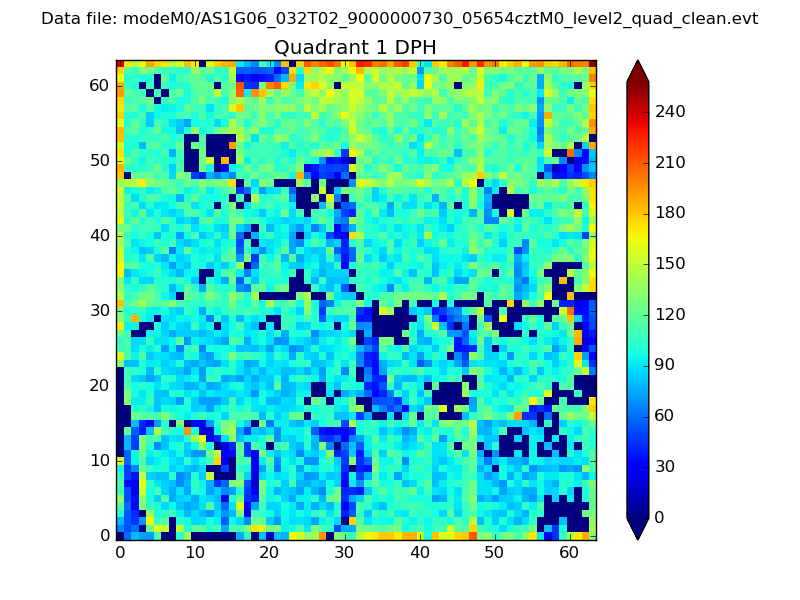 |
Quadrant B |
|---|---|---|---|
| Quadrant D | 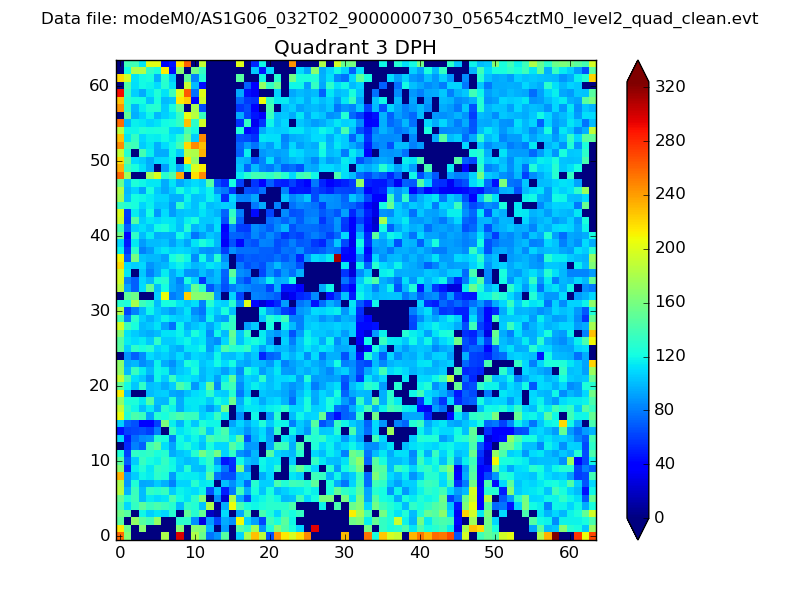 |
 |
Quadrant C |
| Plot type | Count rate plots | Images |
|---|---|---|
| Comparison with Poisson distribution Blue bars denote a histogram of data divided into 1 sec bins. Red curve is a Poisson curve with rate = median count rate of data. |
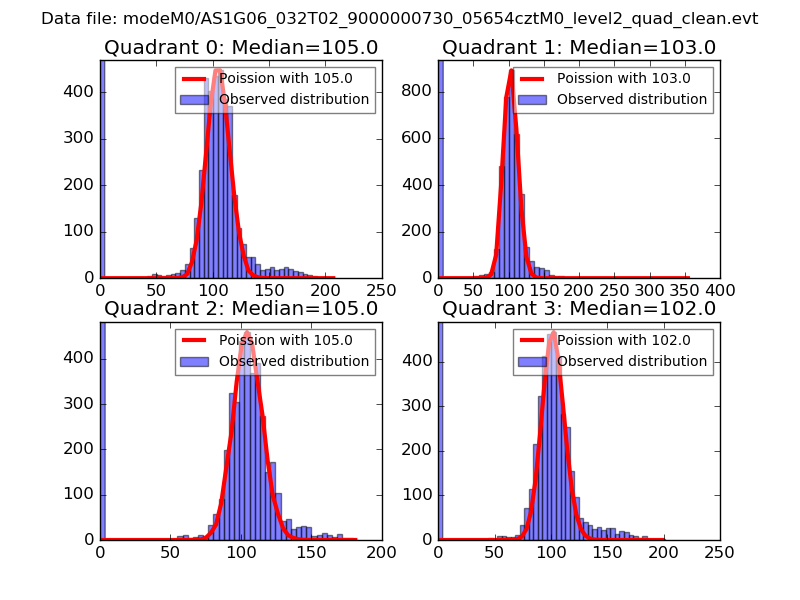 |
 |
| Quadrant-wise count rates Data is divided into 100 sec bins |
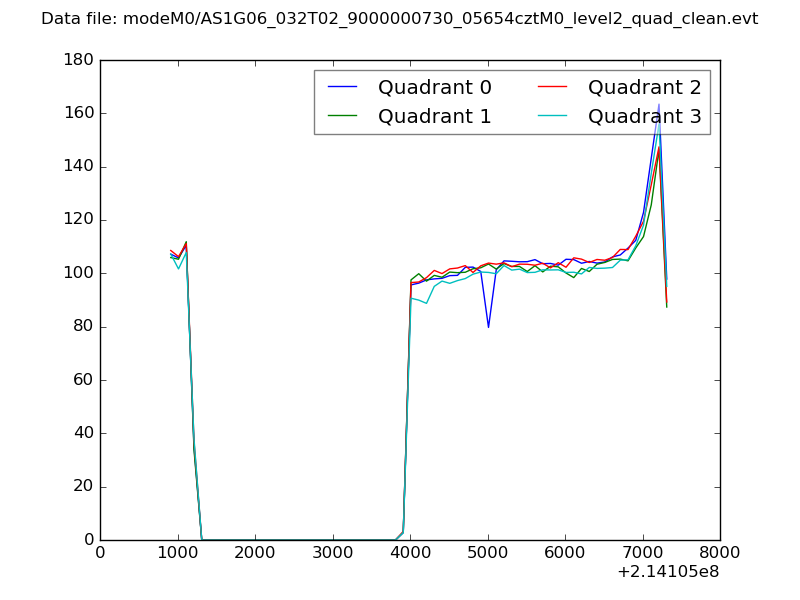 |
|
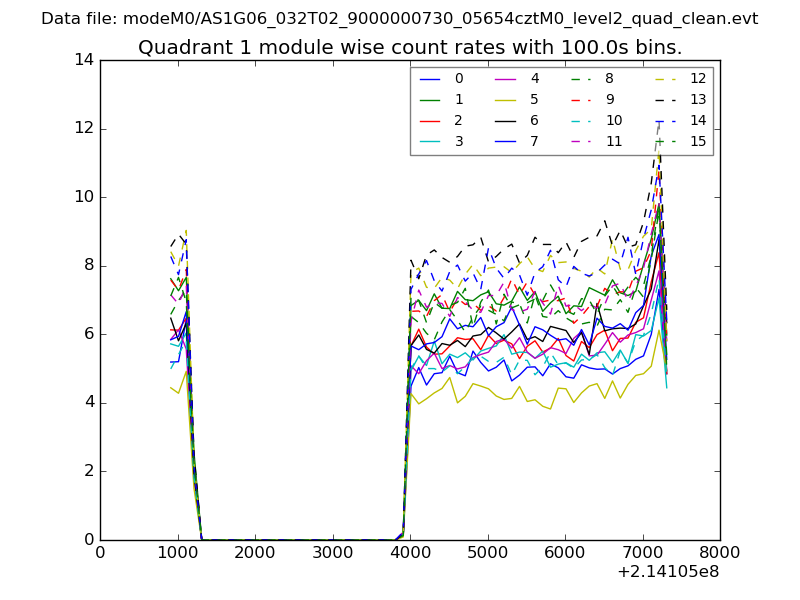
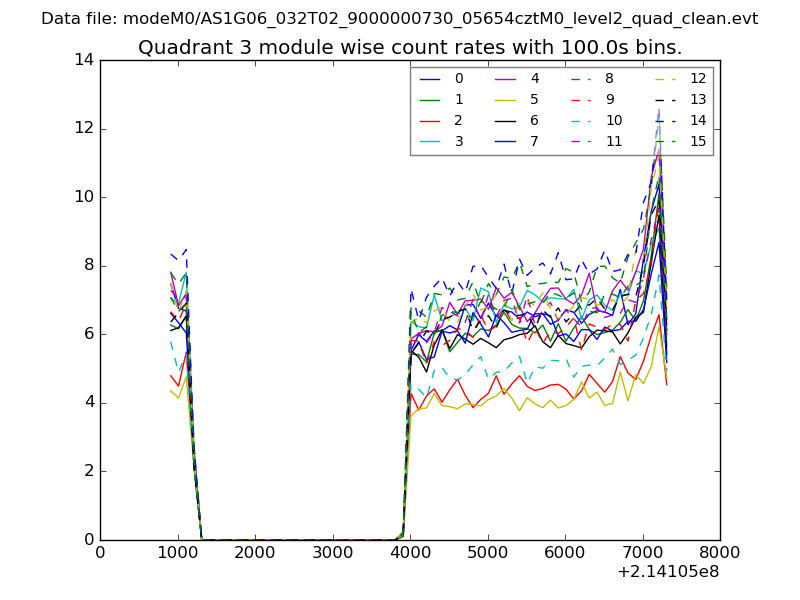
| Module-wise count rates for Quadrant A Data is divided into 100 sec bins |
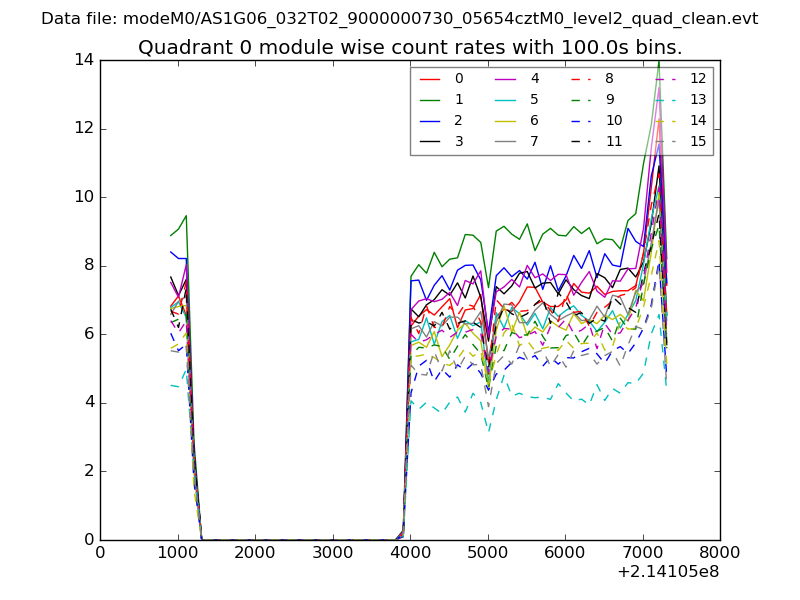 |
 |
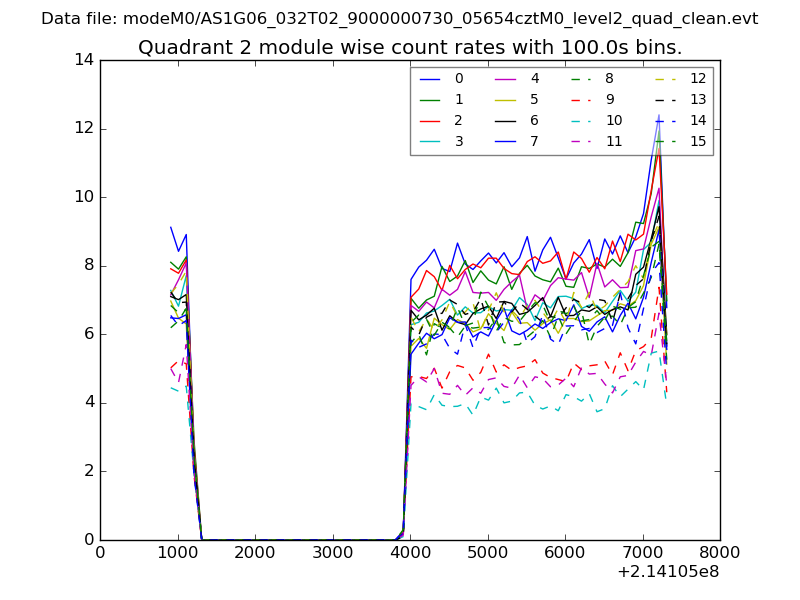
| Module-wise count rates for Quadrant B Data is divided into 100 sec bins |
 |
 |
| Module-wise count rates for Quadrant C Data is divided into 100 sec bins |
 |
 |
| Module-wise count rates for Quadrant D Data is divided into 100 sec bins |
 |
 |
| Parameter | Plot |
|---|---|
| CZT HV Monitor | 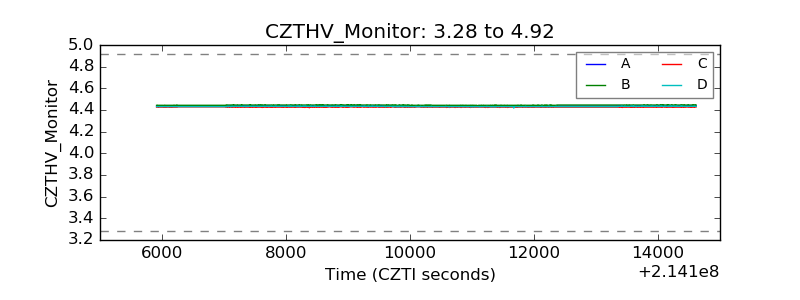 |
| D_VDD | 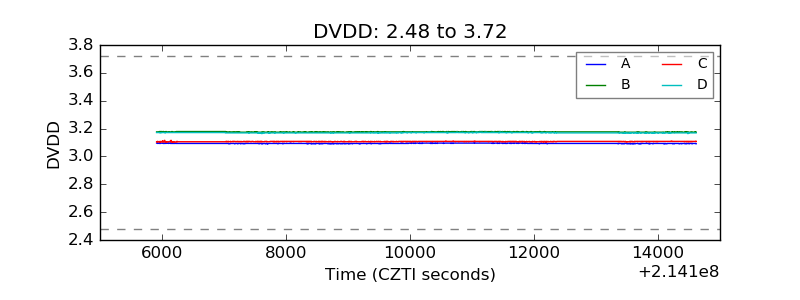 |
| Temperature 1 | 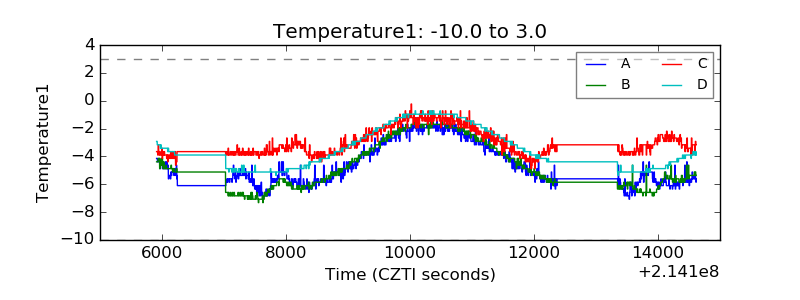 |
| Veto HV Monitor | 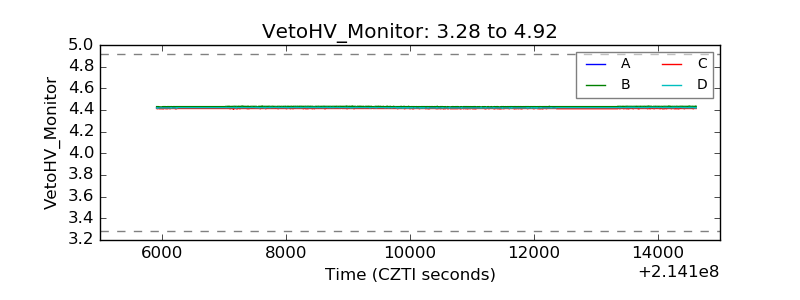 |
| Veto LLD | 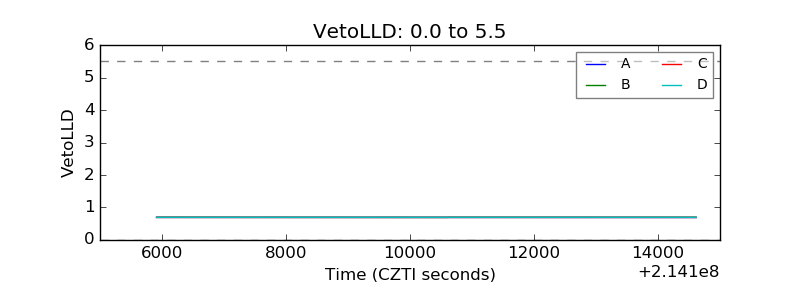 |
| Alpha Counter | 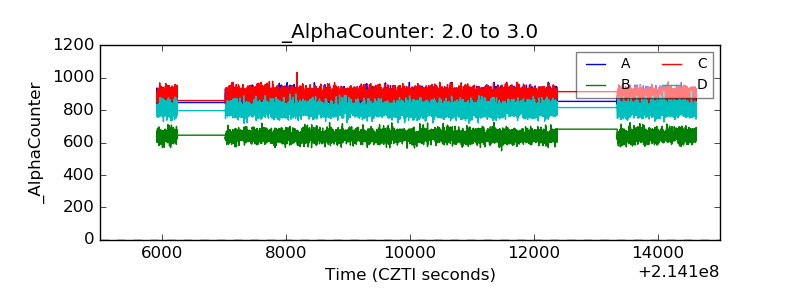 |
| _CPM_Rate | 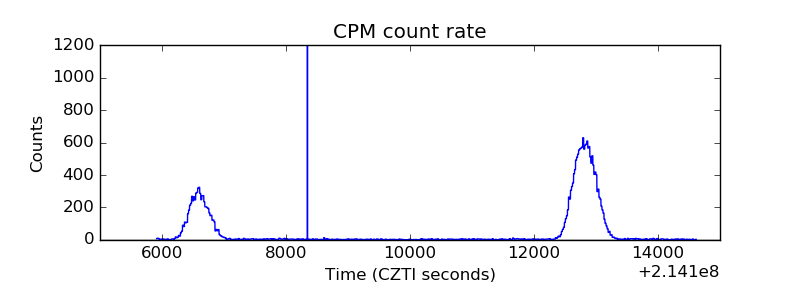 |
| CZT Counter | 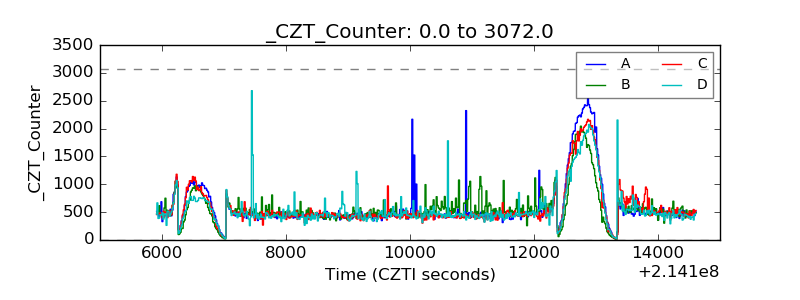 |
| +2.5 Volts monitor |  |
| +5 Volts monitor |  |
| _ROLL_ROT | 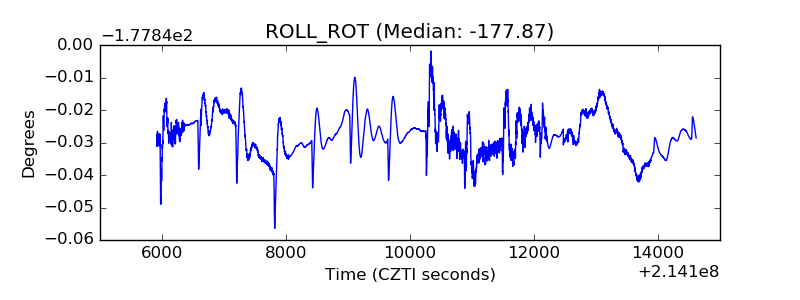 |
| _Roll_DEC | 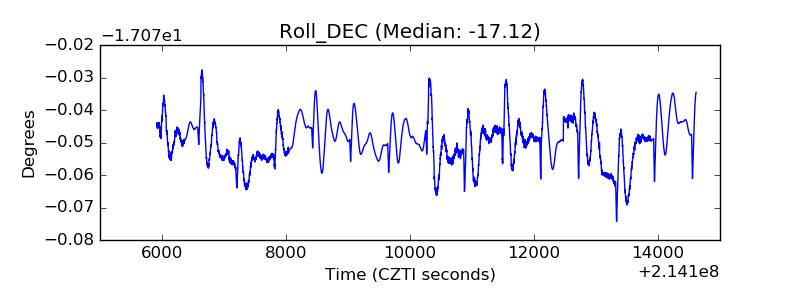 |
| _Roll_RA | 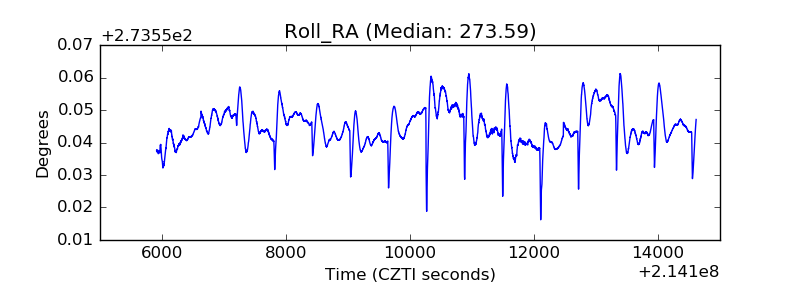 |
| Veto Counter | 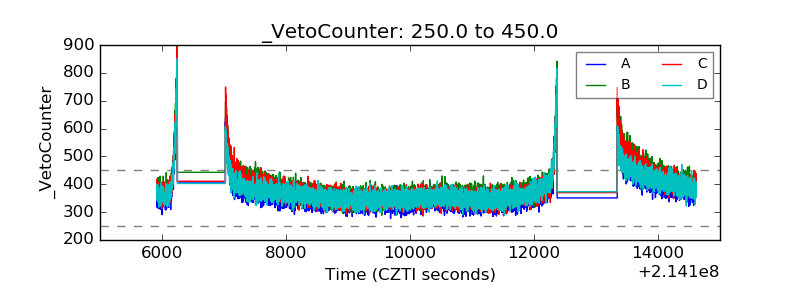 |