| Param | Original file | Final file |
|---|---|---|
| Filename | modeM0/AS1G06_032T02_9000000730_05657cztM0_level2.evt | modeM0/AS1G06_032T02_9000000730_05657cztM0_level2_quad_clean.evt |
| Size (bytes) | 445,838,400 | 75,965,760 |
| Size | 425.2 MB | 72.4 MB |
| Events in quadrant A | 3,123,013 | 467,714 |
| Events in quadrant B | 3,539,863 | 467,721 |
| Events in quadrant C | 3,187,536 | 469,873 |
| Events in quadrant D | 3,219,654 | 451,116 |
| Mode SS | |||
|---|---|---|---|
| Quadrant | BADHDUFLAG | Total packets | Discarded packets |
| A | 0 | 130 | 0 |
| B | 0 | 130 | 0 |
| C | 0 | 130 | 0 |
| D | 0 | 130 | 0 |
| Mode M0 | |||
|---|---|---|---|
| Quadrant | BADHDUFLAG | Total packets | Discarded packets |
| A | 0 | 13284 | 3 |
| B | 0 | 14438 | 2 |
| C | 0 | 13583 | 5 |
| D | 0 | 13459 | 2 |
| Mode M9 | |||
|---|---|---|---|
| Quadrant | BADHDUFLAG | Total packets | Discarded packets |
| A | 0 | 11 | 0 |
| B | 0 | 11 | 0 |
| C | 0 | 11 | 0 |
| D | 0 | 11 | 0 |
| Quadrant | Total seconds | Saturated seconds | Saturation percentage |
|---|---|---|---|
| A | 6357 | 81 | 1.274186% |
| B | 6357 | 120 | 1.887683% |
| C | 6356 | 75 | 1.179987% |
| D | 6357 | 62 | 0.975303% |
Noise dominated data is calculated using 1-second bins in cleaned event files. If a bin has >2000 counts, and if more than 50% of those come from <1% of pixels, then it is considered to be noise-dominated and hence unusable.
| Quadrant | # 1 sec bins | Bins with >0 counts | Bins with >2000 counts | High rate bins dominated by noise | Noise dominated (total time) | Noise dominated (detector-on time) | Marked lightcurve |
|---|---|---|---|---|---|---|---|
| A | 7507 | 6358 | 0 | 0 | 0.00% | 0.00% | 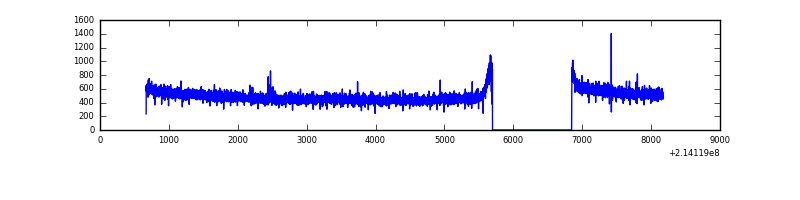 |
| B | 7507 | 6358 | 25 | 25 | 0.33% | 0.39% | 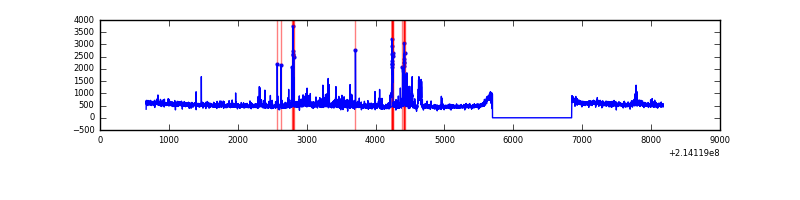 |
| C | 7507 | 6358 | 6 | 6 | 0.08% | 0.09% | 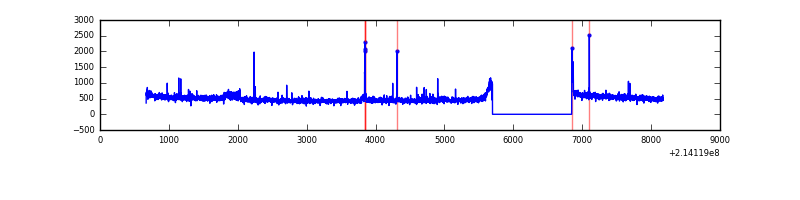 |
| D | 7507 | 6358 | 2 | 2 | 0.03% | 0.03% |  |
Top three noisy pixels from each quadrant. If the there are fewer than three noisy pixels in the level2.evt file, extra rows are filled as -1
| Pixel properties | Quadrant properties | ||||||
|---|---|---|---|---|---|---|---|
| Quadrant | DetID | PixID | Counts | Sigma | Mean | Median | Sigma |
| A | 13 | 6 | 10054 | 56.62 | 805 | 789 | 163.6 |
| A | 12 | 194 | 8133 | 44.88 | 805 | 789 | 163.6 |
| A | 0 | 226 | 7883 | 43.35 | 805 | 789 | 163.6 |
| B | 10 | 16 | 162121 | 1042.64 | 805 | 787 | 154.7 |
| B | 4 | 81 | 76349 | 488.33 | 805 | 787 | 154.7 |
| B | 0 | 214 | 70329 | 449.42 | 805 | 787 | 154.7 |
| C | 1 | 16 | 156058 | 865.42 | 773 | 777 | 179.4 |
| C | 12 | 4 | 8193 | 41.33 | 773 | 777 | 179.4 |
| C | 13 | 61 | 6254 | 30.52 | 773 | 777 | 179.4 |
| D | 8 | 195 | 153017 | 795.34 | 780 | 755 | 191.4 |
| D | 2 | 152 | 59165 | 305.1 | 780 | 755 | 191.4 |
| D | 12 | 233 | 17749 | 88.77 | 780 | 755 | 191.4 |
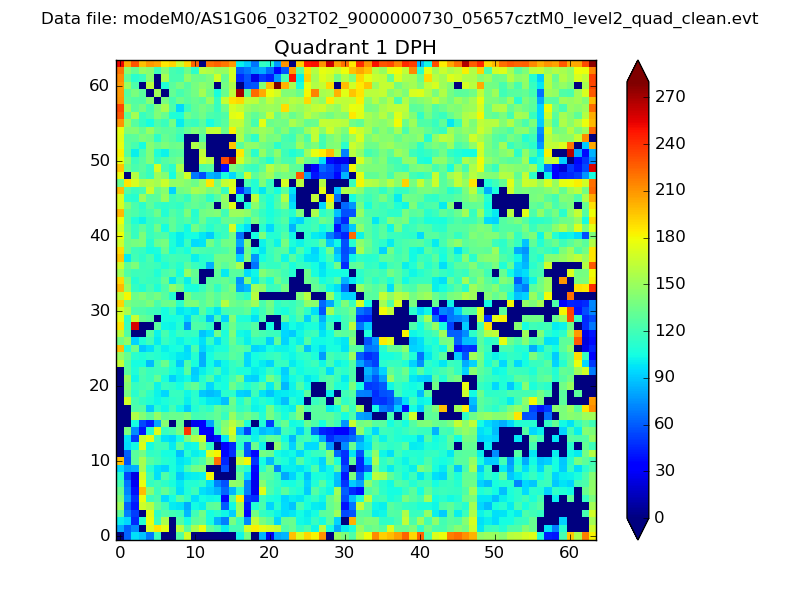
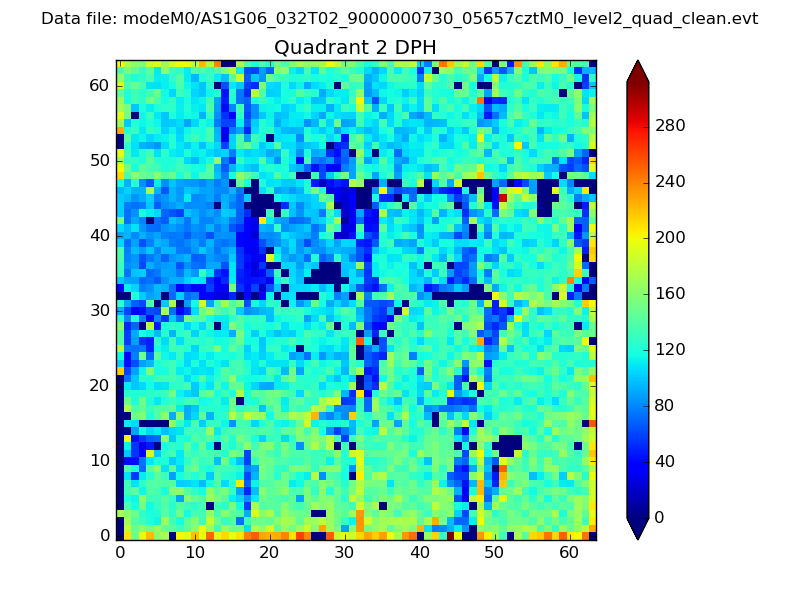
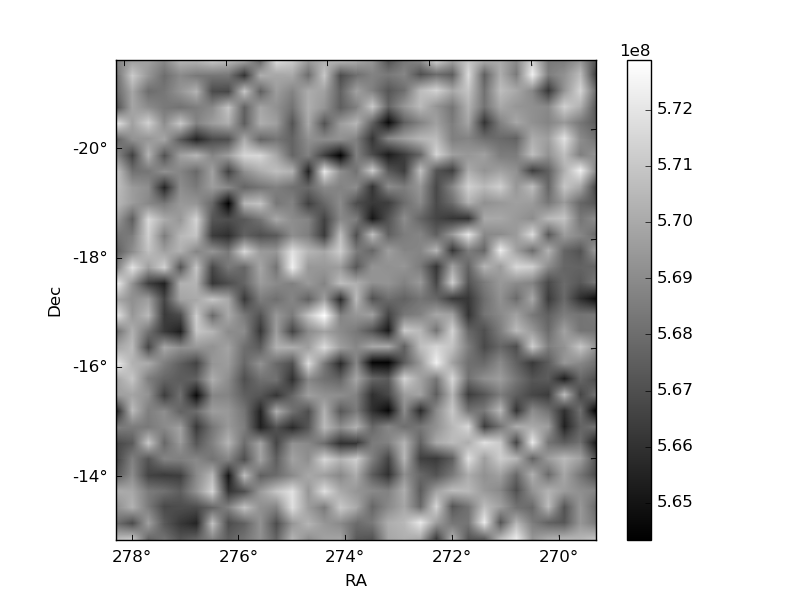
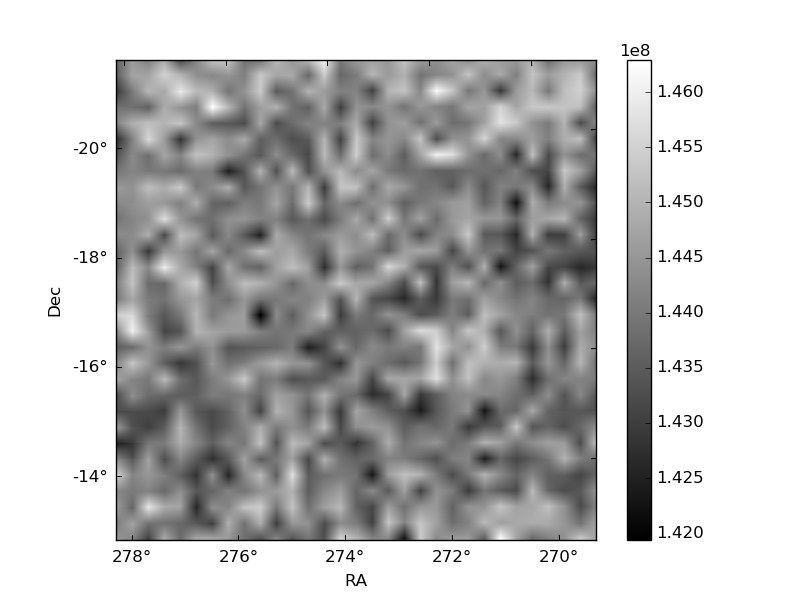
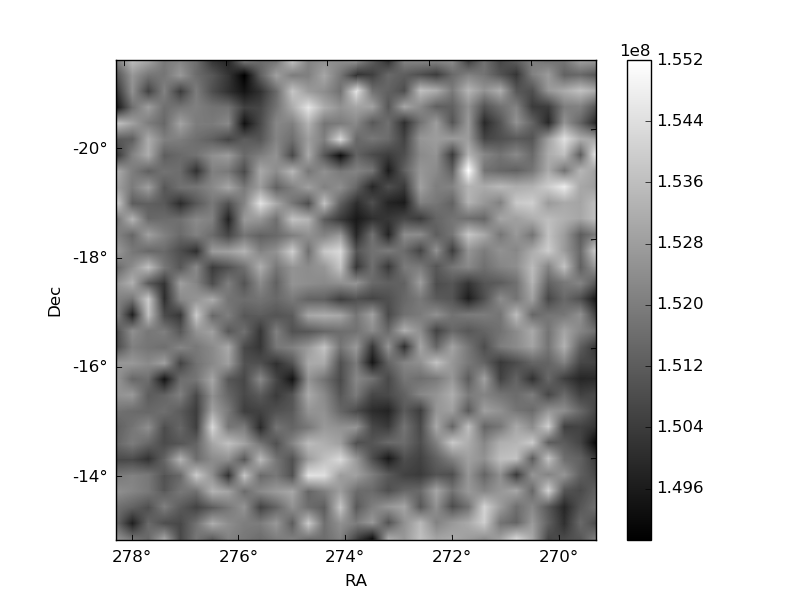
Histogram calculated using DETX and DETY for each event in the final _common_clean file
| Quadrant A | 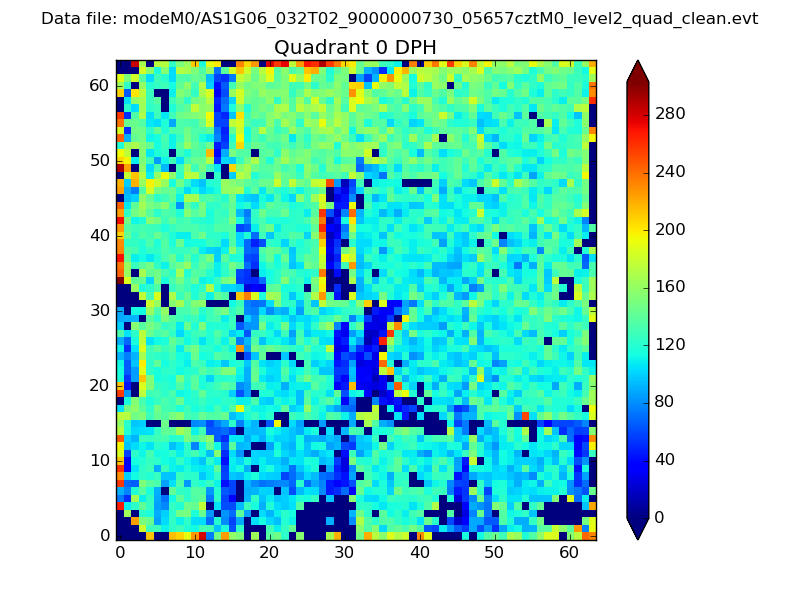 |
 |
Quadrant B |
|---|---|---|---|
| Quadrant D | 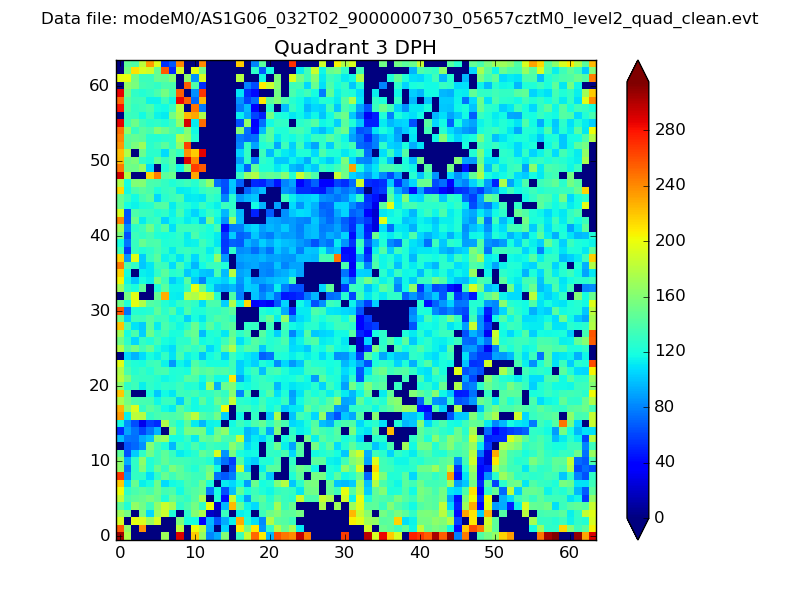 |
 |
Quadrant C |
| Plot type | Count rate plots | Images |
|---|---|---|
| Comparison with Poisson distribution Blue bars denote a histogram of data divided into 1 sec bins. Red curve is a Poisson curve with rate = median count rate of data. |
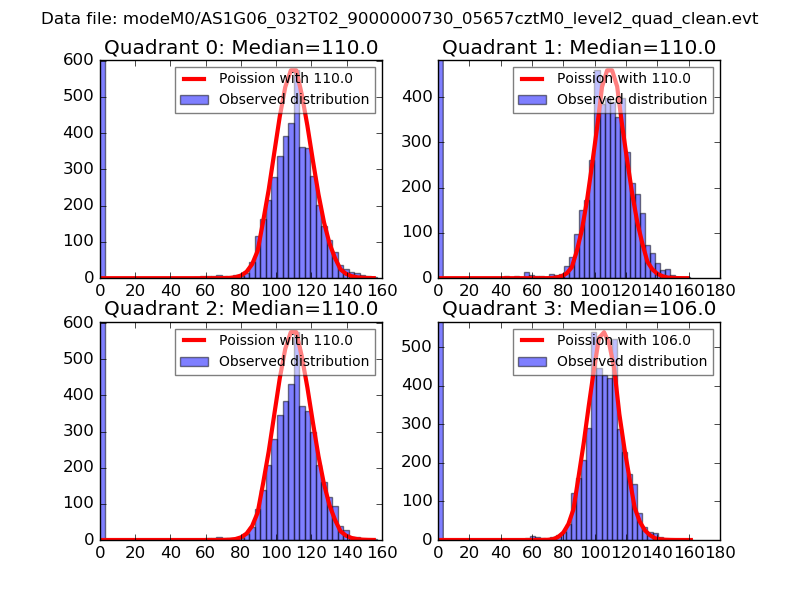 |
 |
| Quadrant-wise count rates Data is divided into 100 sec bins |
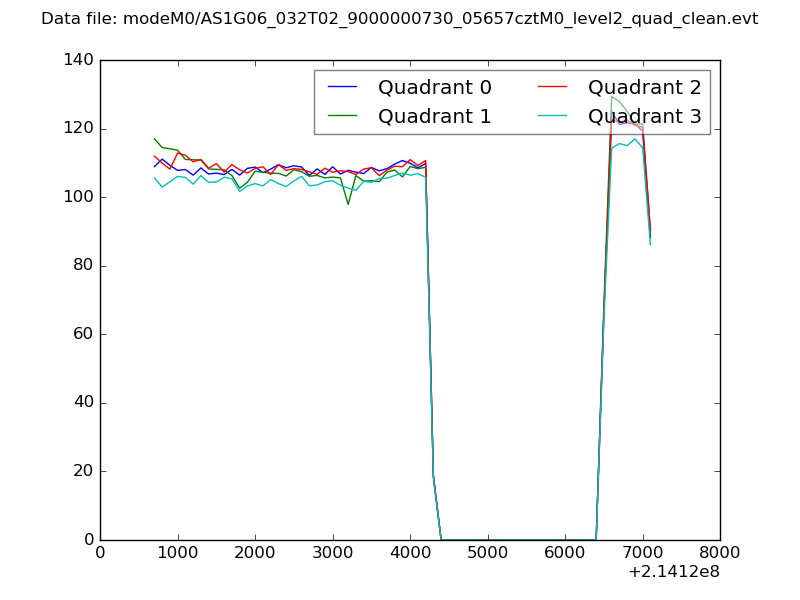 |
|
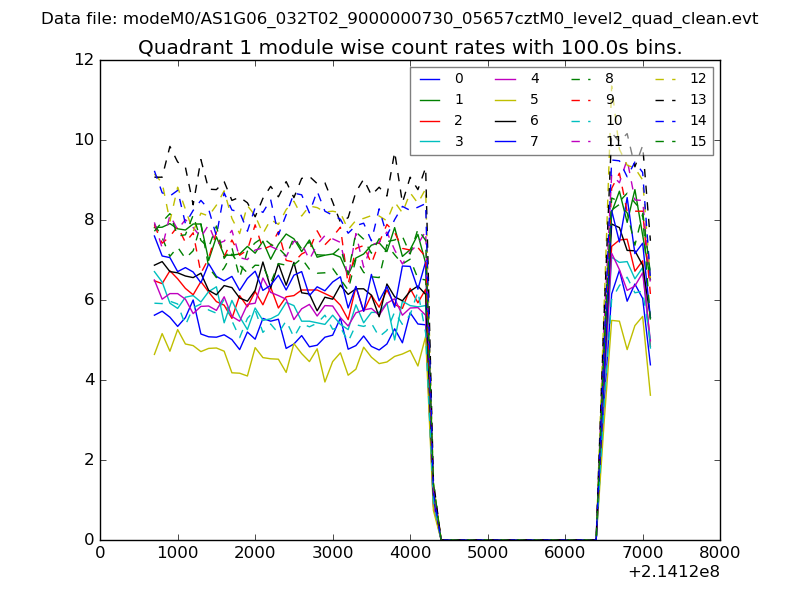
| Module-wise count rates for Quadrant A Data is divided into 100 sec bins |
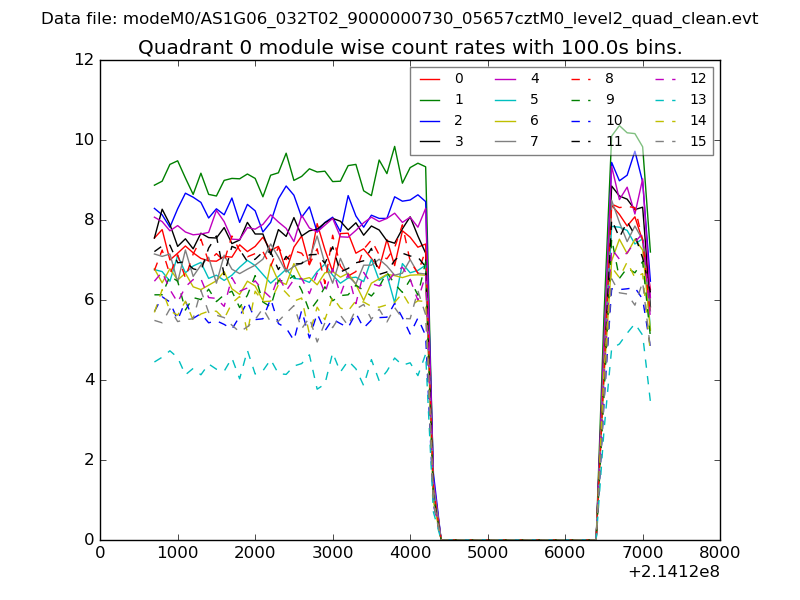 |
 |
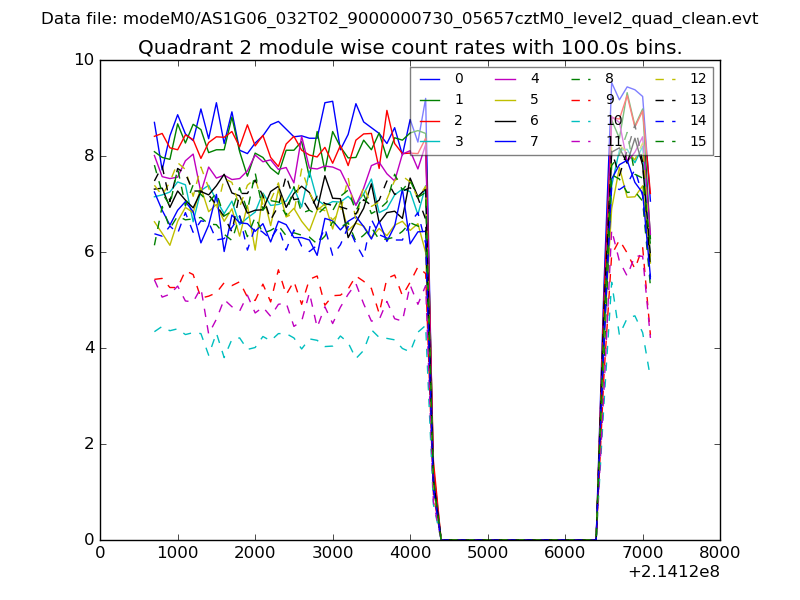
| Module-wise count rates for Quadrant B Data is divided into 100 sec bins |
 |
 |
| Module-wise count rates for Quadrant C Data is divided into 100 sec bins |
 |
 |
| Module-wise count rates for Quadrant D Data is divided into 100 sec bins |
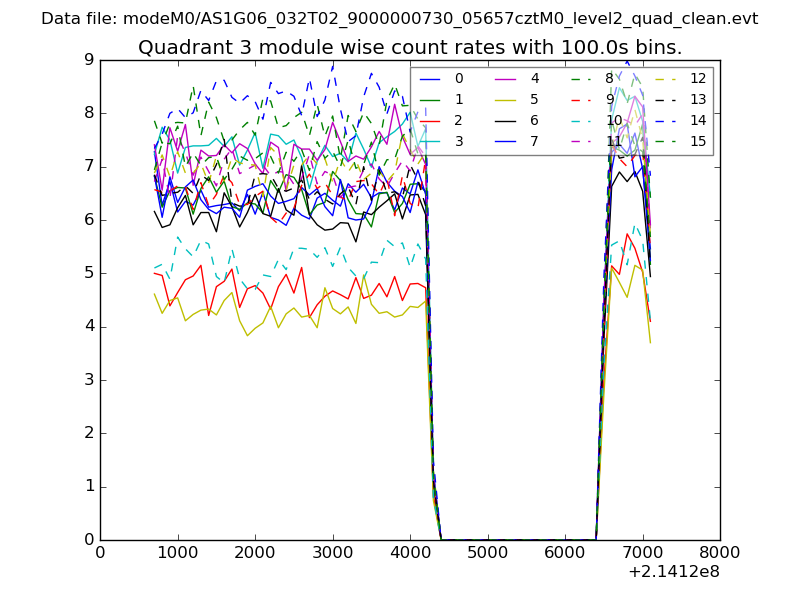 |
 |
| Parameter | Plot |
|---|---|
| CZT HV Monitor | 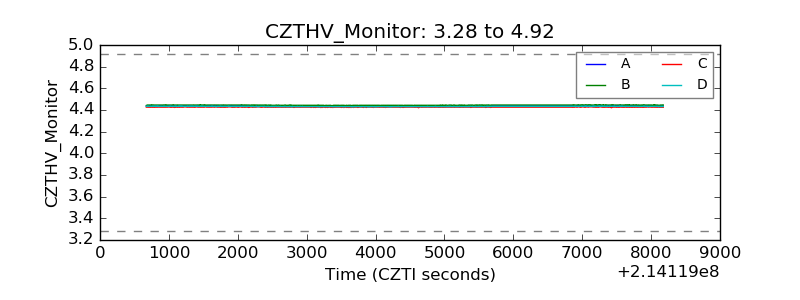 |
| D_VDD | 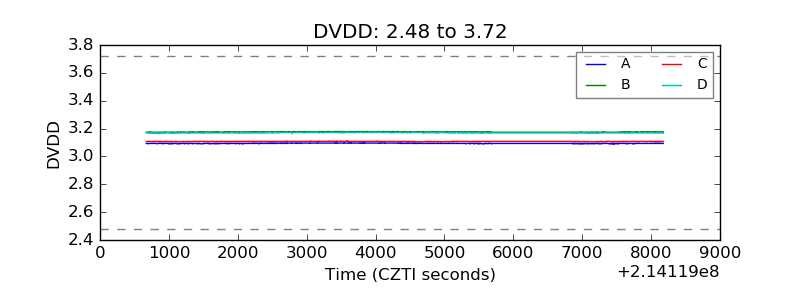 |
| Temperature 1 | 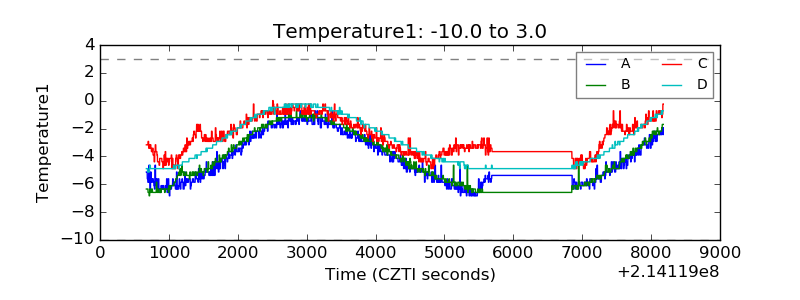 |
| Veto HV Monitor | 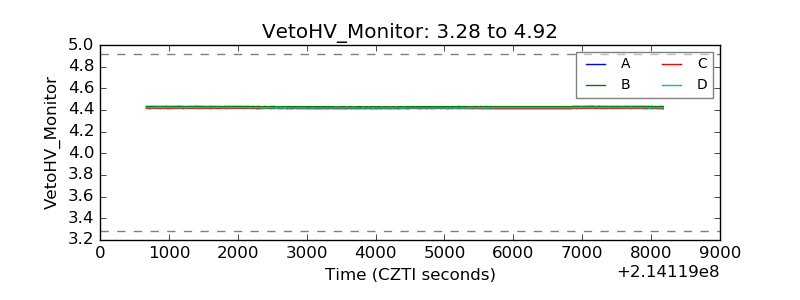 |
| Veto LLD | 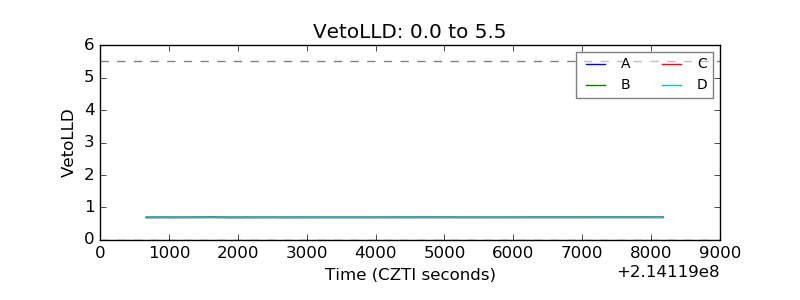 |
| Alpha Counter | 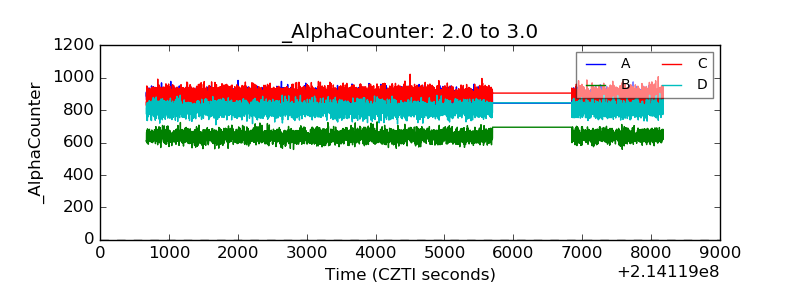 |
| _CPM_Rate | 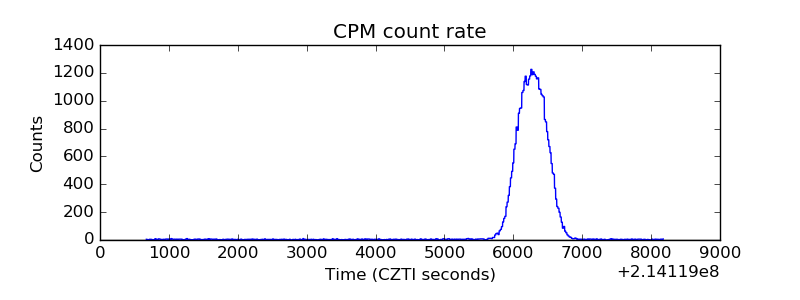 |
| CZT Counter | 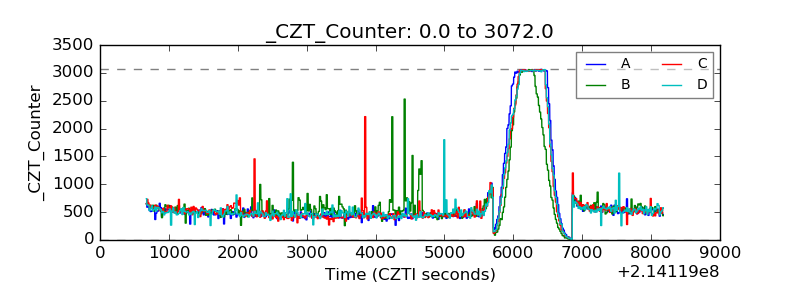 |
| +2.5 Volts monitor |  |
| +5 Volts monitor |  |
| _ROLL_ROT | 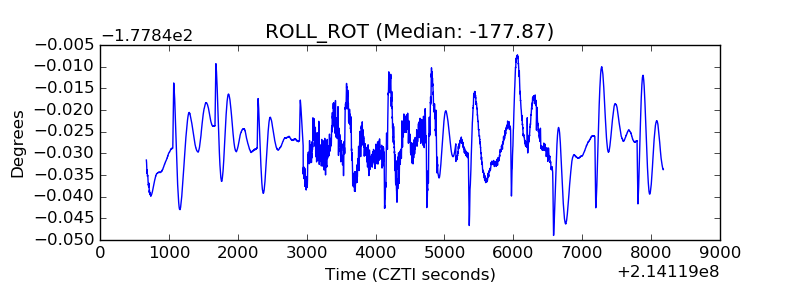 |
| _Roll_DEC | 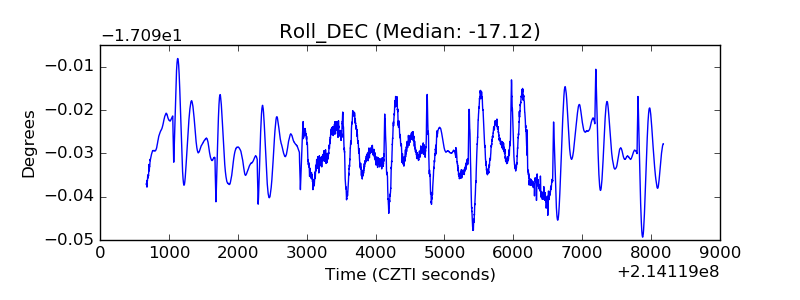 |
| _Roll_RA | 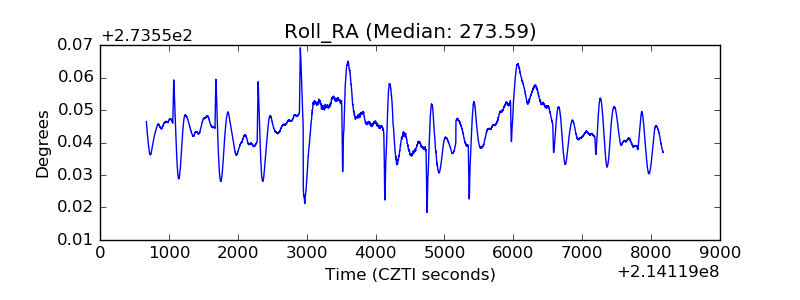 |
| Veto Counter | 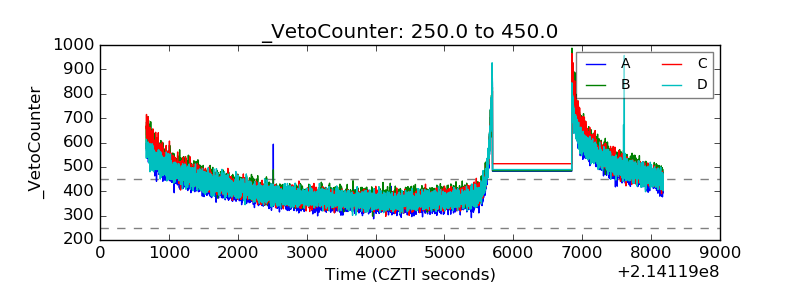 |