| Param | Original file | Final file |
|---|---|---|
| Filename | modeM0/AS1G06_032T02_9000000730_05658cztM0_level2.evt | modeM0/AS1G06_032T02_9000000730_05658cztM0_level2_quad_clean.evt |
| Size (bytes) | 457,649,280 | 85,668,480 |
| Size | 436.4 MB | 81.7 MB |
| Events in quadrant A | 3,224,727 | 545,713 |
| Events in quadrant B | 3,498,382 | 543,831 |
| Events in quadrant C | 3,250,893 | 541,482 |
| Events in quadrant D | 3,454,878 | 520,368 |
| Mode SS | |||
|---|---|---|---|
| Quadrant | BADHDUFLAG | Total packets | Discarded packets |
| A | 0 | 128 | 0 |
| B | 0 | 128 | 0 |
| C | 0 | 128 | 0 |
| D | 0 | 128 | 0 |
| Mode M0 | |||
|---|---|---|---|
| Quadrant | BADHDUFLAG | Total packets | Discarded packets |
| A | 0 | 13581 | 6 |
| B | 0 | 14346 | 2 |
| C | 0 | 13747 | 4 |
| D | 0 | 14141 | 2 |
| Mode M9 | |||
|---|---|---|---|
| Quadrant | BADHDUFLAG | Total packets | Discarded packets |
| A | 0 | 16 | 0 |
| B | 0 | 16 | 0 |
| C | 0 | 16 | 0 |
| D | 0 | 17 | 0 |
| Quadrant | Total seconds | Saturated seconds | Saturation percentage |
|---|---|---|---|
| A | 6350 | 94 | 1.480315% |
| B | 6351 | 96 | 1.511573% |
| C | 6350 | 80 | 1.259843% |
| D | 6351 | 78 | 1.228153% |
Noise dominated data is calculated using 1-second bins in cleaned event files. If a bin has >2000 counts, and if more than 50% of those come from <1% of pixels, then it is considered to be noise-dominated and hence unusable.
| Quadrant | # 1 sec bins | Bins with >0 counts | Bins with >2000 counts | High rate bins dominated by noise | Noise dominated (total time) | Noise dominated (detector-on time) | Marked lightcurve |
|---|---|---|---|---|---|---|---|
| A | 7596 | 6352 | 2 | 2 | 0.03% | 0.03% | 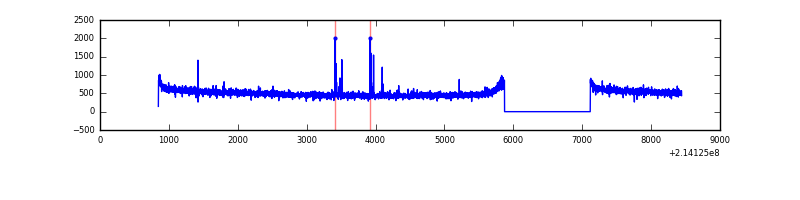 |
| B | 7596 | 6352 | 11 | 11 | 0.14% | 0.17% | 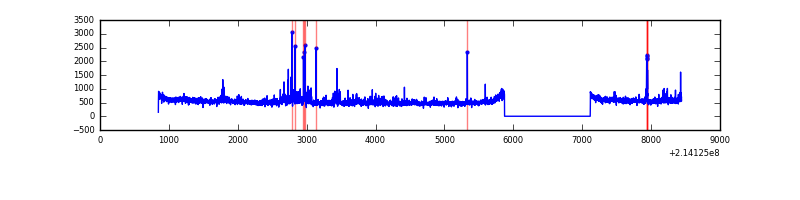 |
| C | 7596 | 6352 | 5 | 5 | 0.07% | 0.08% | 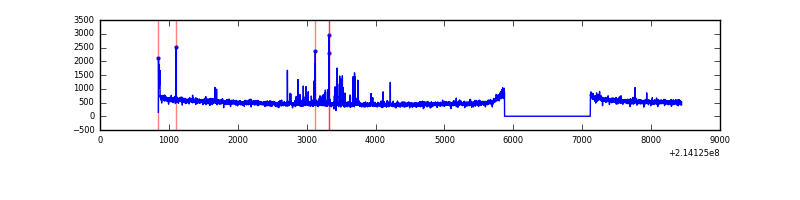 |
| D | 7596 | 6352 | 7 | 7 | 0.09% | 0.11% | 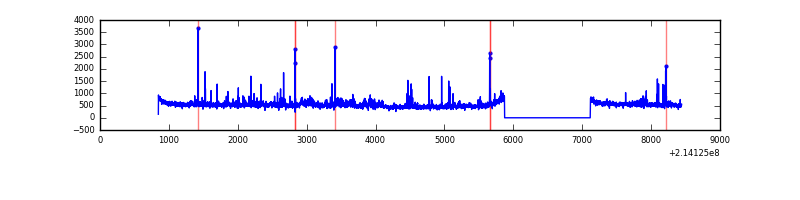 |
Top three noisy pixels from each quadrant. If the there are fewer than three noisy pixels in the level2.evt file, extra rows are filled as -1
| Pixel properties | Quadrant properties | ||||||
|---|---|---|---|---|---|---|---|
| Quadrant | DetID | PixID | Counts | Sigma | Mean | Median | Sigma |
| A | 0 | 50 | 16706 | 93.77 | 827 | 811 | 169.5 |
| A | 0 | 254 | 15056 | 84.04 | 827 | 811 | 169.5 |
| A | 0 | 226 | 8293 | 44.14 | 827 | 811 | 169.5 |
| B | 15 | 204 | 99673 | 629.41 | 821 | 803 | 157.1 |
| B | 11 | 51 | 63169 | 397.02 | 821 | 803 | 157.1 |
| B | 15 | 54 | 38129 | 237.62 | 821 | 803 | 157.1 |
| C | 1 | 16 | 99323 | 545.57 | 787 | 791 | 180.6 |
| C | 5 | 250 | 58715 | 320.72 | 787 | 791 | 180.6 |
| C | 12 | 4 | 8820 | 44.46 | 787 | 791 | 180.6 |
| D | 8 | 195 | 241801 | 1224.17 | 799 | 776 | 196.9 |
| D | 2 | 152 | 74673 | 375.32 | 799 | 776 | 196.9 |
| D | 2 | 14 | 32005 | 158.61 | 799 | 776 | 196.9 |
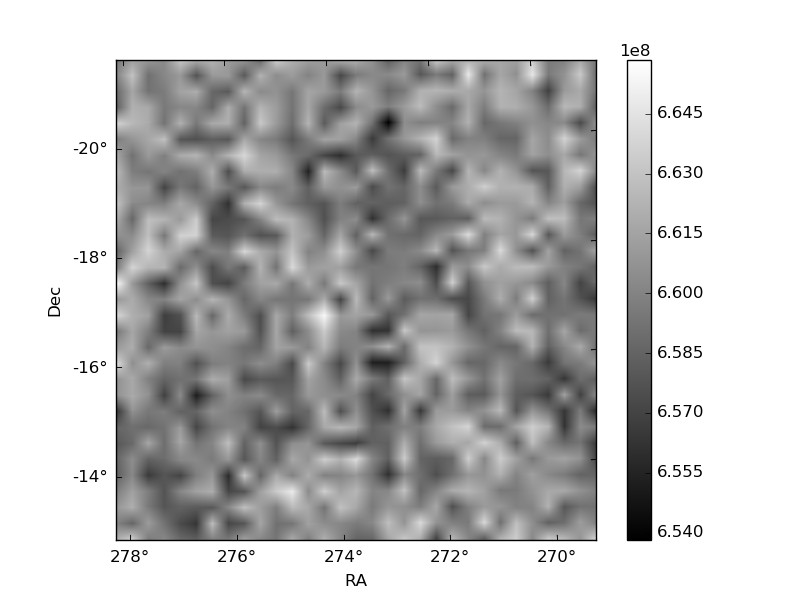
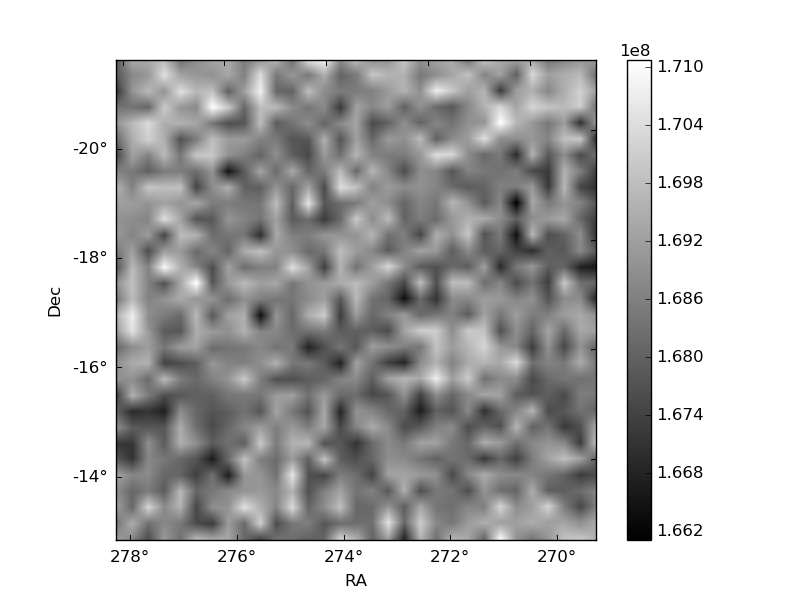
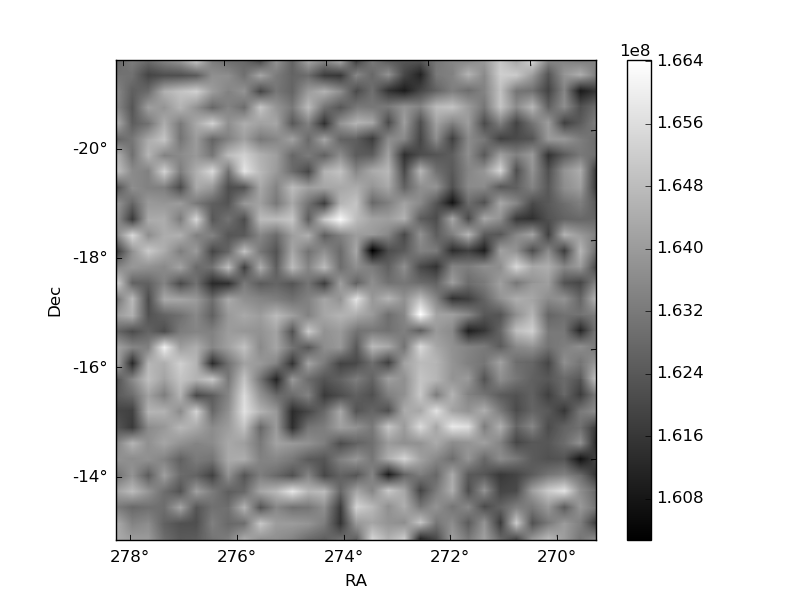
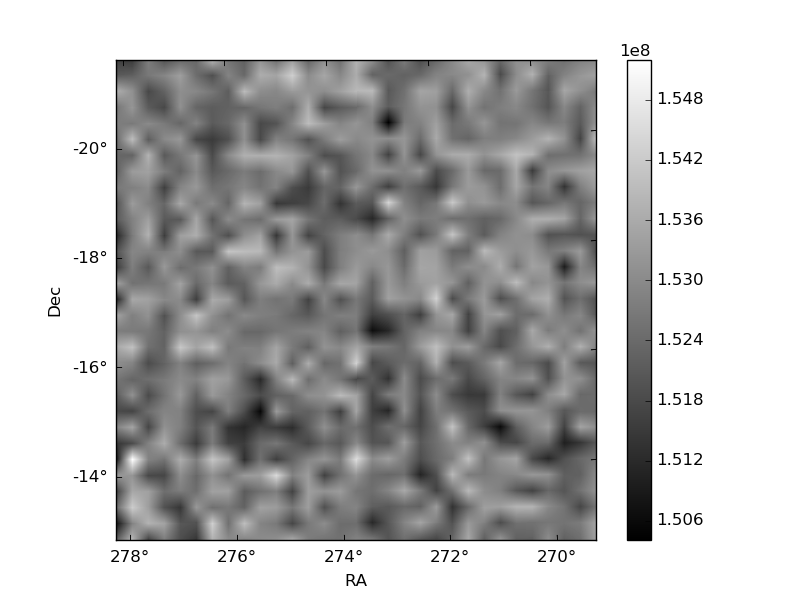
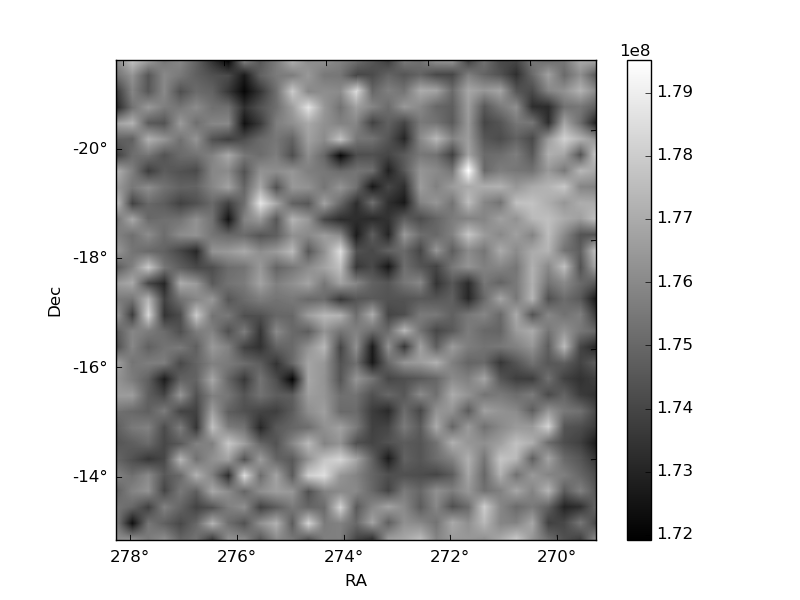
Histogram calculated using DETX and DETY for each event in the final _common_clean file
| Quadrant A | 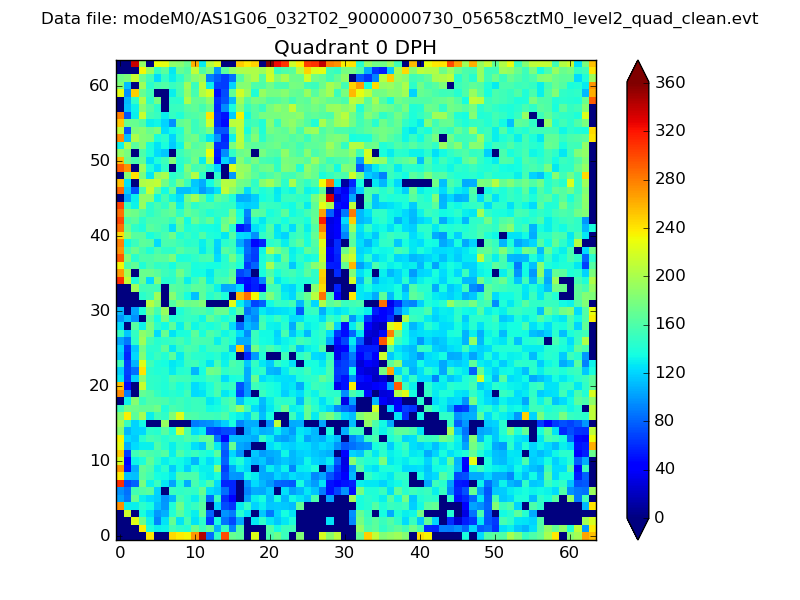 |
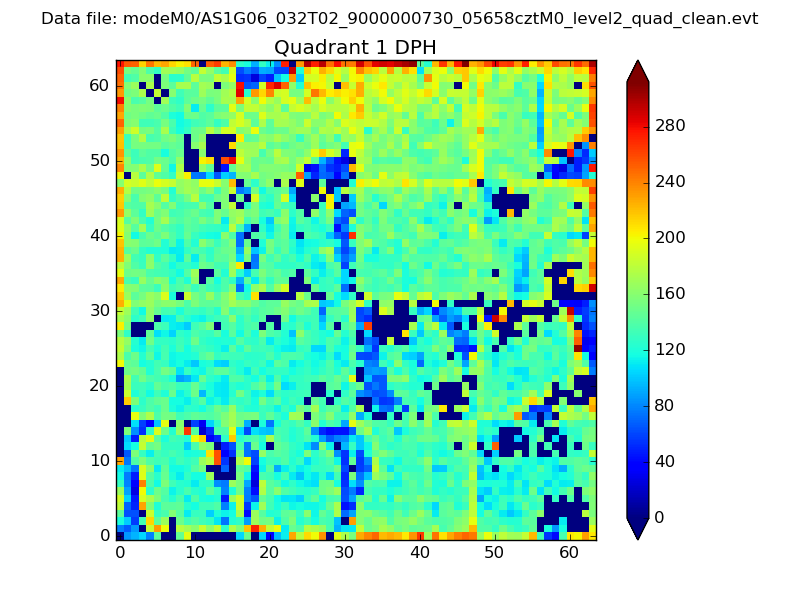 |
Quadrant B |
|---|---|---|---|
| Quadrant D | 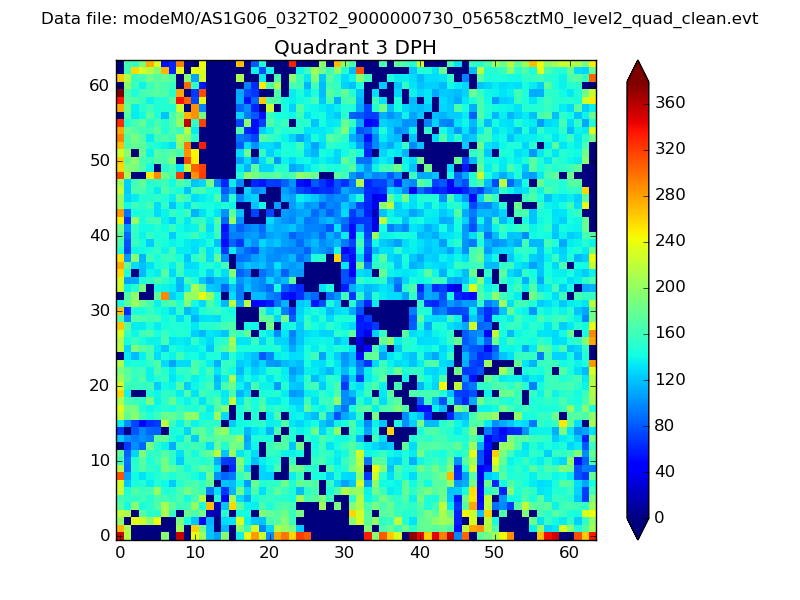 |
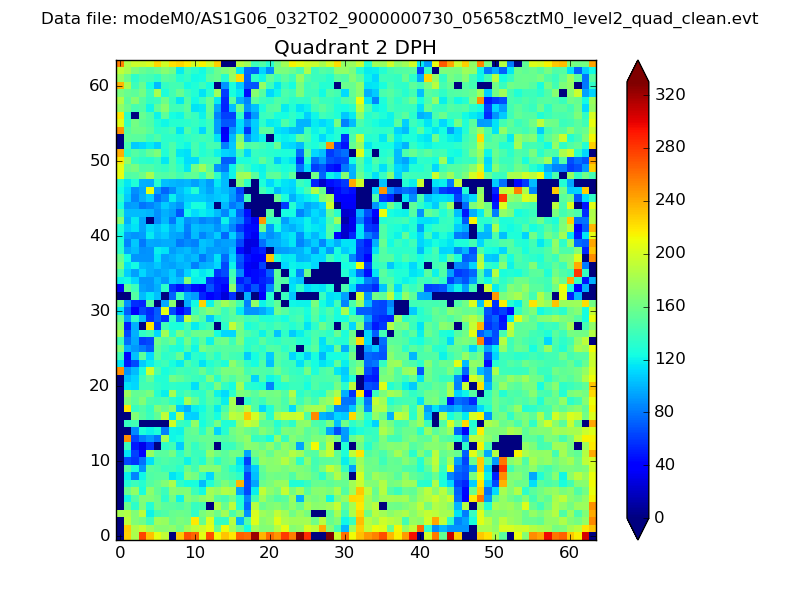 |
Quadrant C |
| Plot type | Count rate plots | Images |
|---|---|---|
| Comparison with Poisson distribution Blue bars denote a histogram of data divided into 1 sec bins. Red curve is a Poisson curve with rate = median count rate of data. |
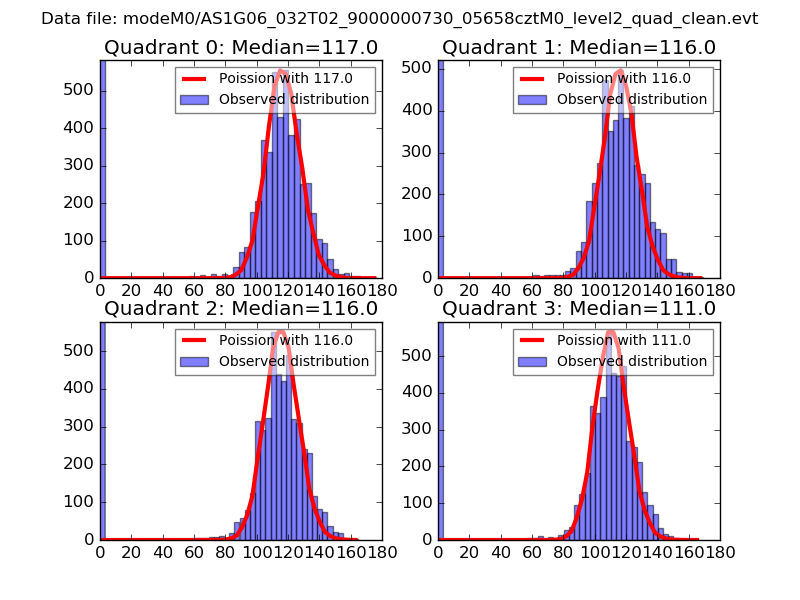 |
 |
| Quadrant-wise count rates Data is divided into 100 sec bins |
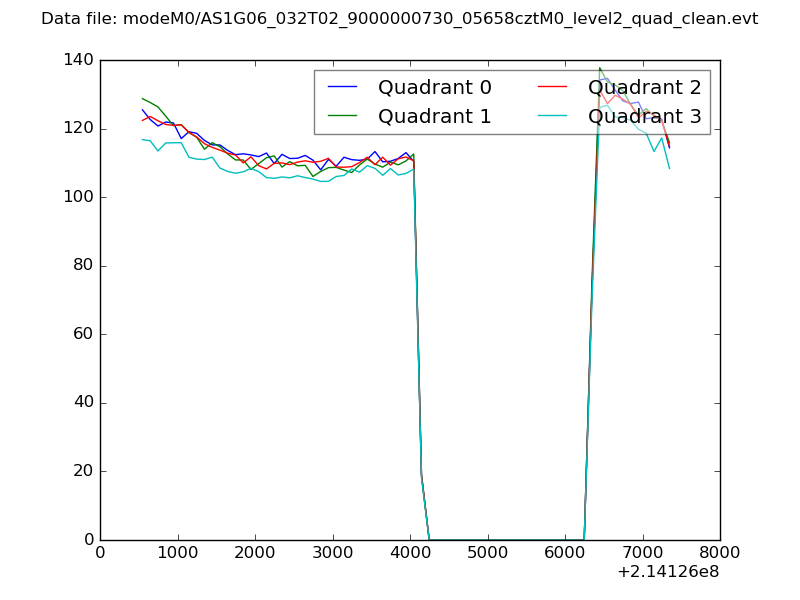 |
|
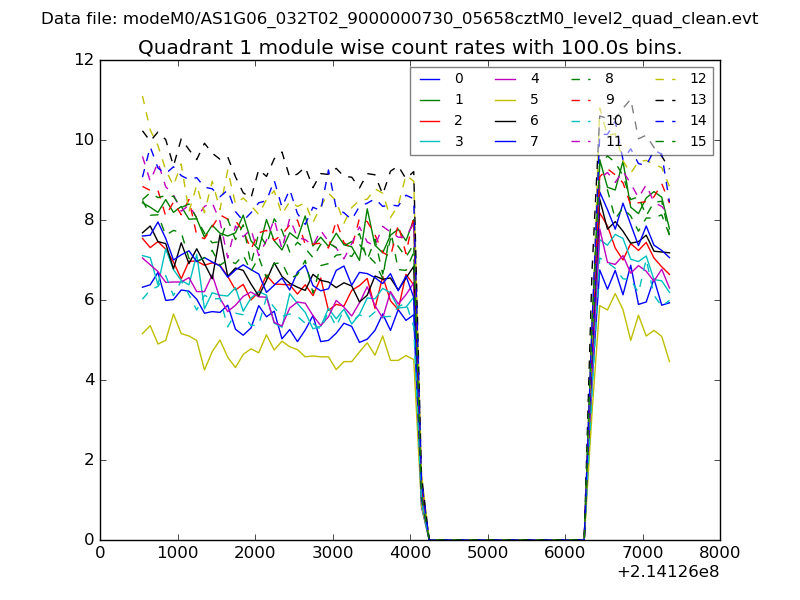
| Module-wise count rates for Quadrant A Data is divided into 100 sec bins |
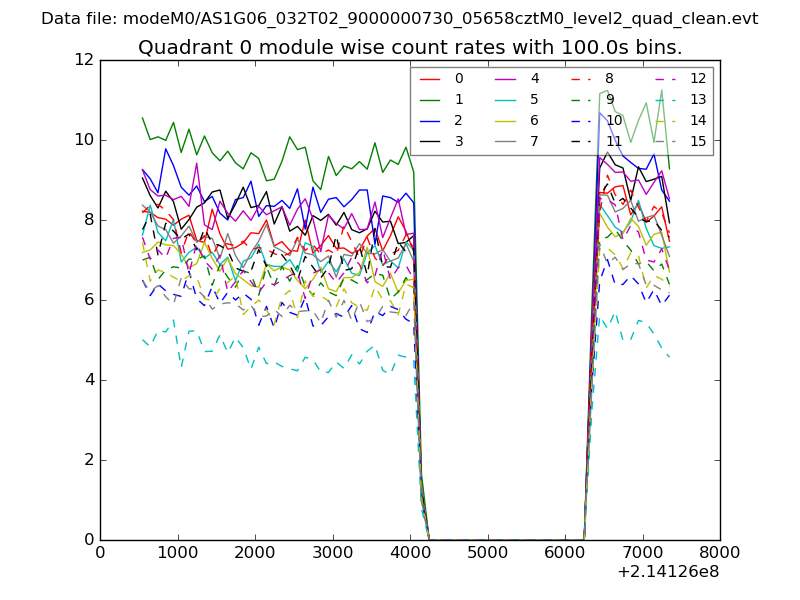 |
 |
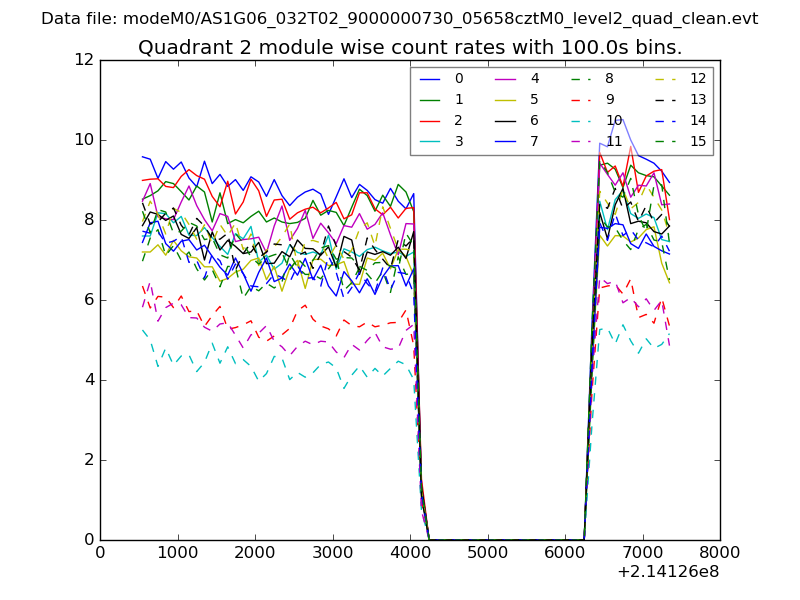
| Module-wise count rates for Quadrant B Data is divided into 100 sec bins |
 |
 |
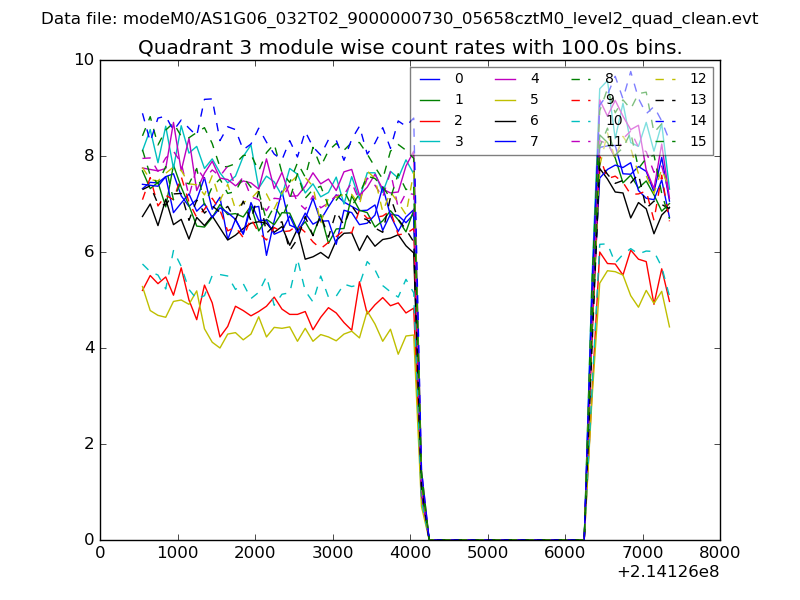
| Module-wise count rates for Quadrant C Data is divided into 100 sec bins |
 |
 |
| Module-wise count rates for Quadrant D Data is divided into 100 sec bins |
 |
 |
| Parameter | Plot |
|---|---|
| CZT HV Monitor | 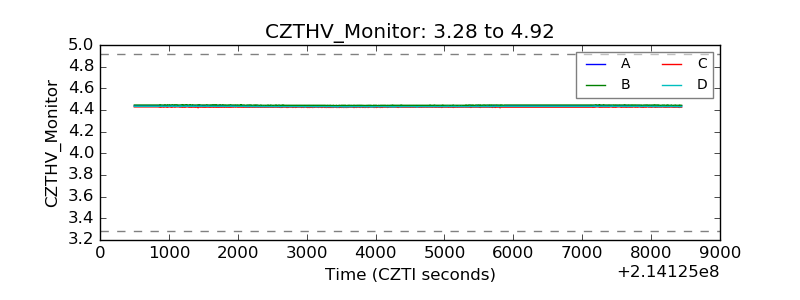 |
| D_VDD | 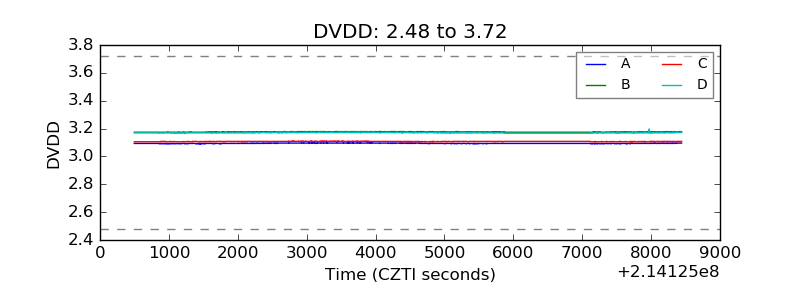 |
| Temperature 1 | 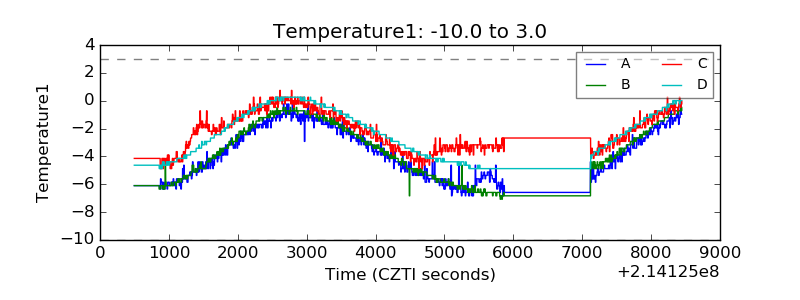 |
| Veto HV Monitor | 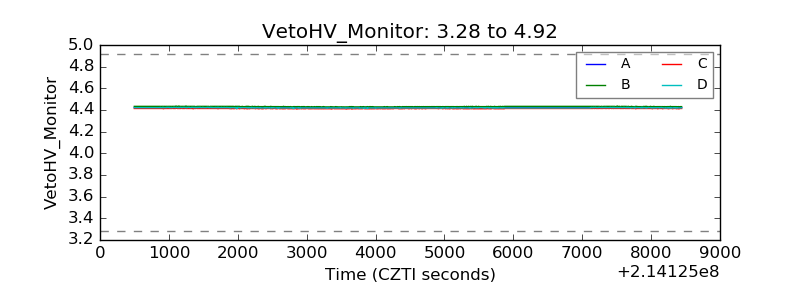 |
| Veto LLD | 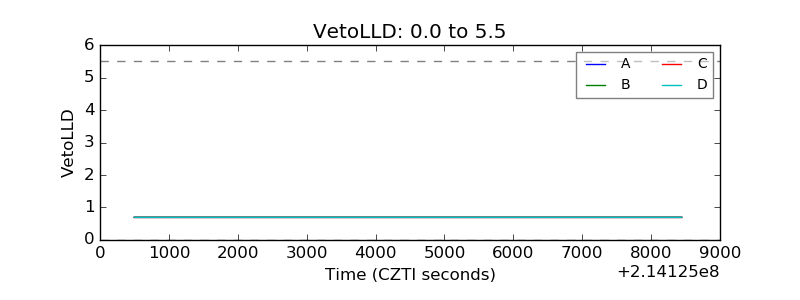 |
| Alpha Counter | 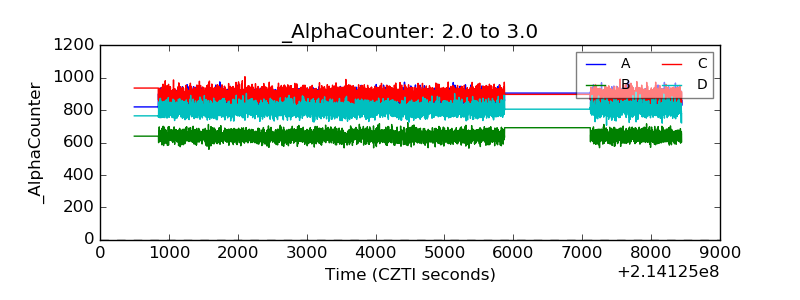 |
| _CPM_Rate | 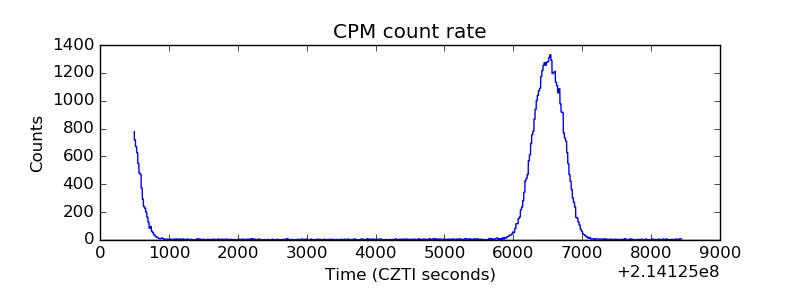 |
| CZT Counter | 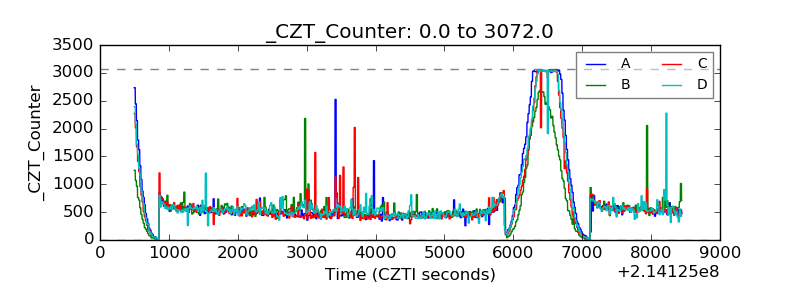 |
| +2.5 Volts monitor |  |
| +5 Volts monitor |  |
| _ROLL_ROT | 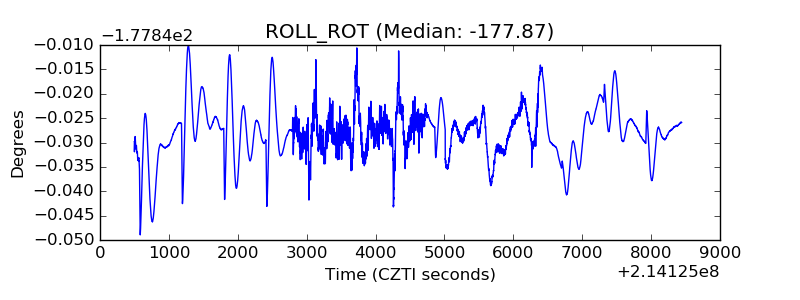 |
| _Roll_DEC | 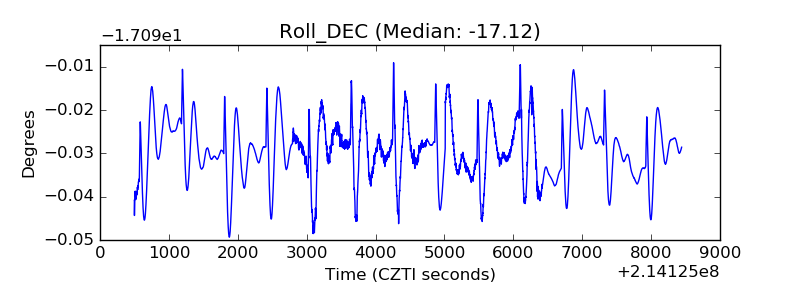 |
| _Roll_RA | 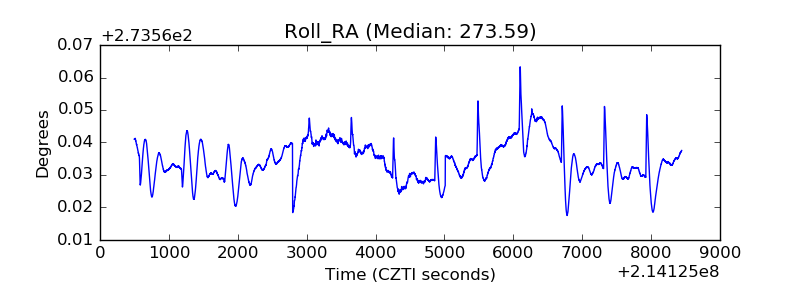 |
| Veto Counter | 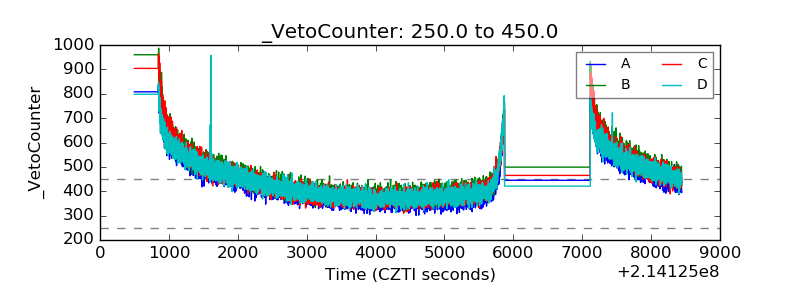 |