| Param | Original file | Final file |
|---|---|---|
| Filename | modeM0/AS1G06_032T02_9000000730_05659cztM0_level2.evt | modeM0/AS1G06_032T02_9000000730_05659cztM0_level2_quad_clean.evt |
| Size (bytes) | 272,744,640 | 60,851,520 |
| Size | 260.1 MB | 58.0 MB |
| Events in quadrant A | 1,817,521 | 402,550 |
| Events in quadrant B | 2,116,720 | 398,528 |
| Events in quadrant C | 1,840,052 | 398,719 |
| Events in quadrant D | 2,232,667 | 380,752 |
| Mode SS | |||
|---|---|---|---|
| Quadrant | BADHDUFLAG | Total packets | Discarded packets |
| A | 0 | 74 | 0 |
| B | 0 | 74 | 0 |
| C | 0 | 74 | 0 |
| D | 0 | 74 | 0 |
| Mode M0 | |||
|---|---|---|---|
| Quadrant | BADHDUFLAG | Total packets | Discarded packets |
| A | 0 | 7800 | 1 |
| B | 0 | 8768 | 1 |
| C | 0 | 7834 | 1 |
| D | 0 | 8973 | 1 |
| Mode M9 | |||
|---|---|---|---|
| Quadrant | BADHDUFLAG | Total packets | Discarded packets |
| A | 0 | 9 | 0 |
| B | 0 | 9 | 0 |
| C | 0 | 9 | 0 |
| D | 0 | 10 | 0 |
| Quadrant | Total seconds | Saturated seconds | Saturation percentage |
|---|---|---|---|
| A | 3705 | 9 | 0.242915% |
| B | 3705 | 14 | 0.377868% |
| C | 3705 | 7 | 0.188934% |
| D | 3705 | 30 | 0.809717% |
Noise dominated data is calculated using 1-second bins in cleaned event files. If a bin has >2000 counts, and if more than 50% of those come from <1% of pixels, then it is considered to be noise-dominated and hence unusable.
| Quadrant | # 1 sec bins | Bins with >0 counts | Bins with >2000 counts | High rate bins dominated by noise | Noise dominated (total time) | Noise dominated (detector-on time) | Marked lightcurve |
|---|---|---|---|---|---|---|---|
| A | 3705 | 3705 | 2 | 2 | 0.05% | 0.05% | 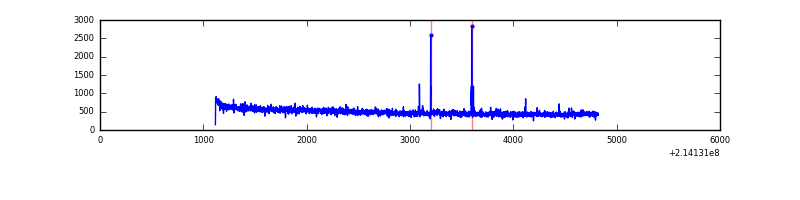 |
| B | 3705 | 3705 | 7 | 7 | 0.19% | 0.19% | 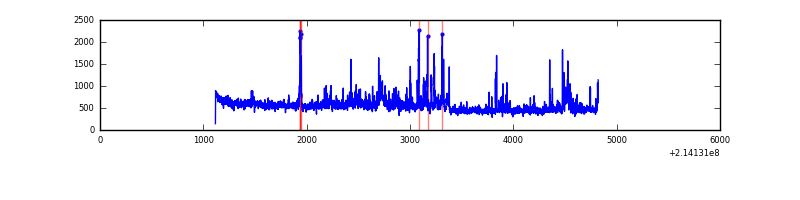 |
| C | 3705 | 3705 | 2 | 2 | 0.05% | 0.05% | 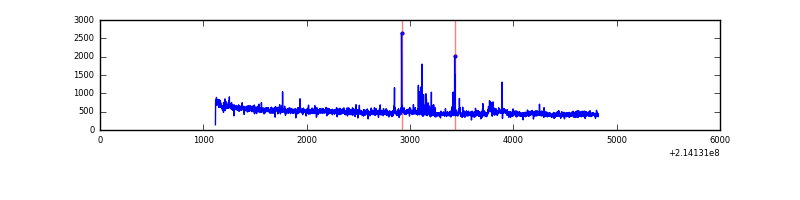 |
| D | 3705 | 3705 | 30 | 30 | 0.81% | 0.81% | 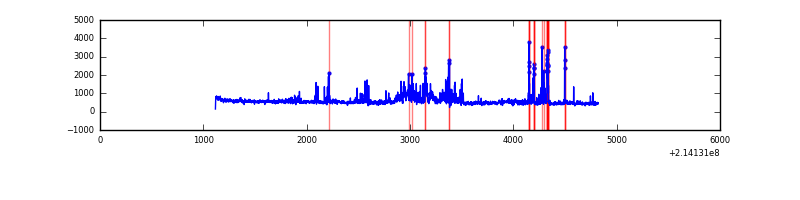 |
Top three noisy pixels from each quadrant. If the there are fewer than three noisy pixels in the level2.evt file, extra rows are filled as -1
| Pixel properties | Quadrant properties | ||||||
|---|---|---|---|---|---|---|---|
| Quadrant | DetID | PixID | Counts | Sigma | Mean | Median | Sigma |
| A | 0 | 50 | 19042 | 197.52 | 463 | 455 | 94.1 |
| A | 13 | 6 | 15772 | 162.77 | 463 | 455 | 94.1 |
| A | 0 | 226 | 4707 | 45.18 | 463 | 455 | 94.1 |
| B | 15 | 204 | 74259 | 824.14 | 459 | 448 | 89.6 |
| B | 11 | 51 | 67337 | 746.85 | 459 | 448 | 89.6 |
| B | 0 | 219 | 56981 | 631.22 | 459 | 448 | 89.6 |
| C | 1 | 16 | 94204 | 926.42 | 438 | 441 | 101.2 |
| C | 5 | 250 | 27889 | 271.2 | 438 | 441 | 101.2 |
| C | 5 | 233 | 4638 | 41.47 | 438 | 441 | 101.2 |
| D | 10 | 231 | 123913 | 1124.78 | 444 | 430 | 109.8 |
| D | 12 | 17 | 105470 | 956.78 | 444 | 430 | 109.8 |
| D | 2 | 152 | 80612 | 730.36 | 444 | 430 | 109.8 |
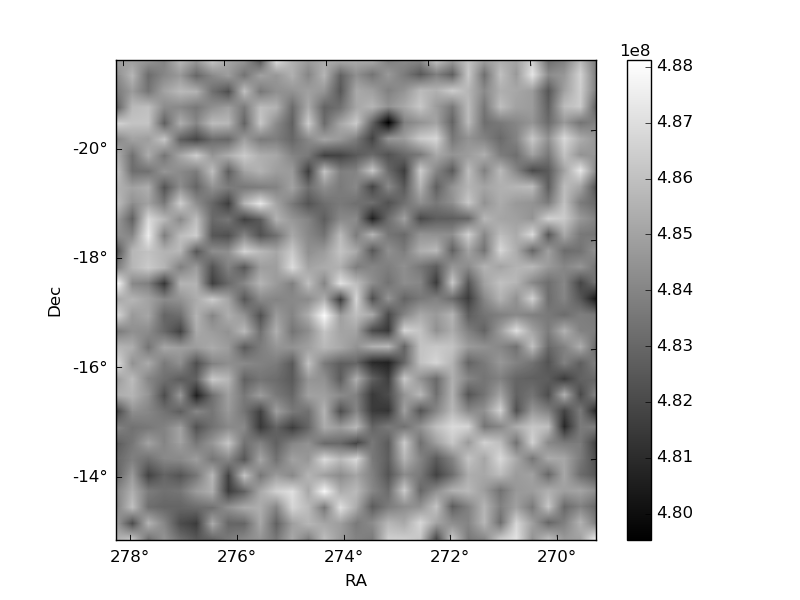
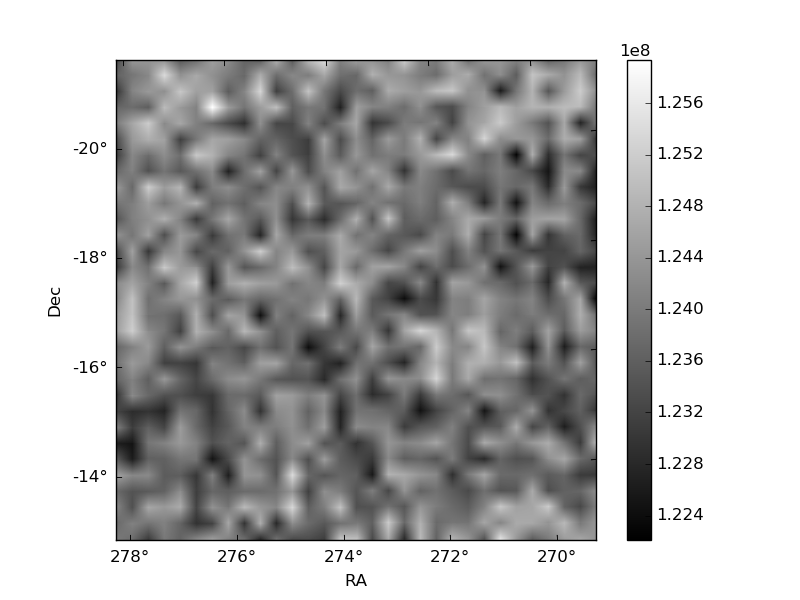
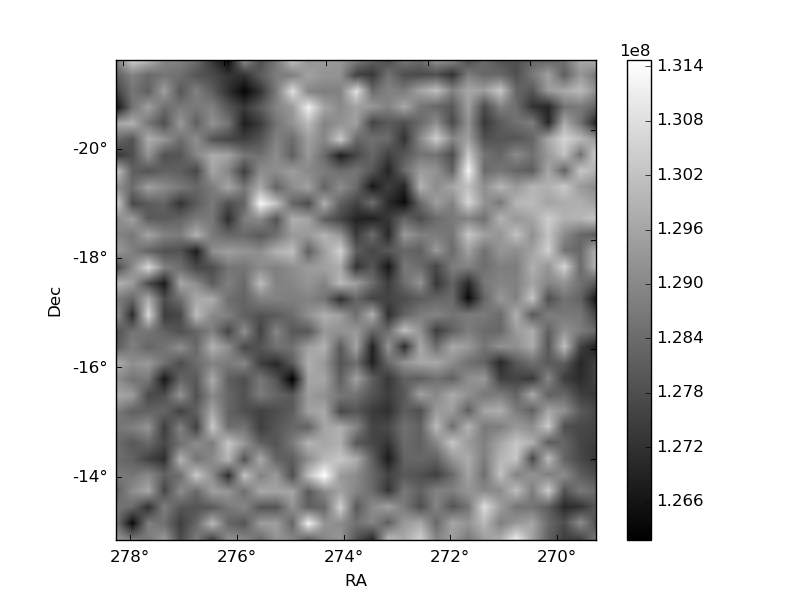
Histogram calculated using DETX and DETY for each event in the final _common_clean file
| Quadrant A | 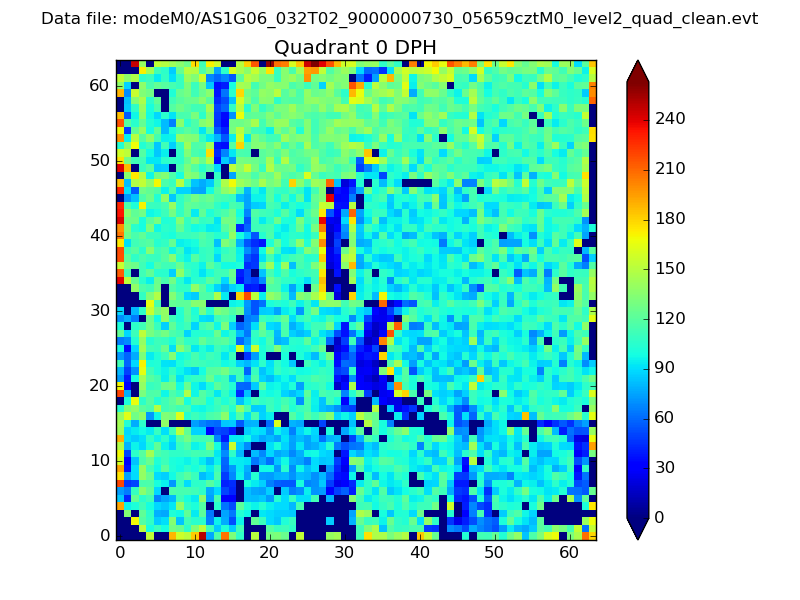 |
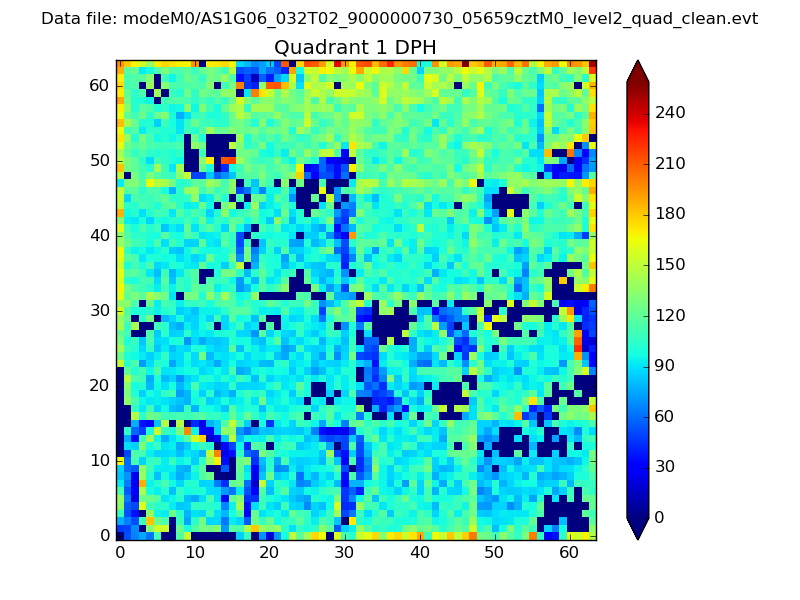 |
Quadrant B |
|---|---|---|---|
| Quadrant D | 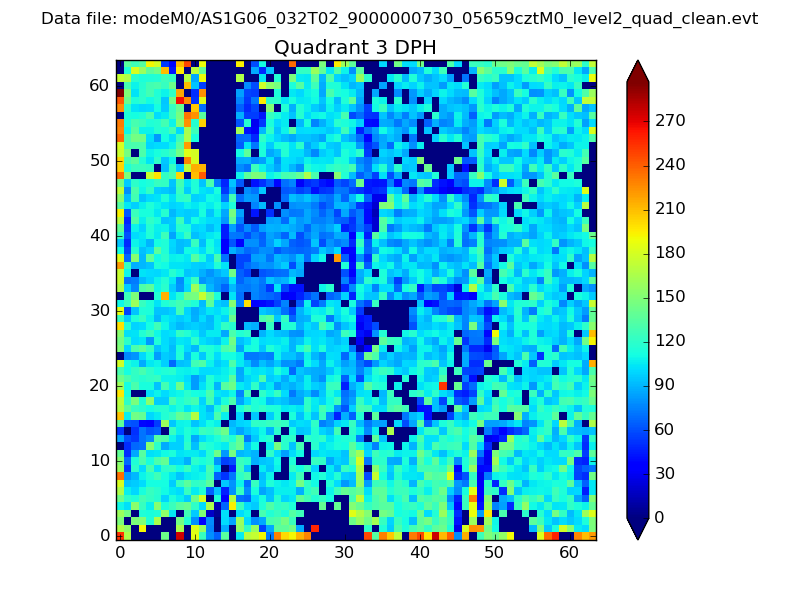 |
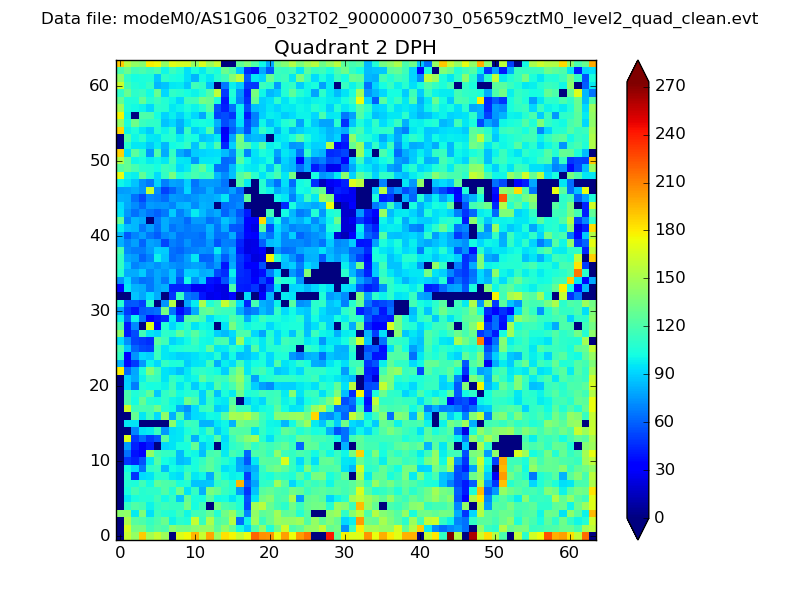 |
Quadrant C |
| Plot type | Count rate plots | Images |
|---|---|---|
| Comparison with Poisson distribution Blue bars denote a histogram of data divided into 1 sec bins. Red curve is a Poisson curve with rate = median count rate of data. |
 |
 |
| Quadrant-wise count rates Data is divided into 100 sec bins |
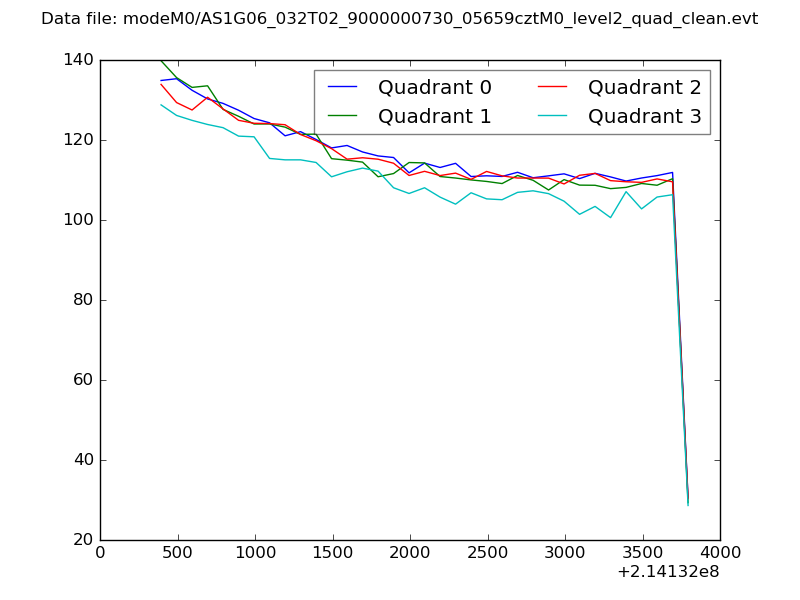 |
|
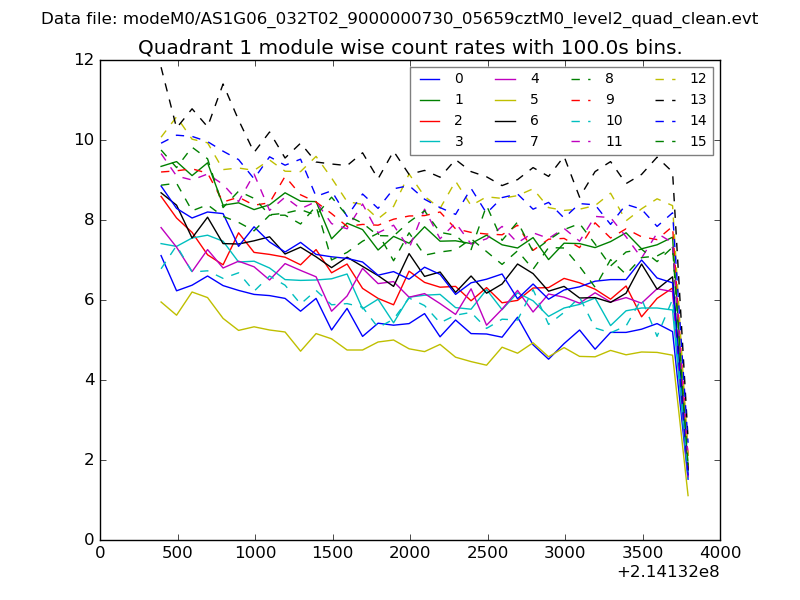
| Module-wise count rates for Quadrant A Data is divided into 100 sec bins |
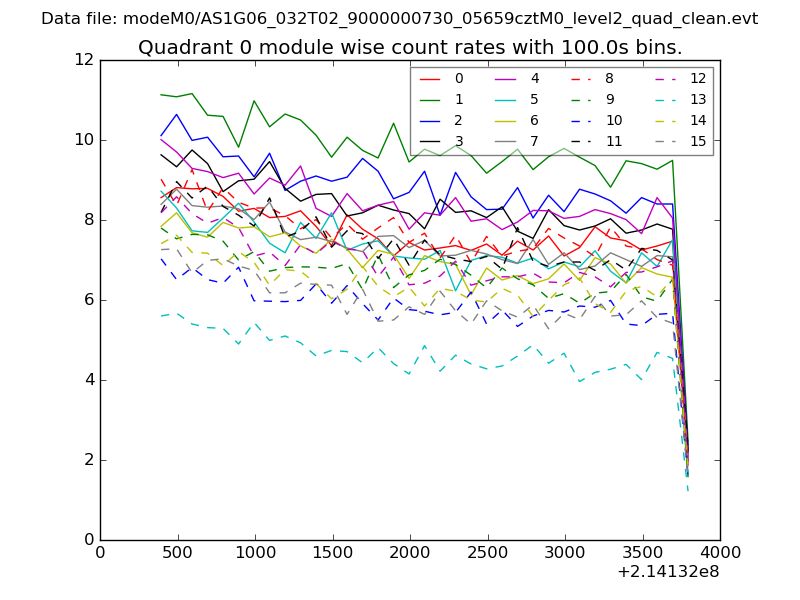 |
 |
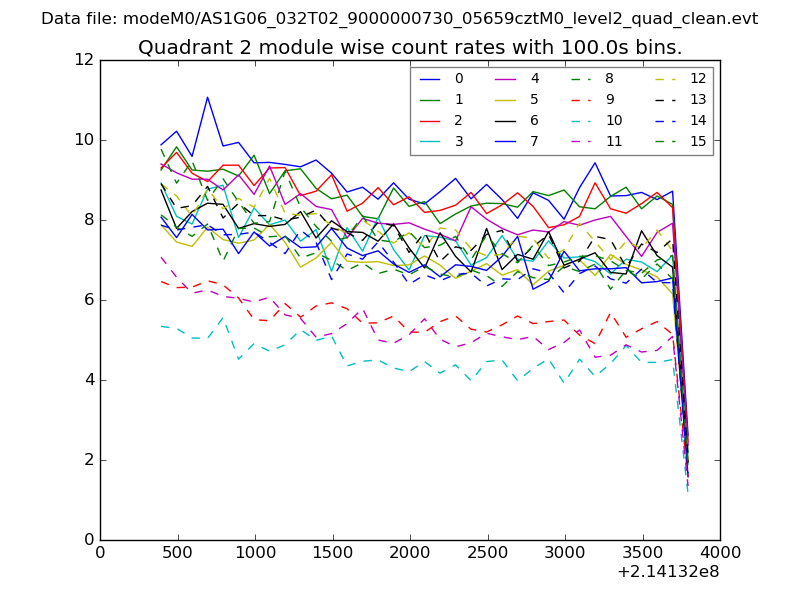
| Module-wise count rates for Quadrant B Data is divided into 100 sec bins |
 |
 |
| Module-wise count rates for Quadrant C Data is divided into 100 sec bins |
 |
 |
| Module-wise count rates for Quadrant D Data is divided into 100 sec bins |
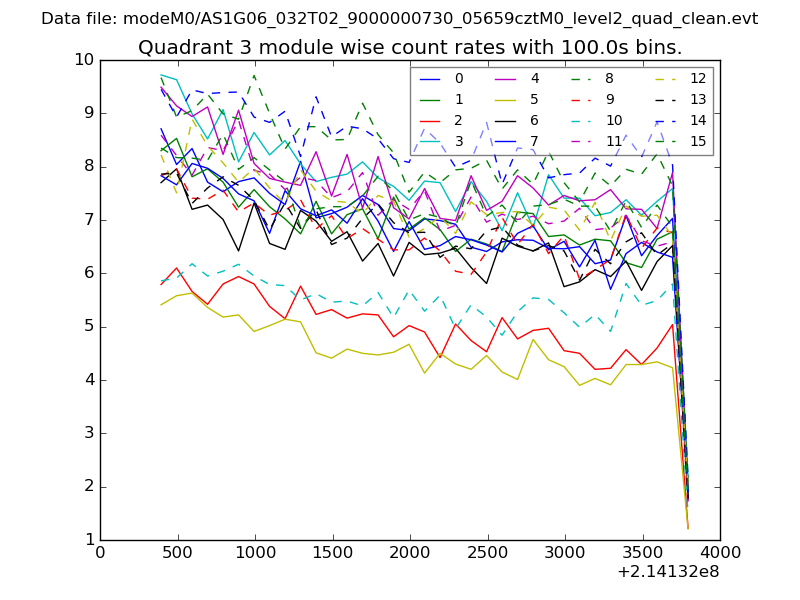 |
 |
| Parameter | Plot |
|---|---|
| CZT HV Monitor | 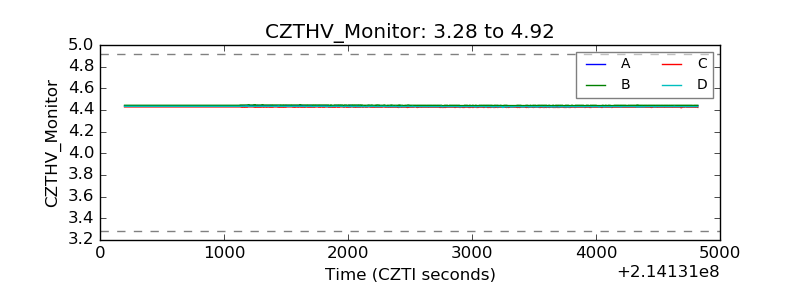 |
| D_VDD | 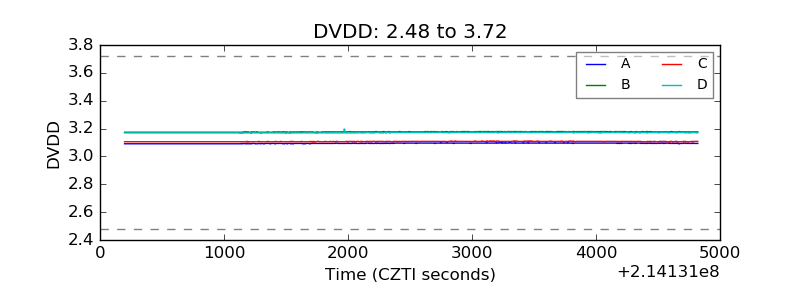 |
| Temperature 1 | 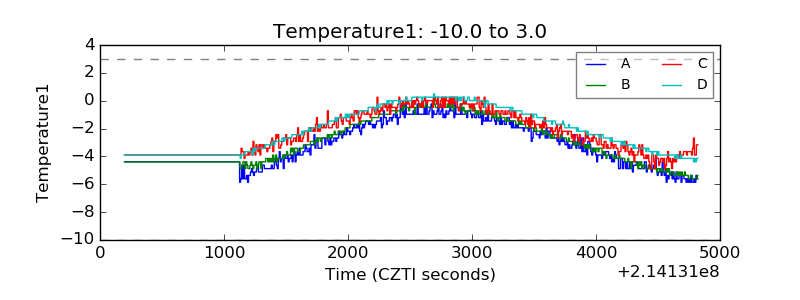 |
| Veto HV Monitor | 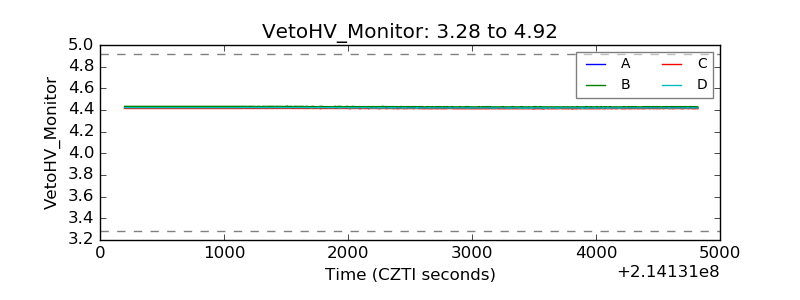 |
| Veto LLD | 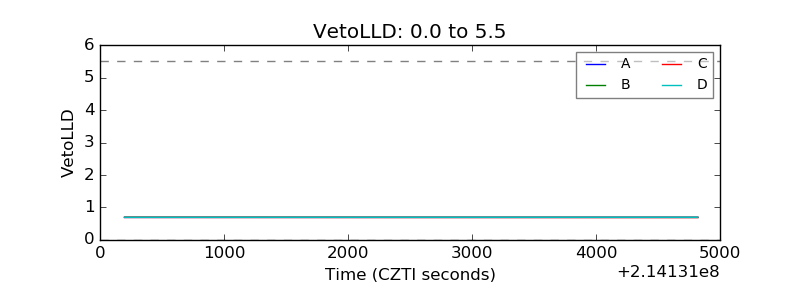 |
| Alpha Counter | 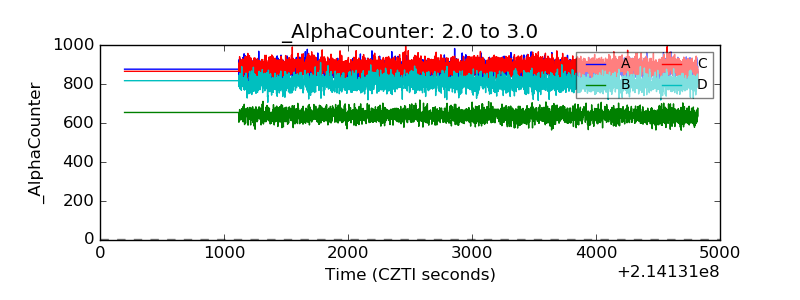 |
| _CPM_Rate | 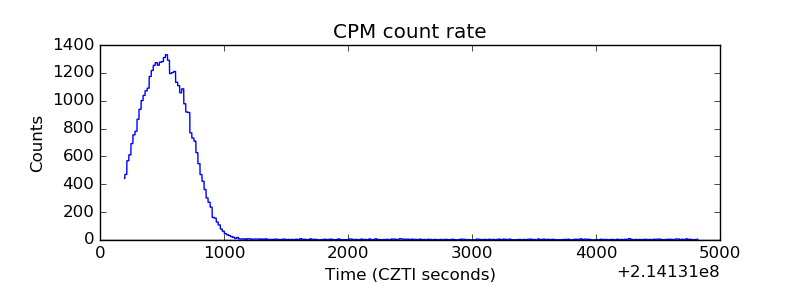 |
| CZT Counter | 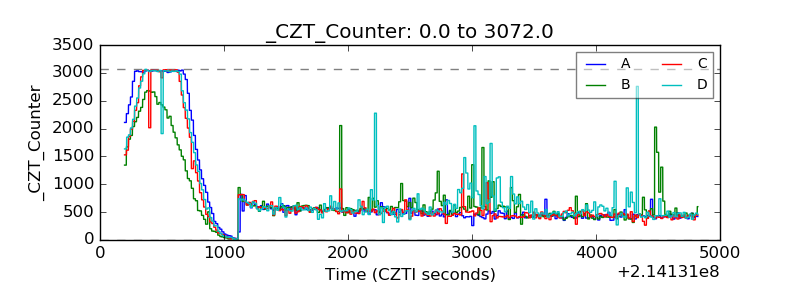 |
| +2.5 Volts monitor |  |
| +5 Volts monitor |  |
| _ROLL_ROT | 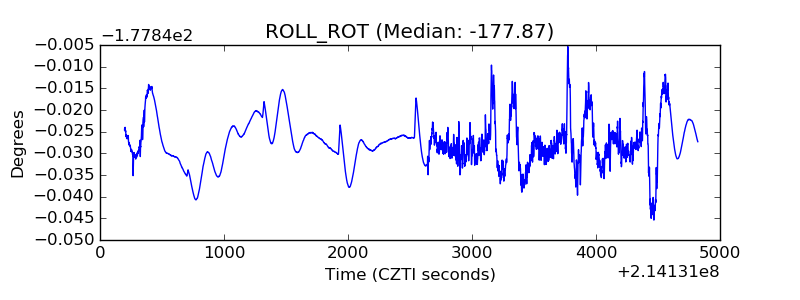 |
| _Roll_DEC | 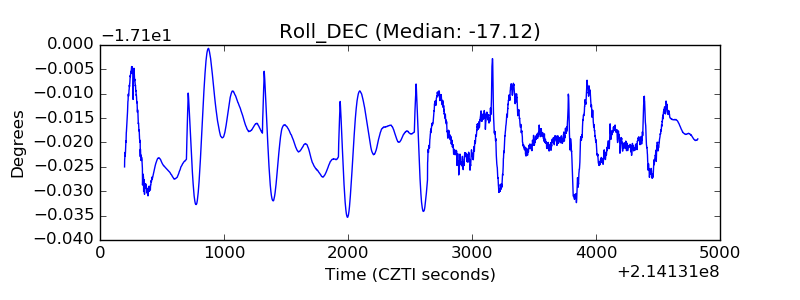 |
| _Roll_RA | 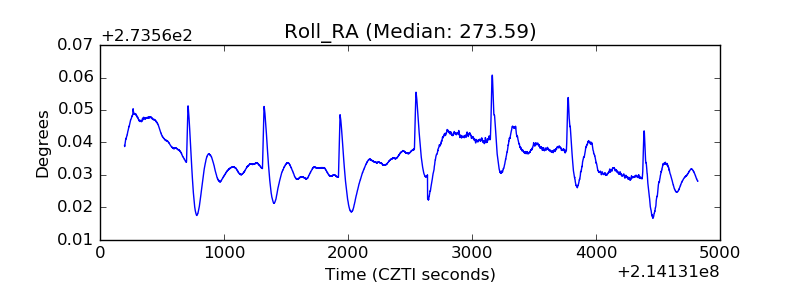 |
| Veto Counter | 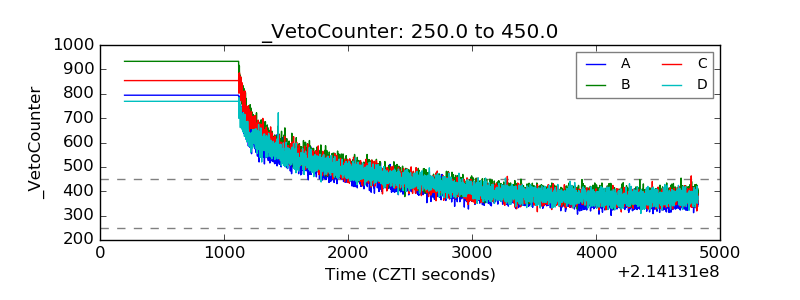 |