| Param | Original file | Final file |
|---|---|---|
| Filename | modeM0/AS1G06_132T01_9000000728cztM0_level2.fits | modeM0/AS1G06_132T01_9000000728cztM0_level2_quad_clean.evt |
| Size (bytes) | 69,125,760 | 46,699,200 |
| Size | 65.9 MB | 44.5 MB |
| Events in quadrant A | 410,193 | 229,190 |
| Events in quadrant B | 392,105 | 221,197 |
| Events in quadrant C | 403,212 | 219,776 |
| Events in quadrant D | 345,114 | 203,034 |
| Mode M0 | |||
|---|---|---|---|
| Quadrant | BADHDUFLAG | Total packets | Discarded packets |
| A | 0 | 15665 | 0 |
| B | 0 | 16482 | 0 |
| C | 0 | 15717 | 0 |
| D | 0 | 16548 | 0 |
| Mode M9 | |||
|---|---|---|---|
| Quadrant | BADHDUFLAG | Total packets | Discarded packets |
| A | 0 | 17 | 0 |
| B | 0 | 17 | 0 |
| C | 0 | 16 | 0 |
| D | 0 | 17 | 0 |
| Mode SS | |||
|---|---|---|---|
| Quadrant | BADHDUFLAG | Total packets | Discarded packets |
| A | 0 | 166 | 0 |
| B | 0 | 192 | 0 |
| C | 0 | 226 | 0 |
| D | 0 | 196 | 0 |
| Quadrant | Total seconds | Saturated seconds | Saturation percentage |
|---|---|---|---|
| A | 7678 | 60 | 0.781454% |
| B | 7589 | 77 | 1.014626% |
| C | 7699 | 18 | 0.233797% |
| D | 7570 | 43 | 0.568032% |
Noise dominated data is calculated using 1-second bins in cleaned event files. If a bin has >2000 counts, and if more than 50% of those come from <1% of pixels, then it is considered to be noise-dominated and hence unusable.
| Quadrant | # 1 sec bins | Bins with >0 counts | Bins with >2000 counts | High rate bins dominated by noise | Noise dominated (total time) | Noise dominated (detector-on time) | Marked lightcurve |
|---|---|---|---|---|---|---|---|
| A | 16855 | 9729 | 0 | 0 | 0.00% | 0.00% |  |
| B | 16853 | 9620 | 0 | 0 | 0.00% | 0.00% |  |
| C | 16855 | 9723 | 0 | 0 | 0.00% | 0.00% | 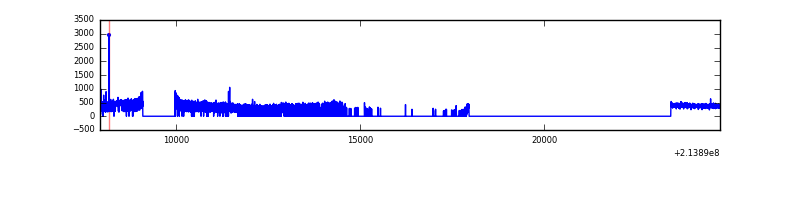 |
| D | 16855 | 9602 | 0 | 0 | 0.00% | 0.00% |  |
Top three noisy pixels from each quadrant. If the there are fewer than three noisy pixels in the level2.evt file, extra rows are filled as -1
| Pixel properties | Quadrant properties | ||||||
|---|---|---|---|---|---|---|---|
| Quadrant | DetID | PixID | Counts | Sigma | Mean | Median | Sigma |
| A | 0 | 29 | 417 | 10.51 | 106 | 99 | 30.3 |
| A | 7 | 110 | 361 | 8.66 | 106 | 99 | 30.3 |
| A | 0 | 30 | 315 | 7.14 | 106 | 99 | 30.3 |
| B | 2 | 9 | 324 | 9.7 | 103 | 98 | 23.3 |
| B | 5 | 128 | 295 | 8.45 | 103 | 98 | 23.3 |
| B | 5 | 225 | 271 | 7.42 | 103 | 98 | 23.3 |
| C | 12 | 241 | 286 | 6.22 | 106 | 99 | 30.1 |
| C | 1 | 80 | 273 | 5.78 | 106 | 99 | 30.1 |
| C | 1 | 65 | 270 | 5.68 | 106 | 99 | 30.1 |
| D | 11 | 82 | 288 | 7.22 | 98 | 89 | 27.6 |
| D | 3 | 31 | 266 | 6.42 | 98 | 89 | 27.6 |
| D | 3 | 14 | 261 | 6.24 | 98 | 89 | 27.6 |
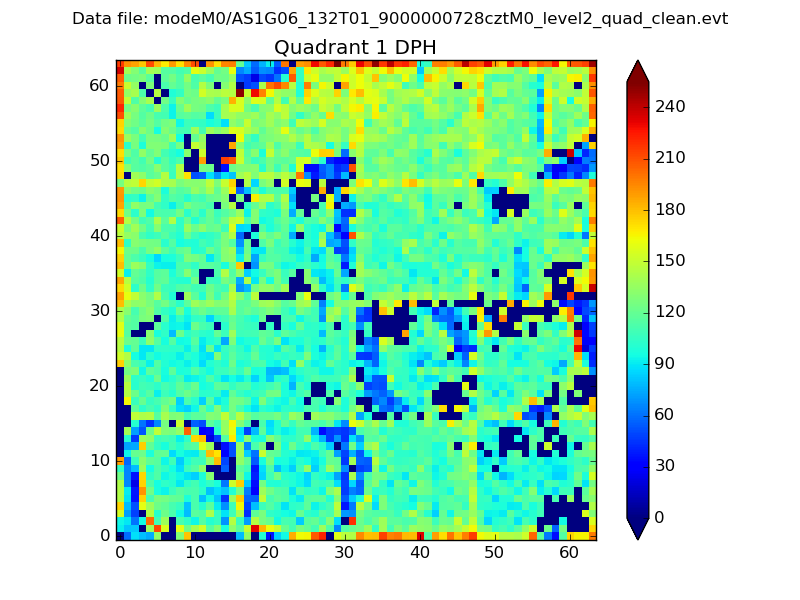
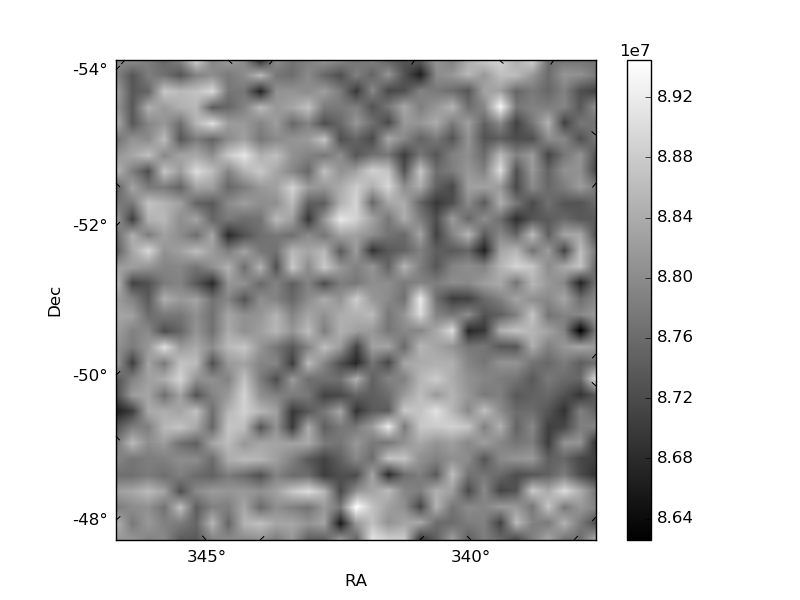
Histogram calculated using DETX and DETY for each event in the final _common_clean file
| Quadrant A |  |
 |
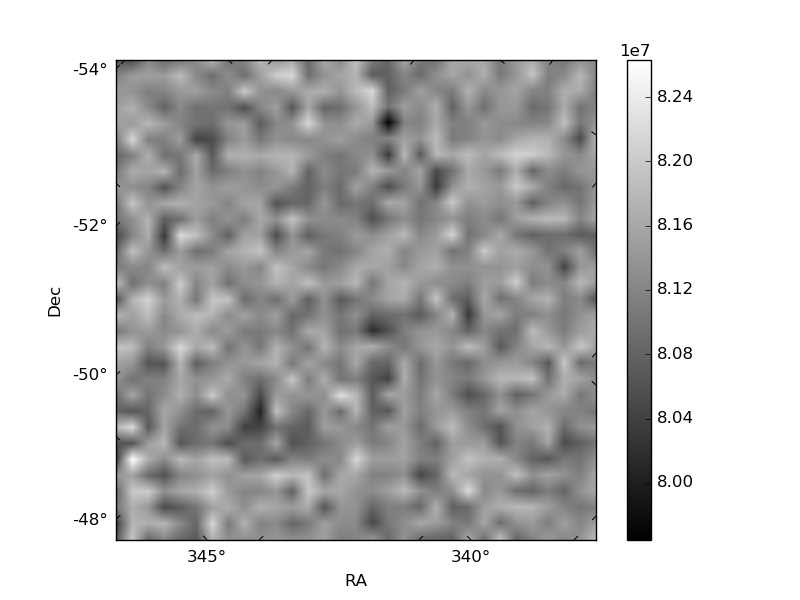
Quadrant B |
|---|---|---|---|
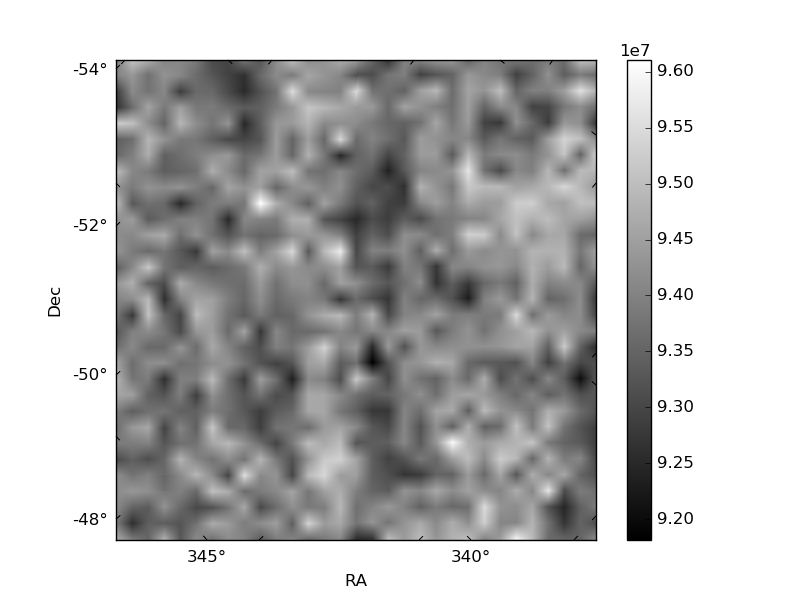
| Quadrant D | 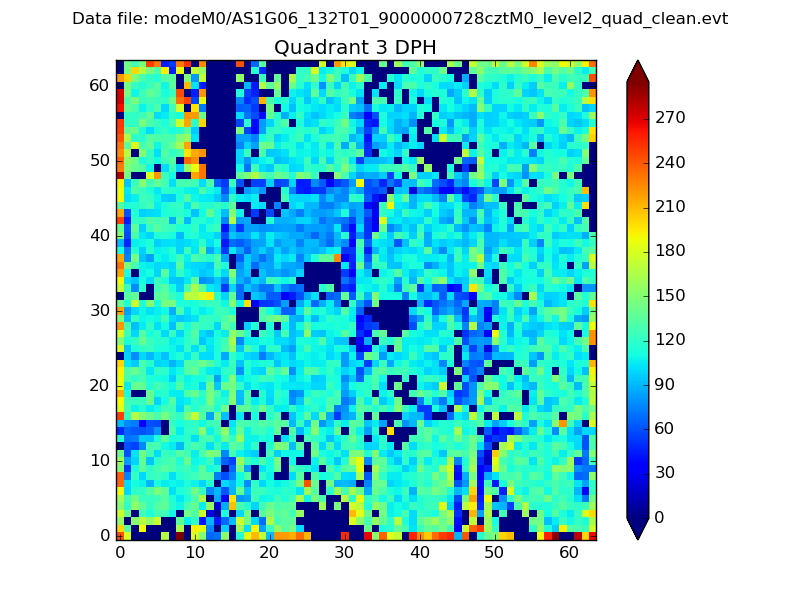 |
 |
Quadrant C |
| Plot type | Count rate plots | Images |
|---|---|---|
| Comparison with Poisson distribution Blue bars denote a histogram of data divided into 1 sec bins. Red curve is a Poisson curve with rate = median count rate of data. |
 |
 |
| Quadrant-wise count rates Data is divided into 100 sec bins |
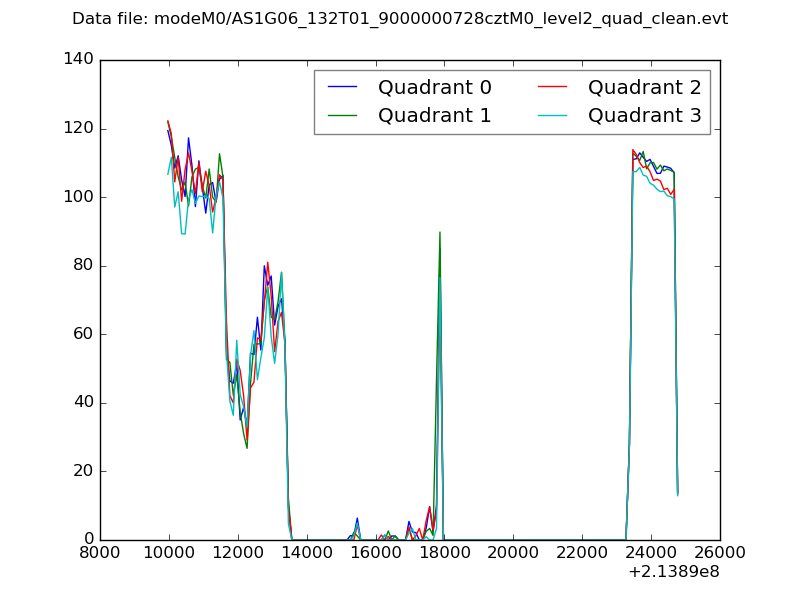 |
|
| Module-wise count rates for Quadrant A Data is divided into 100 sec bins |
 |
 |
| Module-wise count rates for Quadrant B Data is divided into 100 sec bins |
 |
 |
| Module-wise count rates for Quadrant C Data is divided into 100 sec bins |
 |
 |
| Module-wise count rates for Quadrant D Data is divided into 100 sec bins |
 |
 |
| Parameter | Plot |
|---|---|
| CZT HV Monitor |  |
| D_VDD |  |
| Temperature 1 | 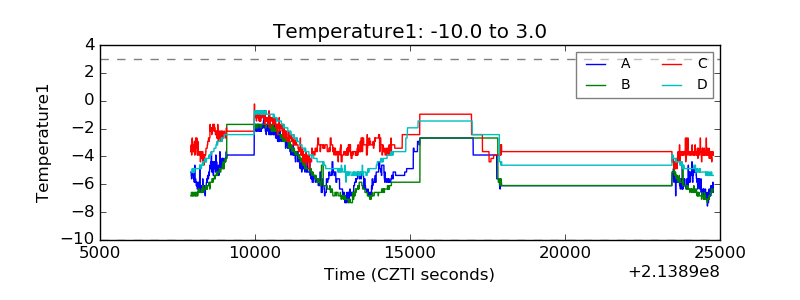 |
| Veto HV Monitor |  |
| Veto LLD |  |
| Alpha Counter | 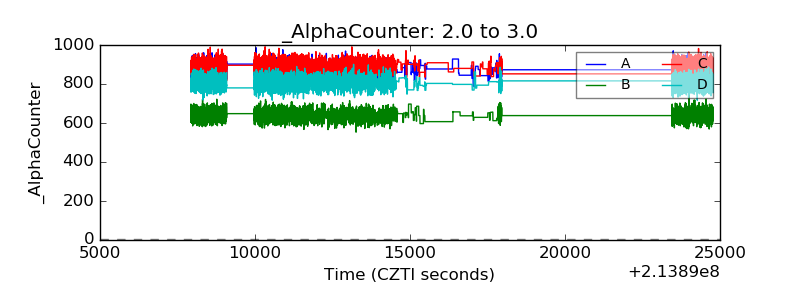 |
| _CPM_Rate |  |
| CZT Counter |  |
| +2.5 Volts monitor | 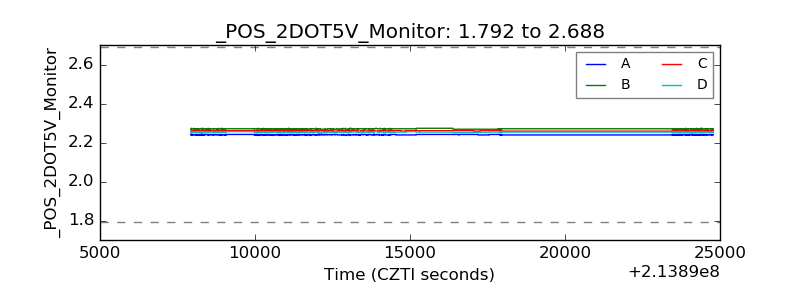 |
| +5 Volts monitor | 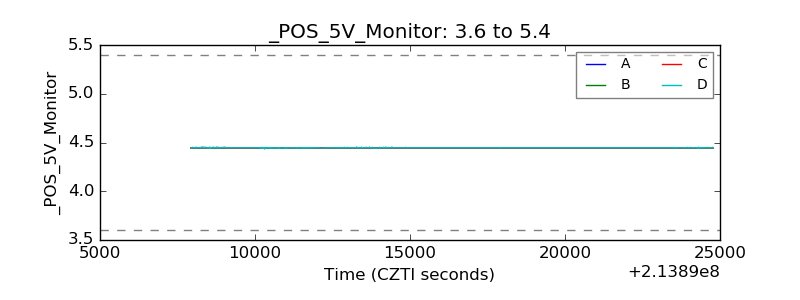 |
| _ROLL_ROT |  |
| _Roll_DEC |  |
| _Roll_RA |  |
| Veto Counter | 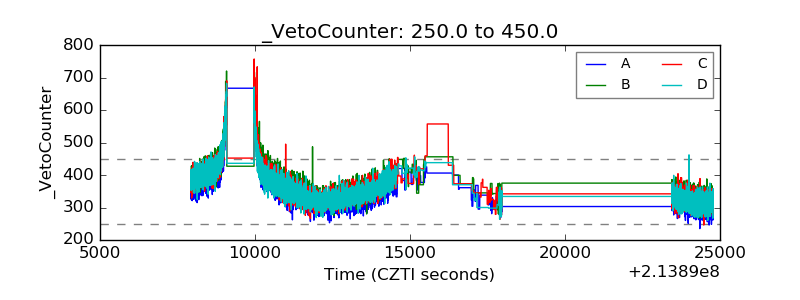 |