| Param | Original file | Final file |
|---|---|---|
| Filename | modeM0/AS1G06_132T01_9000000728_05619cztM0_level2.evt | modeM0/AS1G06_132T01_9000000728_05619cztM0_level2_quad_clean.evt |
| Size (bytes) | 125,544,960 | 25,632,000 |
| Size | 119.7 MB | 24.4 MB |
| Events in quadrant A | 901,064 | 164,351 |
| Events in quadrant B | 975,963 | 151,069 |
| Events in quadrant C | 871,399 | 157,861 |
| Events in quadrant D | 904,646 | 147,156 |
| Mode M0 | |||
|---|---|---|---|
| Quadrant | BADHDUFLAG | Total packets | Discarded packets |
| A | 0 | 14352 | 9972 |
| B | 0 | 15555 | 11274 |
| C | 0 | 14329 | 10032 |
| D | 0 | 15436 | 11141 |
| Mode M9 | |||
|---|---|---|---|
| Quadrant | BADHDUFLAG | Total packets | Discarded packets |
| A | 0 | 5 | 5 |
| B | 0 | 6 | 6 |
| C | 0 | 5 | 5 |
| D | 0 | 6 | 6 |
| Mode SS | |||
|---|---|---|---|
| Quadrant | BADHDUFLAG | Total packets | Discarded packets |
| A | 0 | 143 | 95 |
| B | 0 | 142 | 100 |
| C | 0 | 144 | 98 |
| D | 0 | 140 | 106 |
| Quadrant | Total seconds | Saturated seconds | Saturation percentage |
|---|---|---|---|
| A | 2189 | 2 | 0.091366% |
| B | 2065 | 1 | 0.048426% |
| C | 2145 | 2 | 0.093240% |
| D | 2090 | 1 | 0.047847% |
Noise dominated data is calculated using 1-second bins in cleaned event files. If a bin has >2000 counts, and if more than 50% of those come from <1% of pixels, then it is considered to be noise-dominated and hence unusable.
| Quadrant | # 1 sec bins | Bins with >0 counts | Bins with >2000 counts | High rate bins dominated by noise | Noise dominated (total time) | Noise dominated (detector-on time) | Marked lightcurve |
|---|---|---|---|---|---|---|---|
| A | 7680 | 3248 | 0 | 0 | 0.00% | 0.00% |  |
| B | 7635 | 3088 | 0 | 0 | 0.00% | 0.00% | 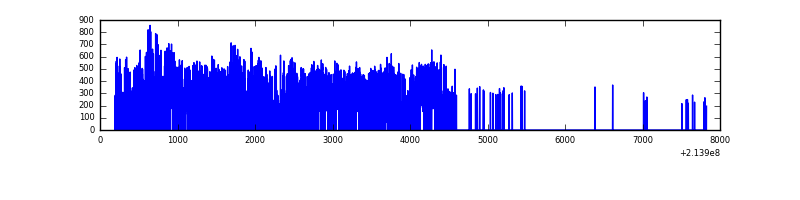 |
| C | 7697 | 3216 | 0 | 0 | 0.00% | 0.00% |  |
| D | 7687 | 3115 | 0 | 0 | 0.00% | 0.00% | 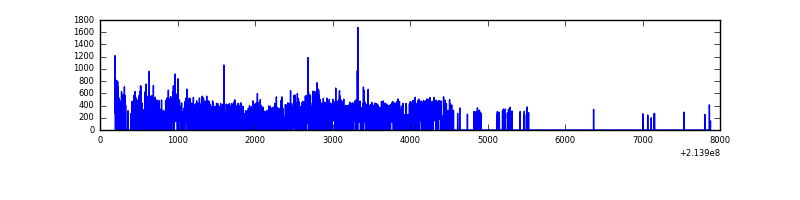 |
Top three noisy pixels from each quadrant. If the there are fewer than three noisy pixels in the level2.evt file, extra rows are filled as -1
| Pixel properties | Quadrant properties | ||||||
|---|---|---|---|---|---|---|---|
| Quadrant | DetID | PixID | Counts | Sigma | Mean | Median | Sigma |
| A | 0 | 226 | 2303 | 42.4 | 232 | 228 | 48.9 |
| A | 12 | 194 | 2225 | 40.8 | 232 | 228 | 48.9 |
| A | 14 | 31 | 1976 | 35.72 | 232 | 228 | 48.9 |
| B | 15 | 204 | 65270 | 1477.85 | 222 | 217 | 44.0 |
| B | 0 | 219 | 32528 | 734.03 | 222 | 217 | 44.0 |
| B | 0 | 214 | 9023 | 200.05 | 222 | 217 | 44.0 |
| C | 8 | 128 | 5311 | 97.08 | 219 | 221 | 52.4 |
| C | 1 | 16 | 3703 | 66.41 | 219 | 221 | 52.4 |
| C | 8 | 112 | 2668 | 46.67 | 219 | 221 | 52.4 |
| D | 2 | 136 | 31287 | 585.44 | 212 | 205 | 53.1 |
| D | 10 | 15 | 30718 | 574.73 | 212 | 205 | 53.1 |
| D | 8 | 195 | 13357 | 247.72 | 212 | 205 | 53.1 |
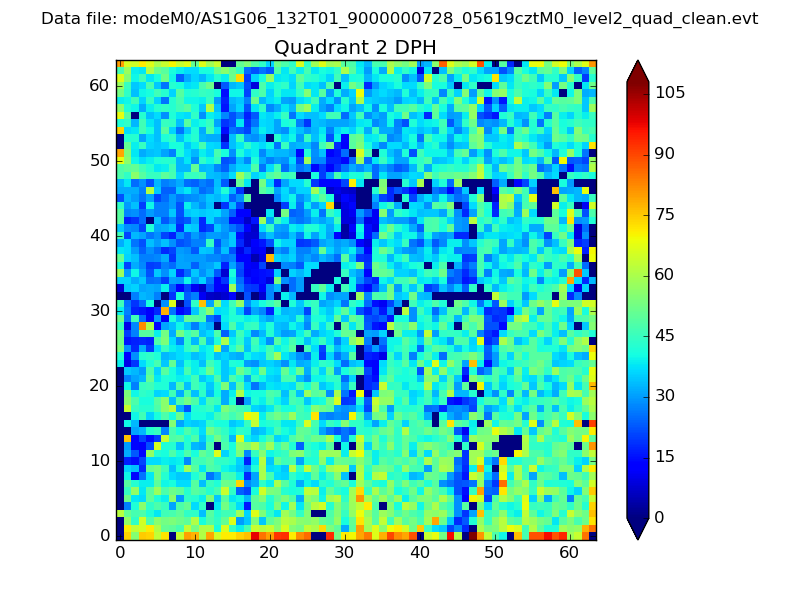
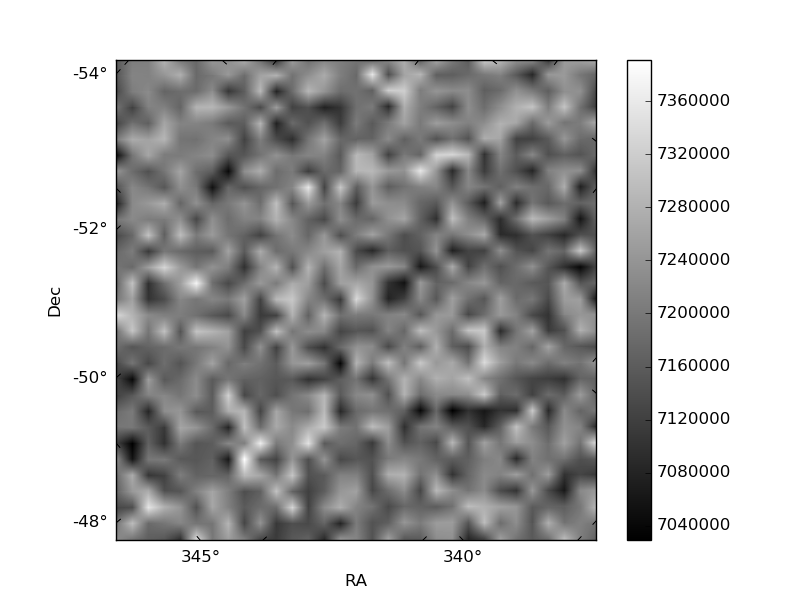
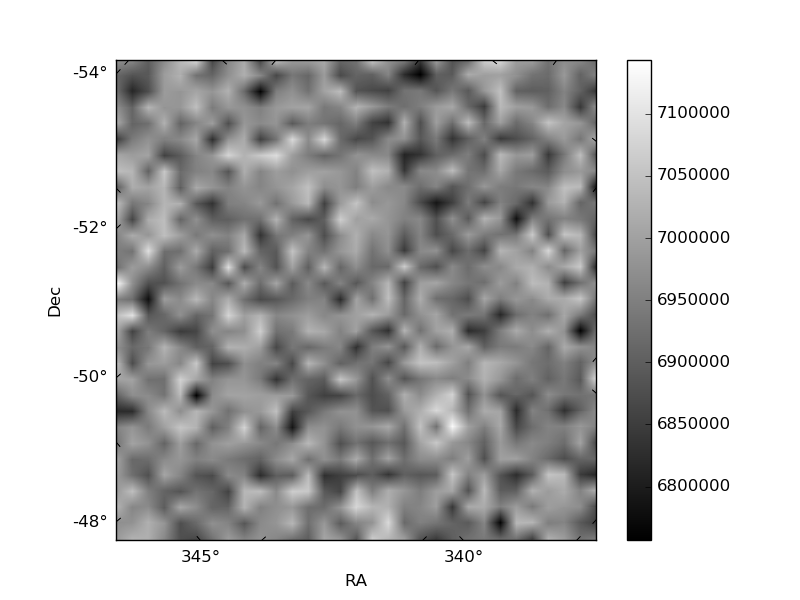
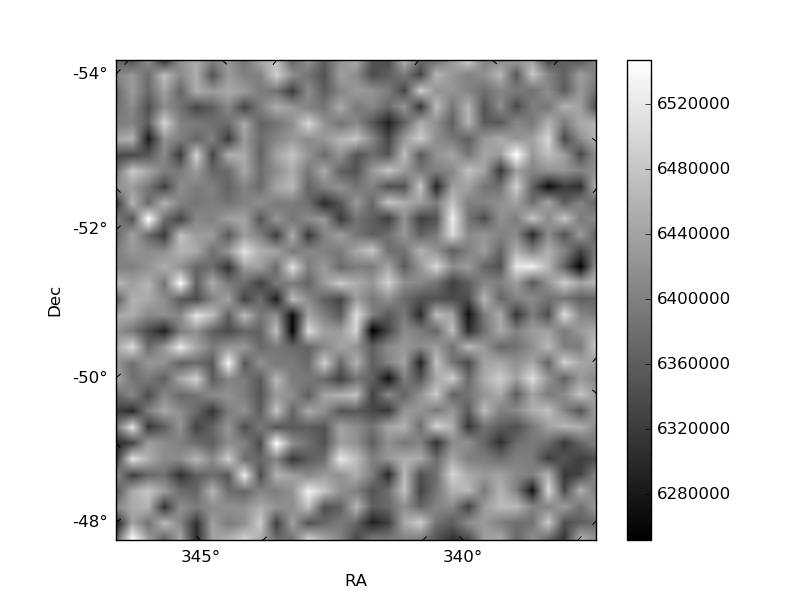
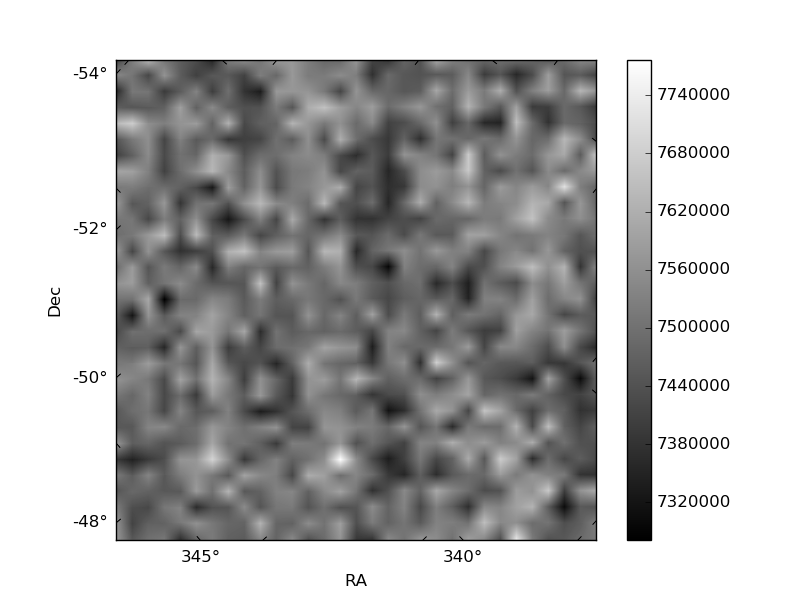
Histogram calculated using DETX and DETY for each event in the final _common_clean file
| Quadrant A | 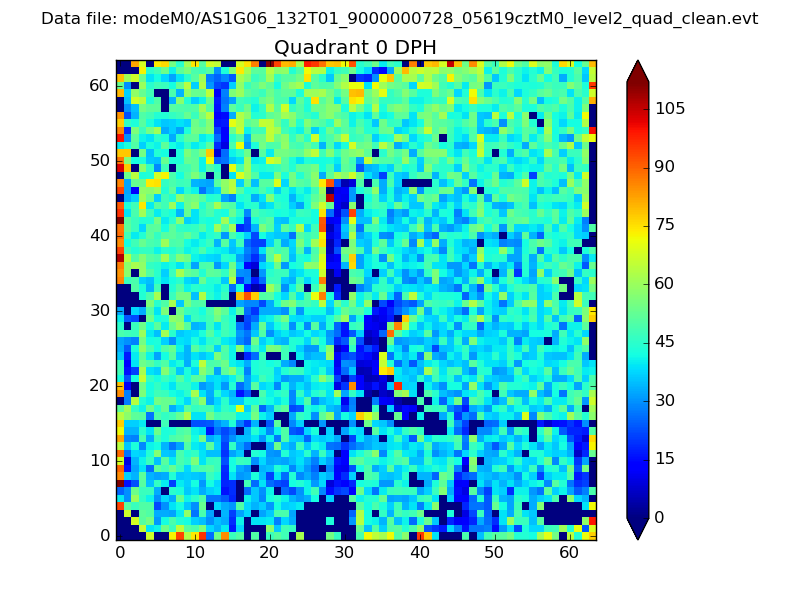 |
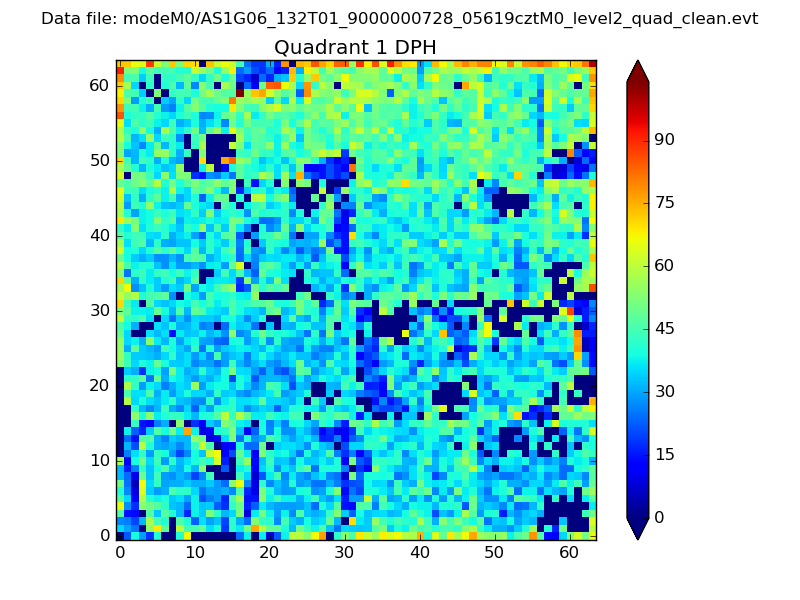 |
Quadrant B |
|---|---|---|---|
| Quadrant D | 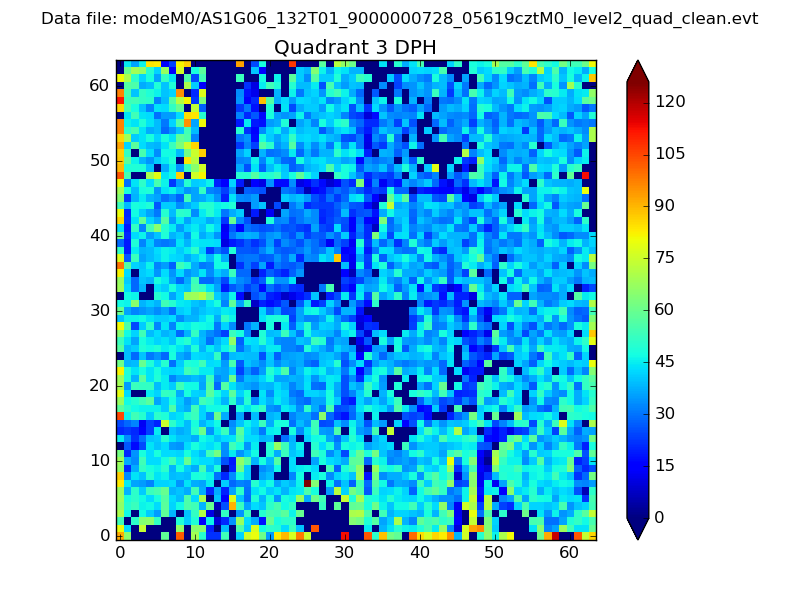 |
 |
Quadrant C |
| Plot type | Count rate plots | Images |
|---|---|---|
| Comparison with Poisson distribution Blue bars denote a histogram of data divided into 1 sec bins. Red curve is a Poisson curve with rate = median count rate of data. |
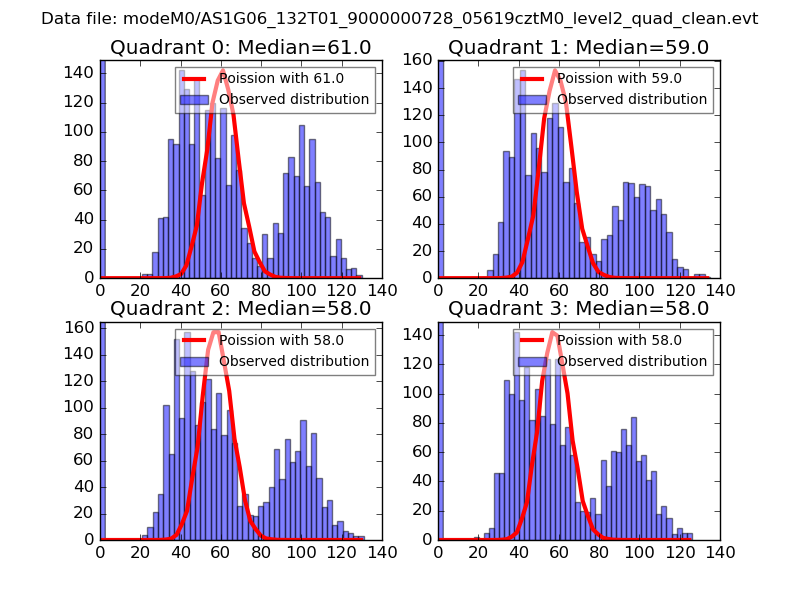 |
 |
| Quadrant-wise count rates Data is divided into 100 sec bins |
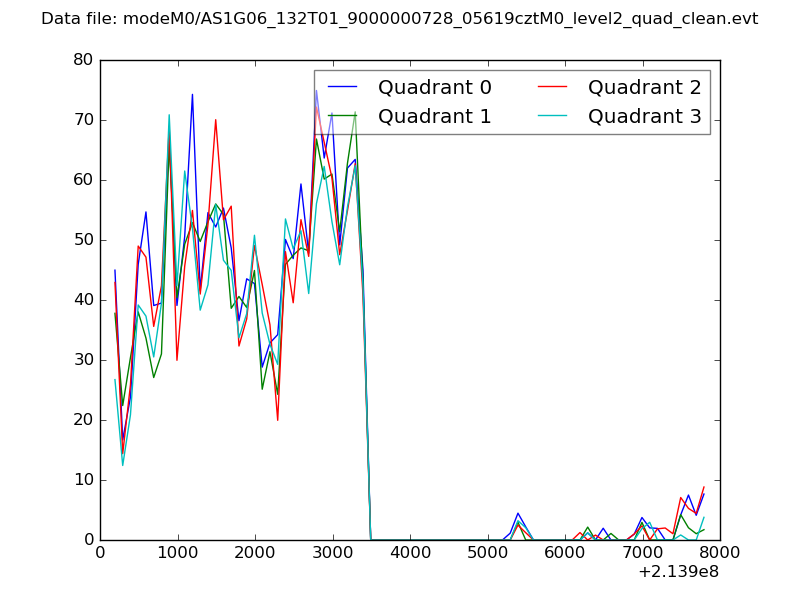 |
|
| Module-wise count rates for Quadrant A Data is divided into 100 sec bins |
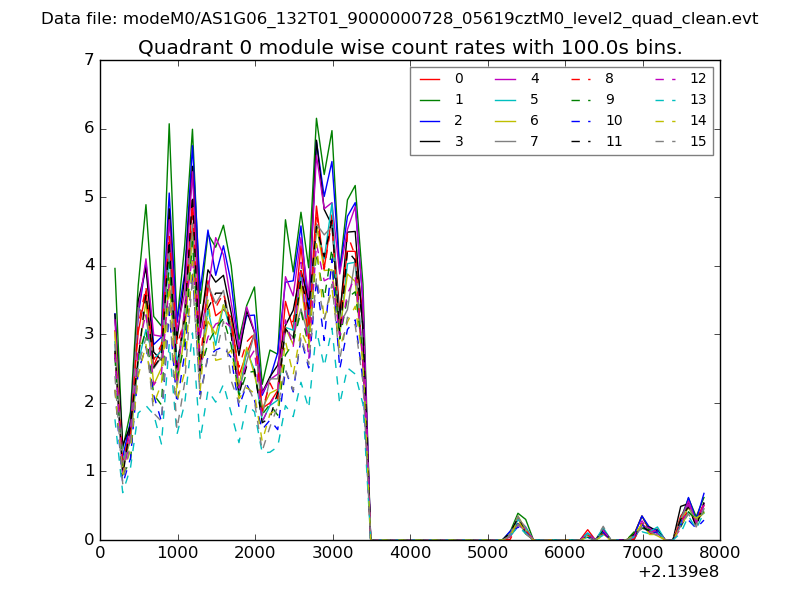 |
 |
| Module-wise count rates for Quadrant B Data is divided into 100 sec bins |
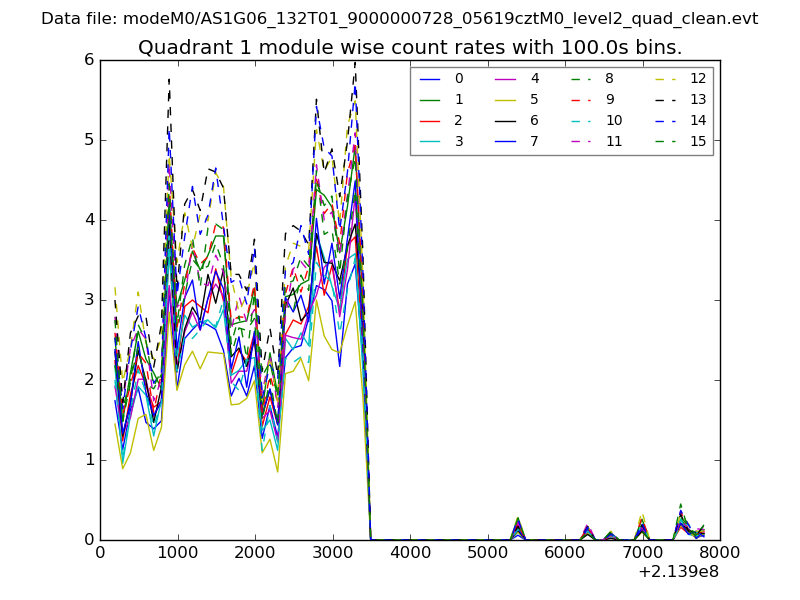 |
 |
| Module-wise count rates for Quadrant C Data is divided into 100 sec bins |
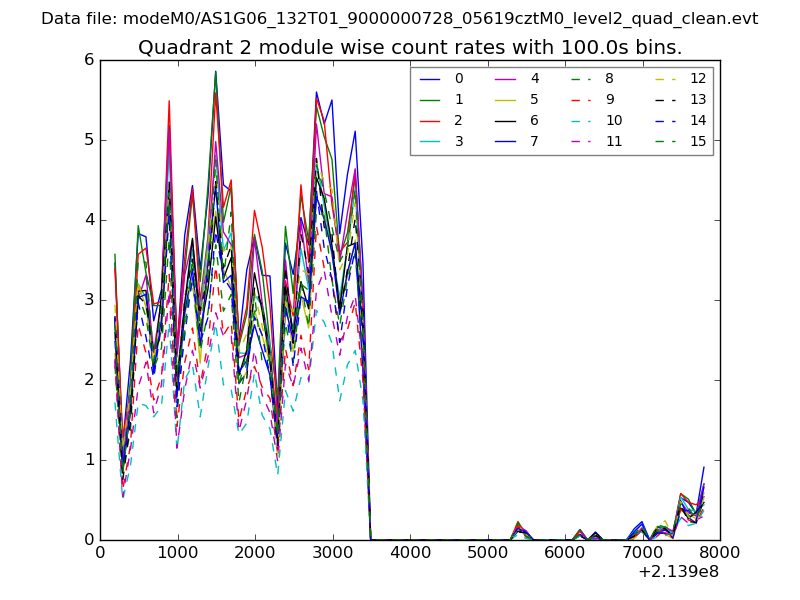 |
 |
| Module-wise count rates for Quadrant D Data is divided into 100 sec bins |
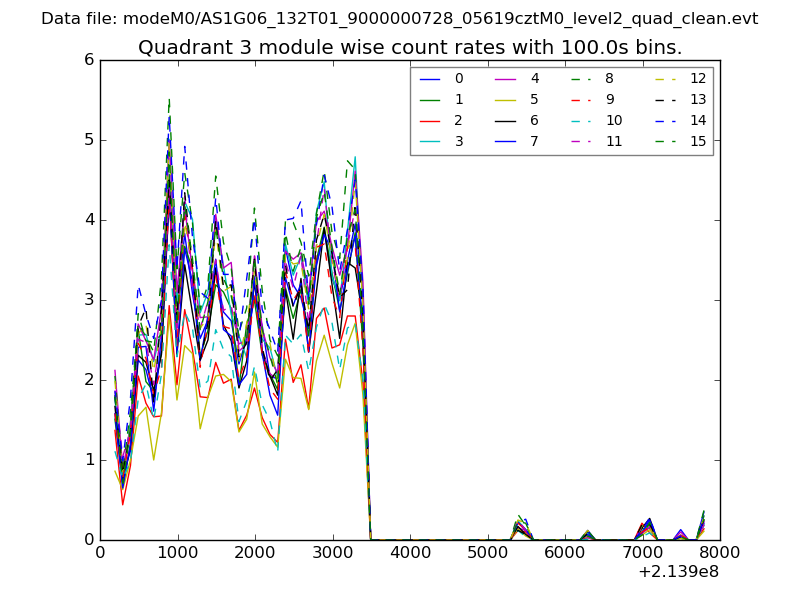 |
 |
| Parameter | Plot |
|---|---|
| CZT HV Monitor | 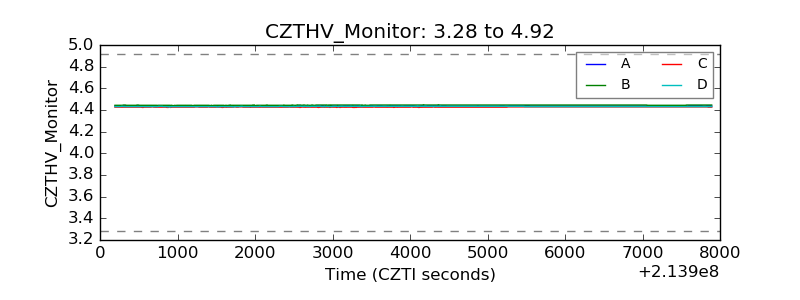 |
| D_VDD | 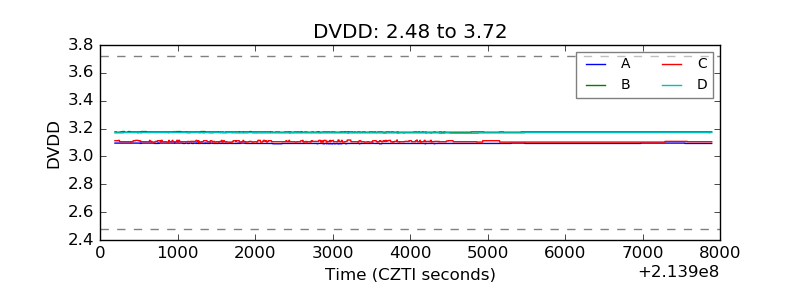 |
| Temperature 1 | 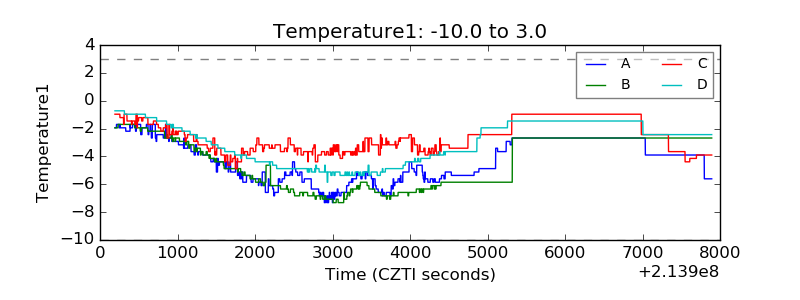 |
| Veto HV Monitor | 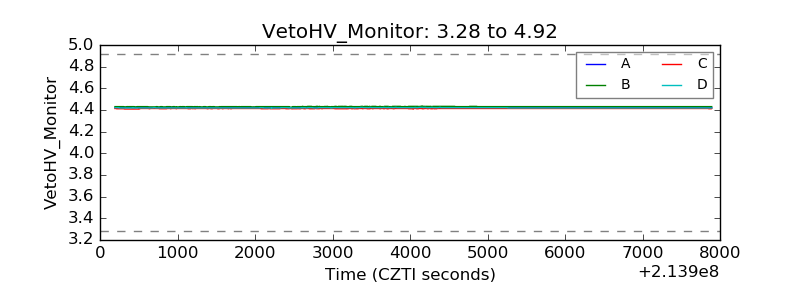 |
| Veto LLD | 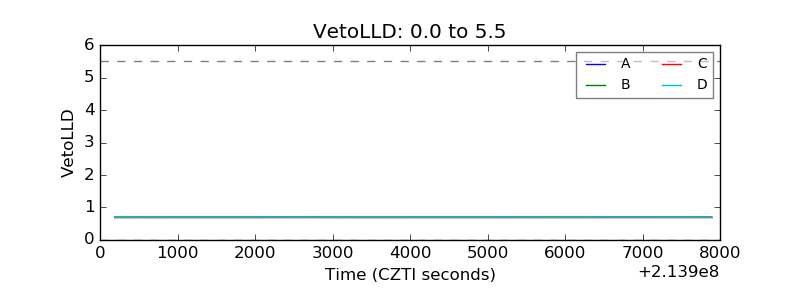 |
| Alpha Counter | 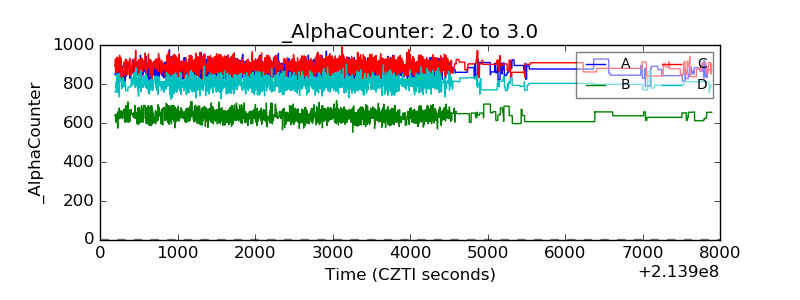 |
| _CPM_Rate | 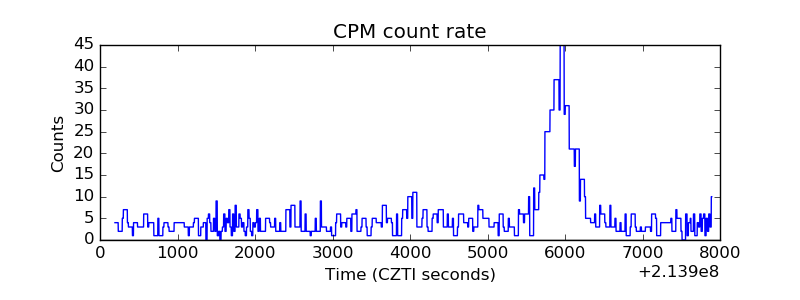 |
| CZT Counter | 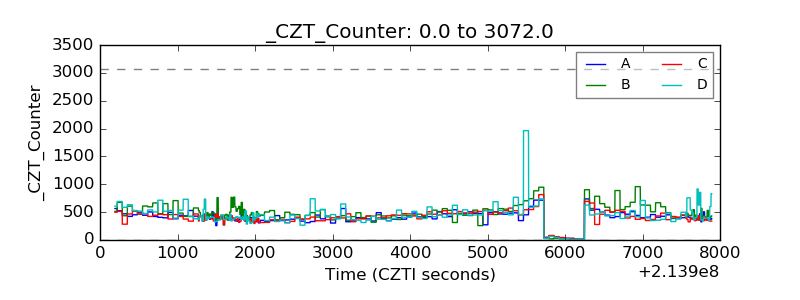 |
| +2.5 Volts monitor |  |
| +5 Volts monitor |  |
| _ROLL_ROT | 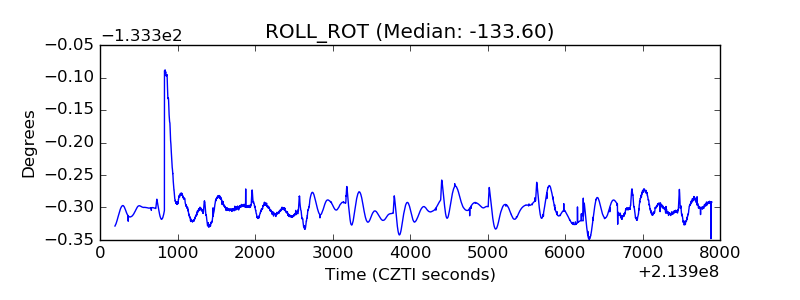 |
| _Roll_DEC | 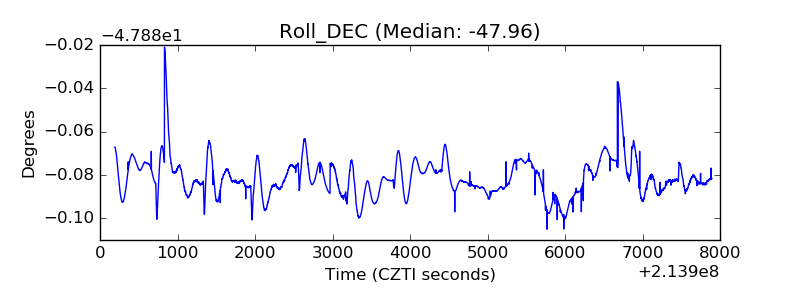 |
| _Roll_RA | 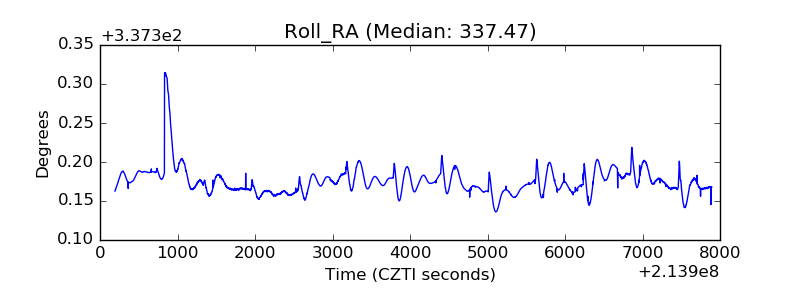 |
| Veto Counter | 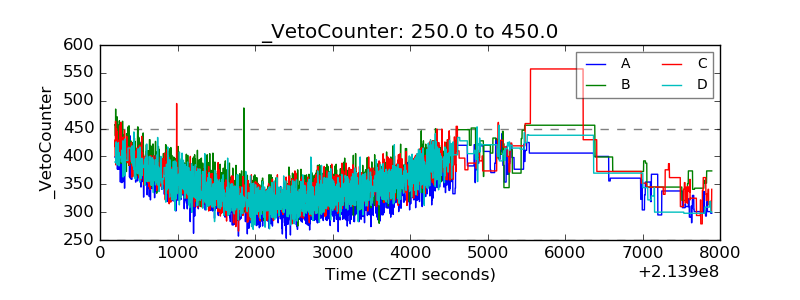 |