| Param | Original file | Final file |
|---|---|---|
| Filename | modeM0/AS1G06_132T01_9000000728_05628cztM0_level2.evt | modeM0/AS1G06_132T01_9000000728_05628cztM0_level2_quad_clean.evt |
| Size (bytes) | 73,200,960 | 19,938,240 |
| Size | 69.8 MB | 19.0 MB |
| Events in quadrant A | 511,812 | 128,941 |
| Events in quadrant B | 603,977 | 127,517 |
| Events in quadrant C | 500,298 | 124,421 |
| Events in quadrant D | 506,561 | 122,288 |
| Mode M0 | |||
|---|---|---|---|
| Quadrant | BADHDUFLAG | Total packets | Discarded packets |
| A | 0 | 2679 | 0 |
| B | 0 | 2766 | 0 |
| C | 0 | 2674 | 0 |
| D | 0 | 2686 | 0 |
| Mode SS | |||
|---|---|---|---|
| Quadrant | BADHDUFLAG | Total packets | Discarded packets |
| A | 0 | 26 | 0 |
| B | 0 | 26 | 0 |
| C | 0 | 26 | 0 |
| D | 0 | 26 | 0 |
| Quadrant | Total seconds | Saturated seconds | Saturation percentage |
|---|---|---|---|
| A | 1338 | 0 | 0.000000% |
| B | 1338 | 2 | 0.149477% |
| C | 1338 | 0 | 0.000000% |
| D | 1338 | 0 | 0.000000% |
Noise dominated data is calculated using 1-second bins in cleaned event files. If a bin has >2000 counts, and if more than 50% of those come from <1% of pixels, then it is considered to be noise-dominated and hence unusable.
| Quadrant | # 1 sec bins | Bins with >0 counts | Bins with >2000 counts | High rate bins dominated by noise | Noise dominated (total time) | Noise dominated (detector-on time) | Marked lightcurve |
|---|---|---|---|---|---|---|---|
| A | 1338 | 1338 | 0 | 0 | 0.00% | 0.00% |  |
| B | 1338 | 1338 | 2 | 2 | 0.15% | 0.15% | 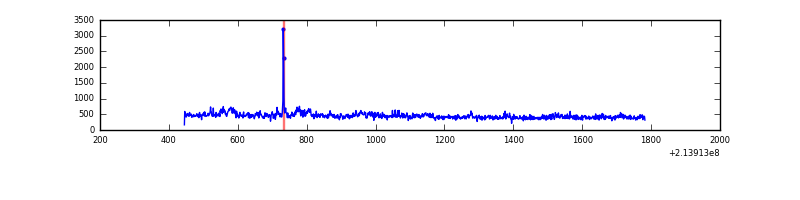 |
| C | 1338 | 1338 | 0 | 0 | 0.00% | 0.00% | 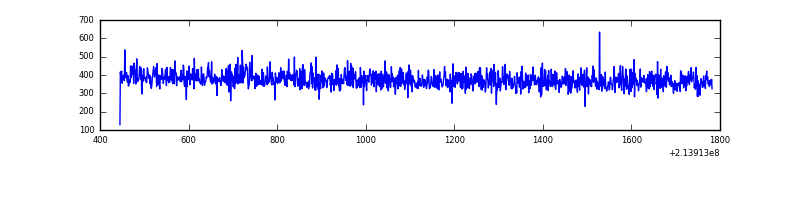 |
| D | 1338 | 1338 | 0 | 0 | 0.00% | 0.00% | 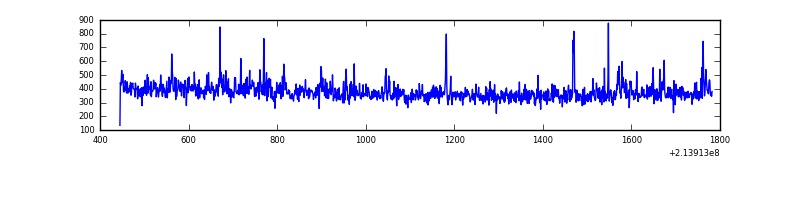 |
Top three noisy pixels from each quadrant. If the there are fewer than three noisy pixels in the level2.evt file, extra rows are filled as -1
| Pixel properties | Quadrant properties | ||||||
|---|---|---|---|---|---|---|---|
| Quadrant | DetID | PixID | Counts | Sigma | Mean | Median | Sigma |
| A | 0 | 50 | 1864 | 58.5 | 132 | 129 | 29.7 |
| A | 12 | 194 | 1257 | 38.03 | 132 | 129 | 29.7 |
| A | 0 | 226 | 1214 | 36.58 | 132 | 129 | 29.7 |
| B | 15 | 204 | 66009 | 2303.96 | 135 | 132 | 28.6 |
| B | 0 | 219 | 10746 | 371.21 | 135 | 132 | 28.6 |
| B | 11 | 51 | 2458 | 81.35 | 135 | 132 | 28.6 |
| C | 13 | 61 | 936 | 25.22 | 127 | 128 | 32.0 |
| C | 8 | 222 | 731 | 18.82 | 127 | 128 | 32.0 |
| C | 1 | 16 | 705 | 18.01 | 127 | 128 | 32.0 |
| D | 2 | 152 | 9469 | 292.09 | 125 | 121 | 32.0 |
| D | 8 | 195 | 4517 | 137.36 | 125 | 121 | 32.0 |
| D | 5 | 233 | 3856 | 116.71 | 125 | 121 | 32.0 |
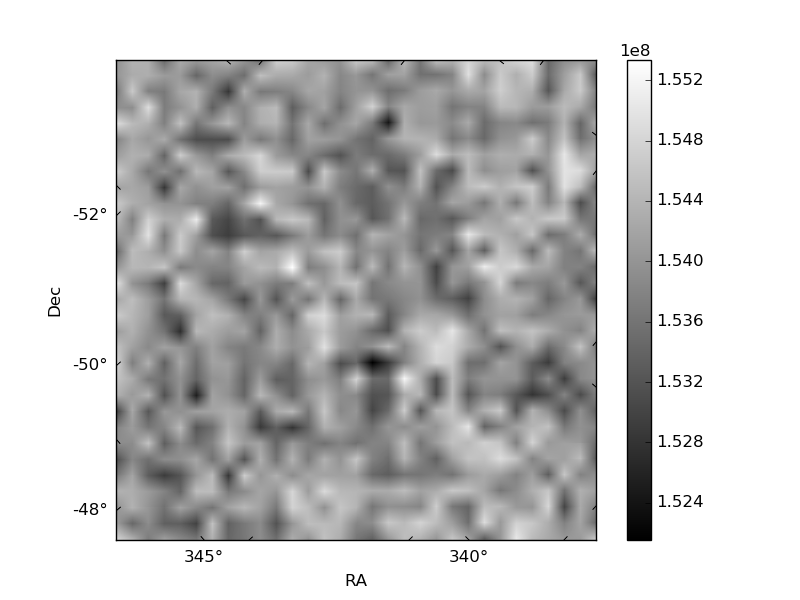
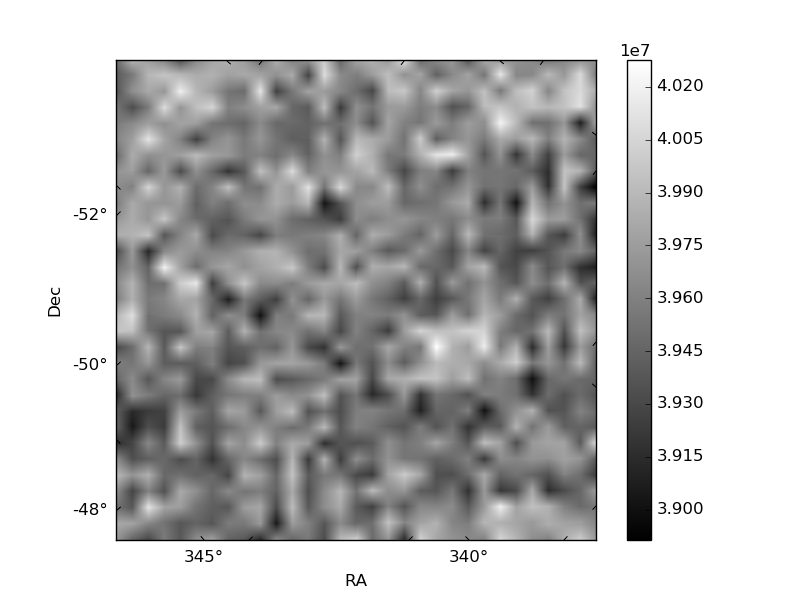
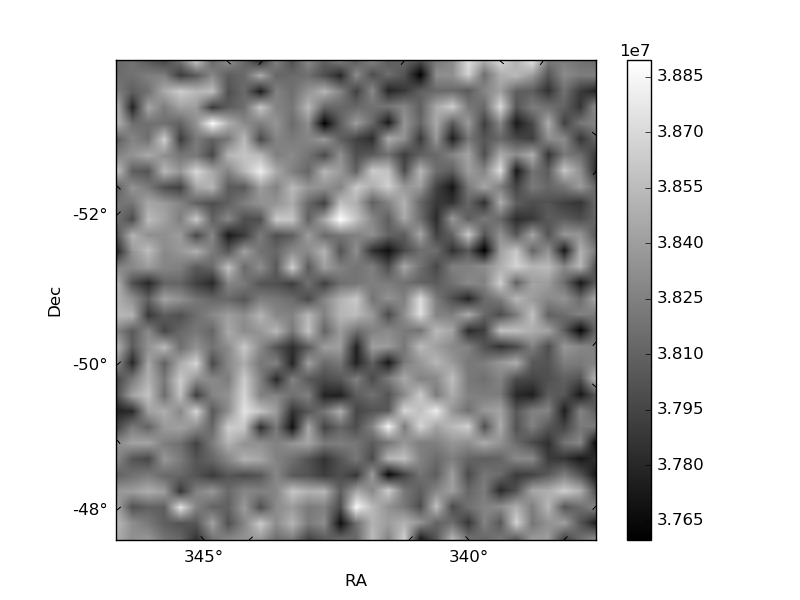
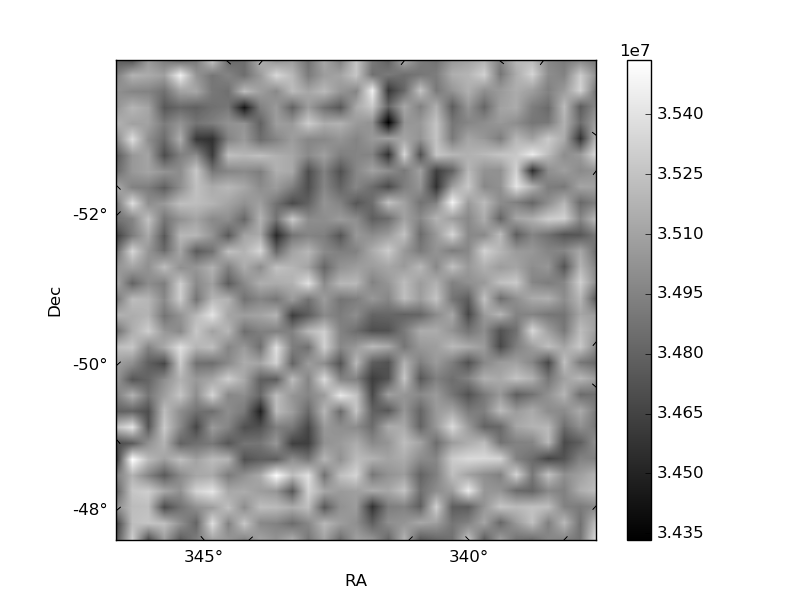
Histogram calculated using DETX and DETY for each event in the final _common_clean file
| Quadrant A | 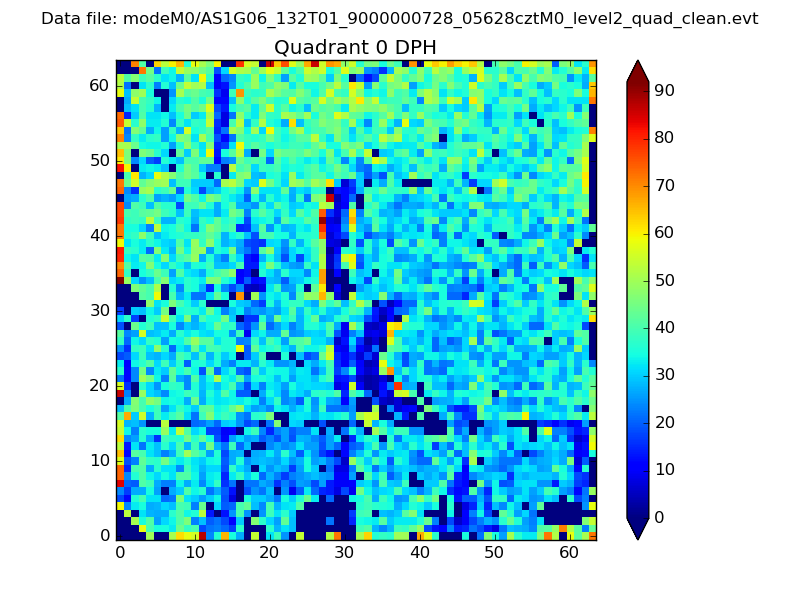 |
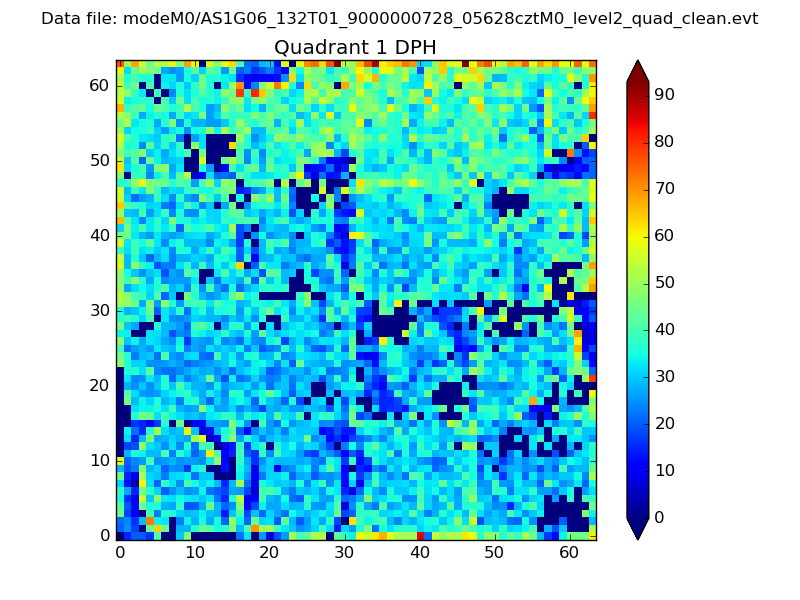 |
Quadrant B |
|---|---|---|---|
| Quadrant D | 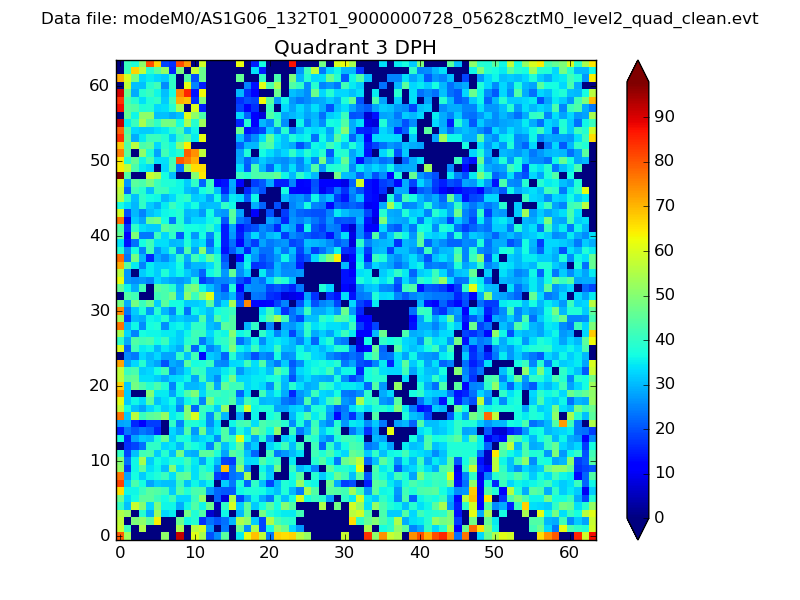 |
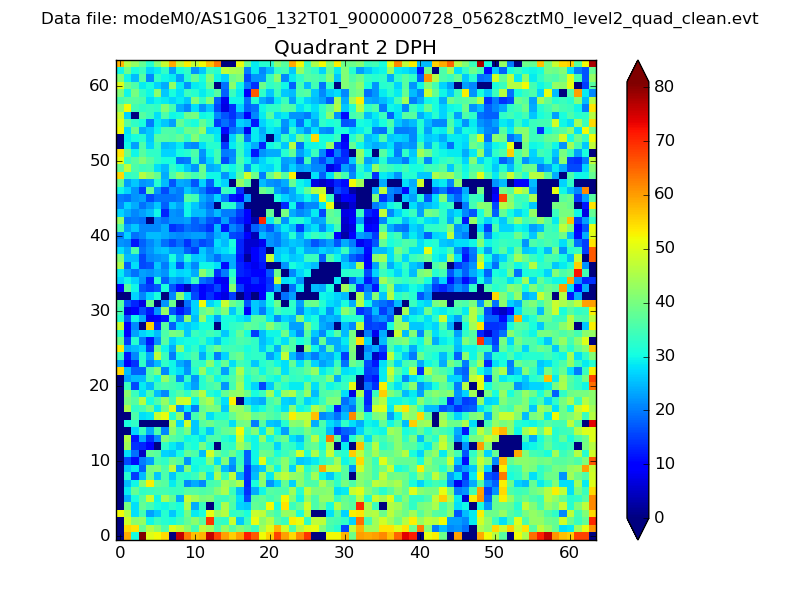 |
Quadrant C |
| Plot type | Count rate plots | Images |
|---|---|---|
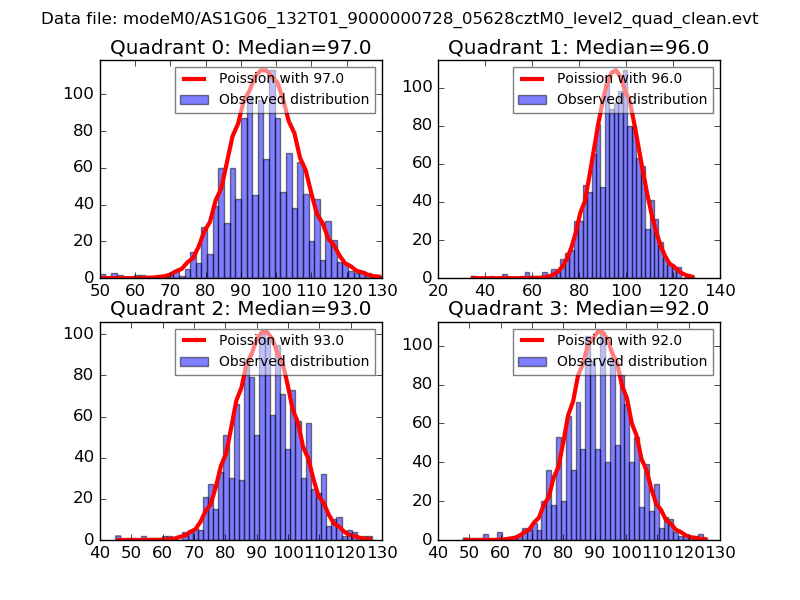
| Comparison with Poisson distribution Blue bars denote a histogram of data divided into 1 sec bins. Red curve is a Poisson curve with rate = median count rate of data. |
 |
 |
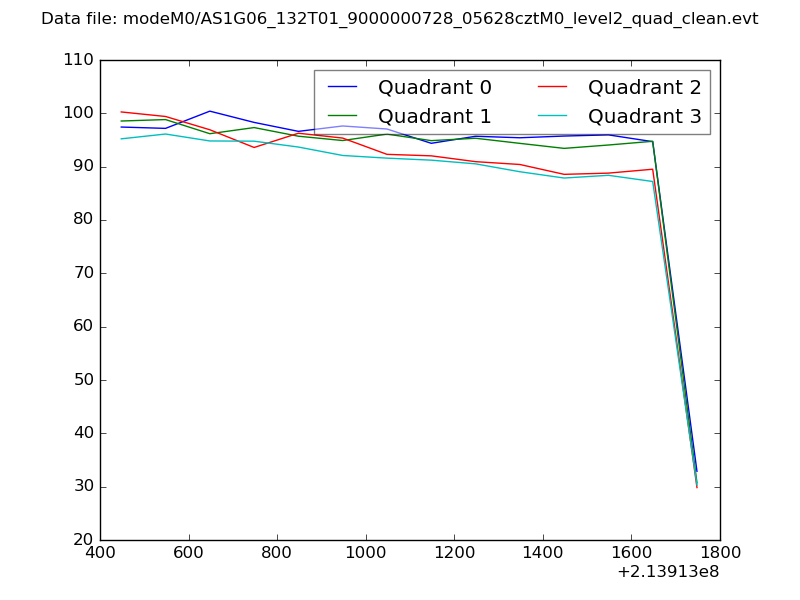
| Quadrant-wise count rates Data is divided into 100 sec bins |
 |
|
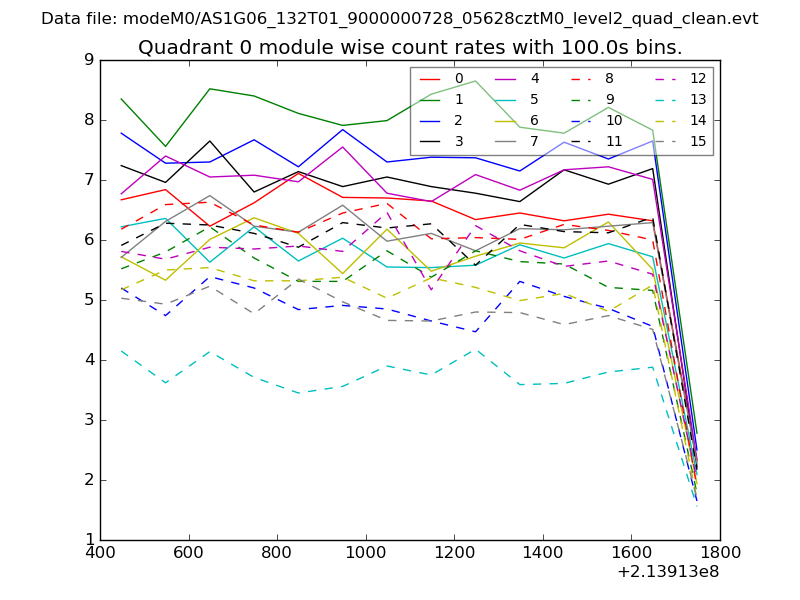
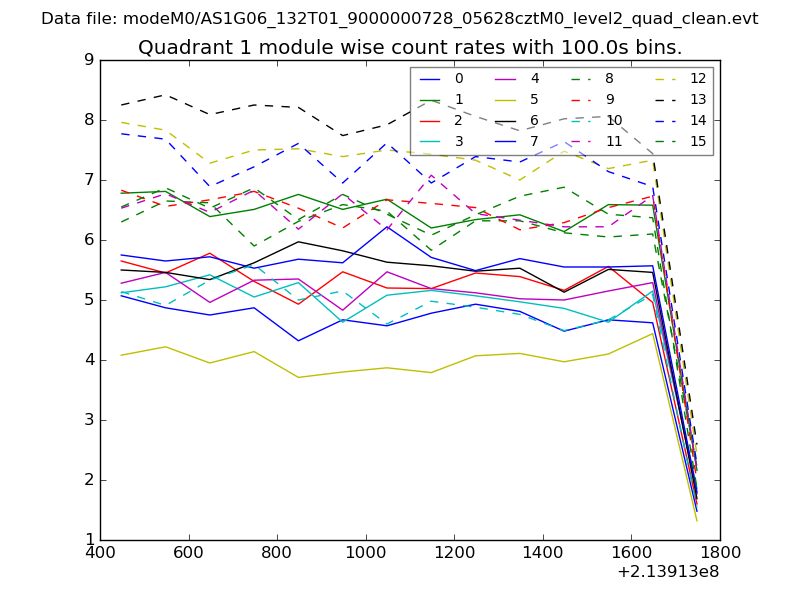
| Module-wise count rates for Quadrant A Data is divided into 100 sec bins |
 |
 |
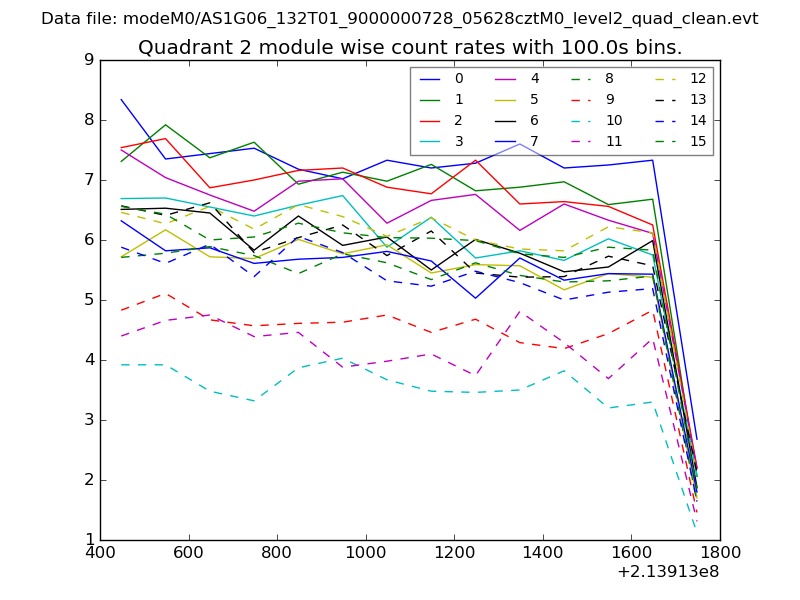
| Module-wise count rates for Quadrant B Data is divided into 100 sec bins |
 |
 |
| Module-wise count rates for Quadrant C Data is divided into 100 sec bins |
 |
 |
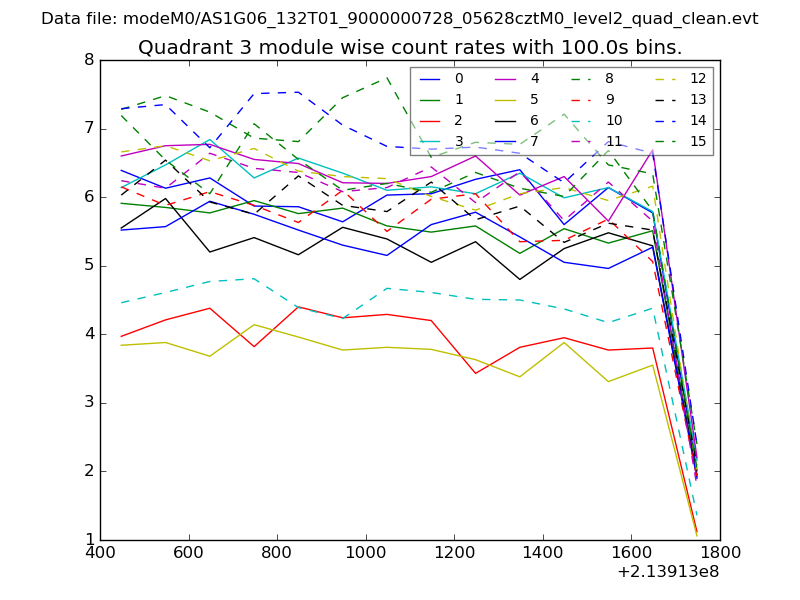
| Module-wise count rates for Quadrant D Data is divided into 100 sec bins |
 |
 |
| Parameter | Plot |
|---|---|
| CZT HV Monitor | 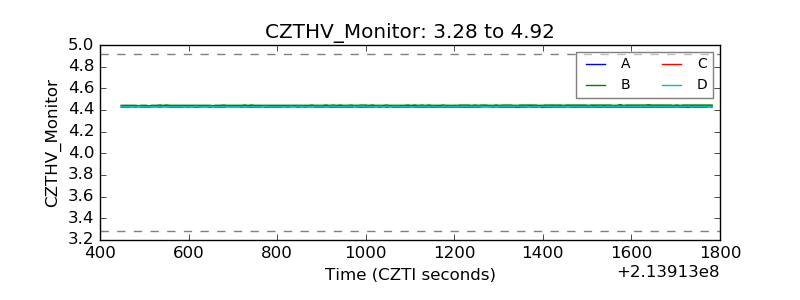 |
| D_VDD | 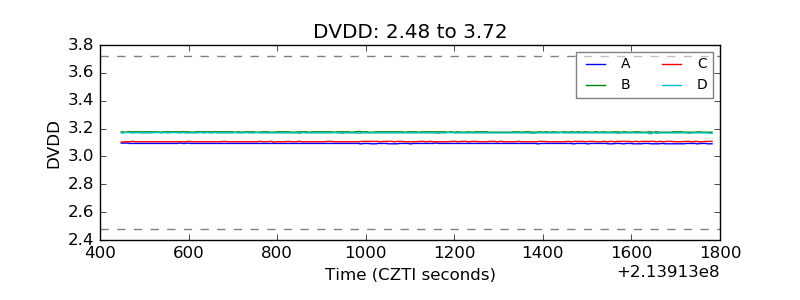 |
| Temperature 1 | 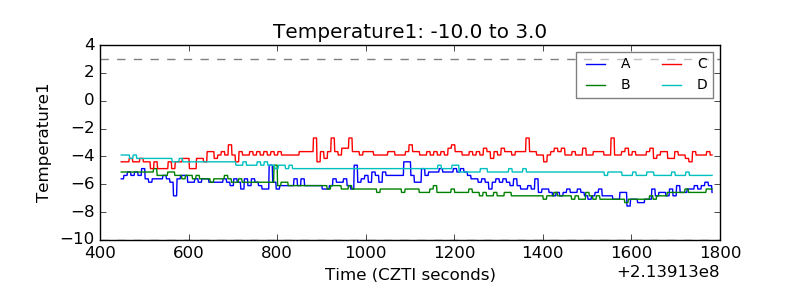 |
| Veto HV Monitor | 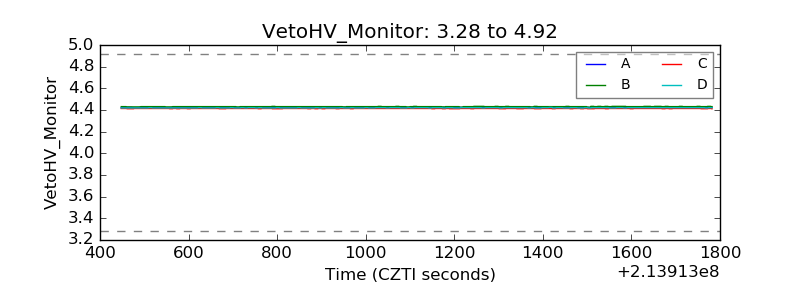 |
| Veto LLD | 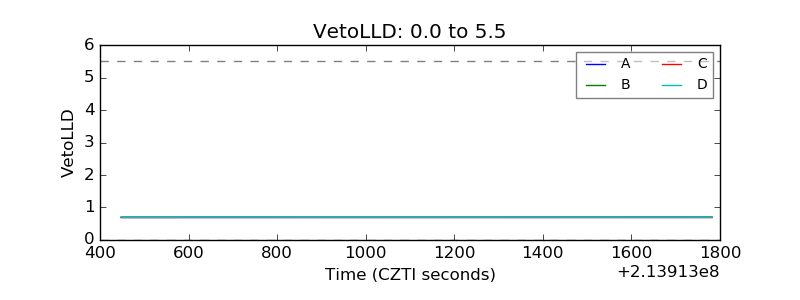 |
| Alpha Counter | 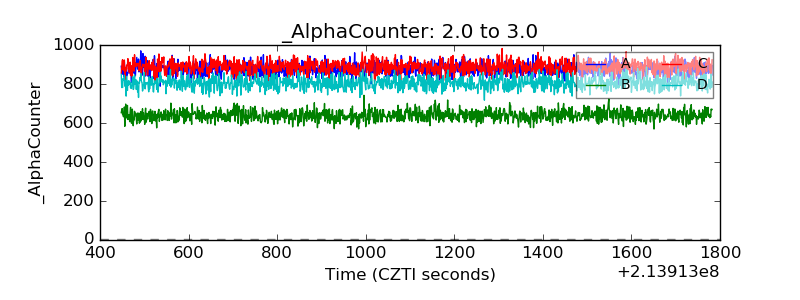 |
| _CPM_Rate | 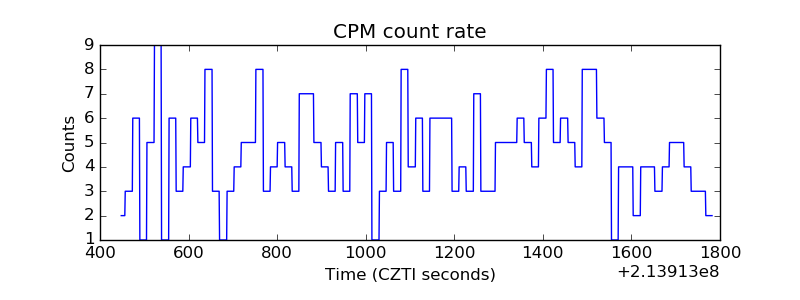 |
| CZT Counter | 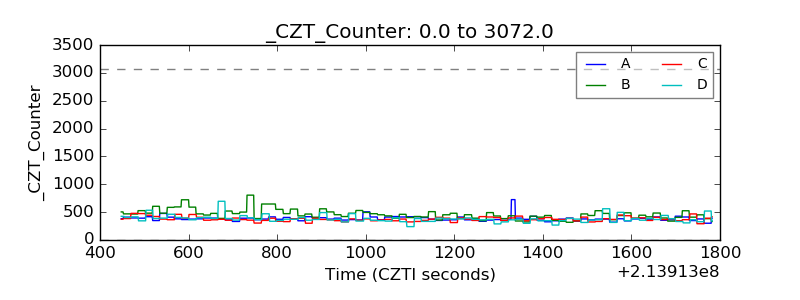 |
| +2.5 Volts monitor |  |
| +5 Volts monitor |  |
| _ROLL_ROT | 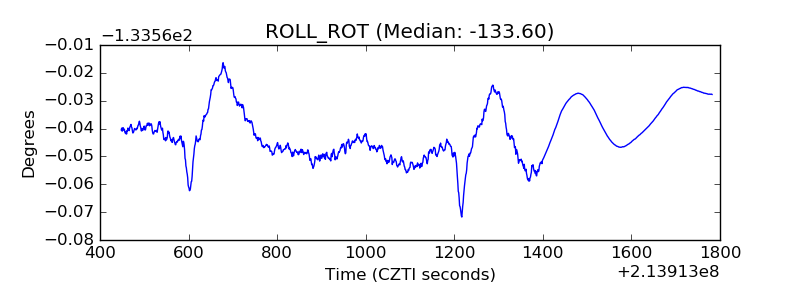 |
| _Roll_DEC | 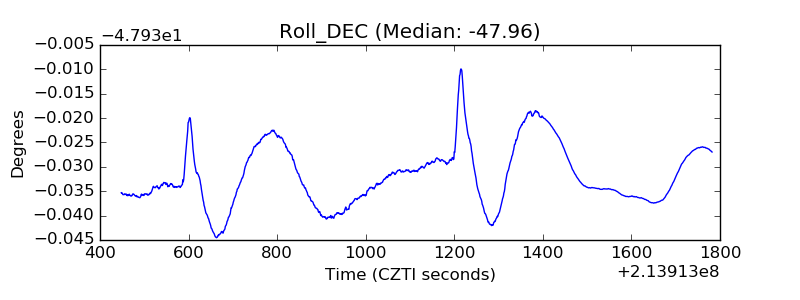 |
| _Roll_RA | 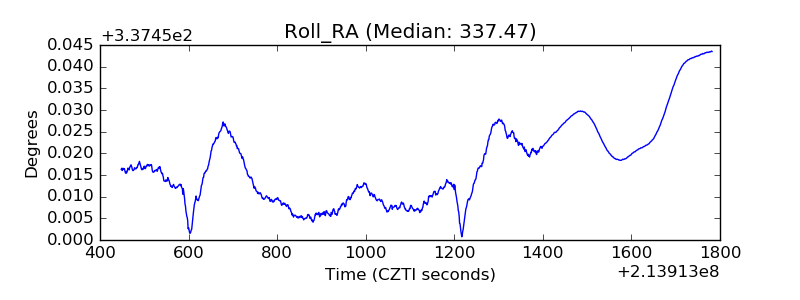 |
| Veto Counter | 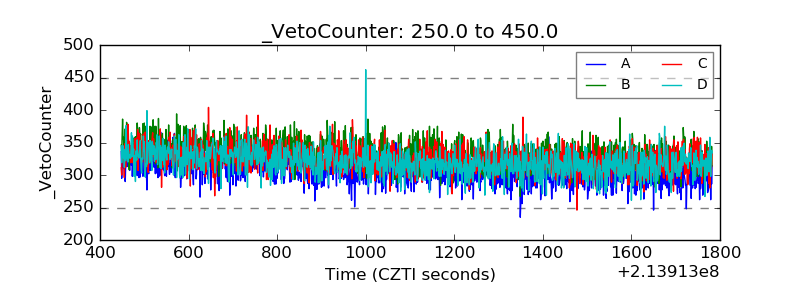 |