| Param | Original file | Final file |
|---|---|---|
| Filename | modeM0/AS1A02_077T01_9000000732cztM0_level2.fits | modeM0/AS1A02_077T01_9000000732cztM0_level2_quad_clean.evt |
| Size (bytes) | 923,195,520 | 927,230,400 |
| Size | 880.4 MB | 884.3 MB |
| Events in quadrant A | 5,738,224 | 5,698,123 |
| Events in quadrant B | 5,392,042 | 5,413,050 |
| Events in quadrant C | 5,077,017 | 5,044,565 |
| Events in quadrant D | 4,860,448 | 5,040,929 |
| Mode M0 | |||
|---|---|---|---|
| Quadrant | BADHDUFLAG | Total packets | Discarded packets |
| A | 0 | 215513 | 0 |
| B | 0 | 255592 | 0 |
| C | 0 | 195897 | 0 |
| D | 0 | 230651 | 0 |
| Mode SS | |||
|---|---|---|---|
| Quadrant | BADHDUFLAG | Total packets | Discarded packets |
| A | 0 | 2097 | 0 |
| B | 0 | 2106 | 0 |
| C | 0 | 2124 | 0 |
| D | 0 | 2092 | 0 |
| Mode M9 | |||
|---|---|---|---|
| Quadrant | BADHDUFLAG | Total packets | Discarded packets |
| A | 0 | 151 | 0 |
| B | 0 | 152 | 0 |
| C | 0 | 155 | 0 |
| D | 0 | 151 | 0 |
| Quadrant | Total seconds | Saturated seconds | Saturation percentage |
|---|---|---|---|
| A | 103086 | 1286 | 1.247502% |
| B | 102671 | 4422 | 4.306961% |
| C | 92488 | 906 | 0.979587% |
| D | 102629 | 1478 | 1.440139% |
Noise dominated data is calculated using 1-second bins in cleaned event files. If a bin has >2000 counts, and if more than 50% of those come from <1% of pixels, then it is considered to be noise-dominated and hence unusable.
| Quadrant | # 1 sec bins | Bins with >0 counts | Bins with >2000 counts | High rate bins dominated by noise | Noise dominated (total time) | Noise dominated (detector-on time) | Marked lightcurve |
|---|---|---|---|---|---|---|---|
| A | 135460 | 106586 | 0 | 0 | 0.00% | 0.00% |  |
| B | 135460 | 106051 | 0 | 0 | 0.00% | 0.00% |  |
| C | 116515 | 95055 | 0 | 0 | 0.00% | 0.00% |  |
| D | 135460 | 106128 | 0 | 0 | 0.00% | 0.00% |  |
Top three noisy pixels from each quadrant. If the there are fewer than three noisy pixels in the level2.evt file, extra rows are filled as -1
| Pixel properties | Quadrant properties | ||||||
|---|---|---|---|---|---|---|---|
| Quadrant | DetID | PixID | Counts | Sigma | Mean | Median | Sigma |
| A | 14 | 188 | 5774 | 11.62 | 1490 | 1390 | 377.3 |
| A | 0 | 29 | 5604 | 11.17 | 1490 | 1390 | 377.3 |
| A | 14 | 204 | 5025 | 9.63 | 1490 | 1390 | 377.3 |
| B | 2 | 9 | 4654 | 11.81 | 1422 | 1350 | 279.8 |
| B | 12 | 226 | 3862 | 8.98 | 1422 | 1350 | 279.8 |
| B | 14 | 254 | 3748 | 8.57 | 1422 | 1350 | 279.8 |
| C | 1 | 80 | 3659 | 6.79 | 1341 | 1237 | 356.9 |
| C | 1 | 81 | 3566 | 6.53 | 1341 | 1237 | 356.9 |
| C | 12 | 241 | 3523 | 6.41 | 1341 | 1237 | 356.9 |
| D | 11 | 82 | 3766 | 6.76 | 1385 | 1256 | 371.1 |
| D | 3 | 14 | 3719 | 6.64 | 1385 | 1256 | 371.1 |
| D | 6 | 231 | 3680 | 6.53 | 1385 | 1256 | 371.1 |
Histogram calculated using DETX and DETY for each event in the final _common_clean file
| Quadrant A |  |
 |
Quadrant B |
|---|---|---|---|
| Quadrant D |  |
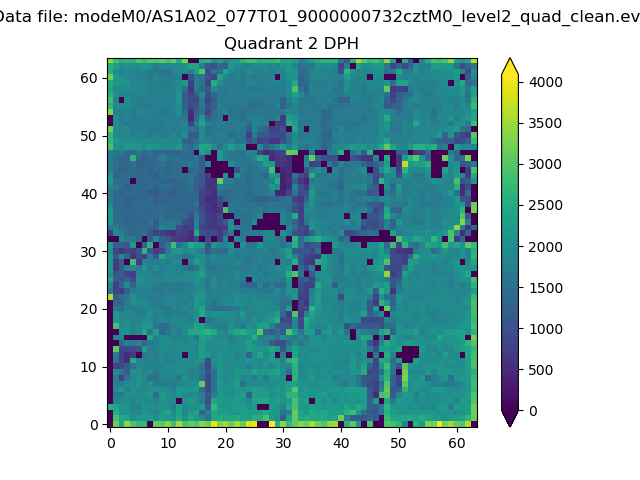 |
Quadrant C |
| Plot type | Count rate plots | Images |
|---|---|---|
| Comparison with Poisson distribution Blue bars denote a histogram of data divided into 1 sec bins. Red curve is a Poisson curve with rate = median count rate of data. |
 |
 |
| Quadrant-wise count rates Data is divided into 100 sec bins |
 |
|
| Module-wise count rates for Quadrant A Data is divided into 100 sec bins |
 |
 |
| Module-wise count rates for Quadrant B Data is divided into 100 sec bins |
 |
 |
| Module-wise count rates for Quadrant C Data is divided into 100 sec bins |
 |
 |
| Module-wise count rates for Quadrant D Data is divided into 100 sec bins |
 |
 |
| Parameter | Plot |
|---|---|
| CZT HV Monitor |  |
| D_VDD |  |
| Temperature 1 |  |
| Veto HV Monitor |  |
| Veto LLD |  |
| Alpha Counter |  |
| _CPM_Rate |  |
| CZT Counter |  |
| +2.5 Volts monitor |  |
| +5 Volts monitor |  |
| _ROLL_ROT |  |
| _Roll_DEC |  |
| _Roll_RA |  |
| Veto Counter |  |