| Param | Original file | Final file |
|---|---|---|
| Filename | modeM0/AS1A02_077T01_9000000732_05661cztM0_level2.evt | modeM0/AS1A02_077T01_9000000732_05661cztM0_level2_quad_clean.evt |
| Size (bytes) | 858,905,280 | 140,477,760 |
| Size | 819.1 MB | 134.0 MB |
| Events in quadrant A | 5,687,941 | 879,962 |
| Events in quadrant B | 7,197,260 | 854,006 |
| Events in quadrant C | 5,794,992 | 868,494 |
| Events in quadrant D | 6,540,088 | 842,532 |
| Mode M0 | |||
|---|---|---|---|
| Quadrant | BADHDUFLAG | Total packets | Discarded packets |
| A | 0 | 24756 | 3 |
| B | 0 | 29070 | 2 |
| C | 0 | 25426 | 2 |
| D | 0 | 27407 | 2 |
| Mode SS | |||
|---|---|---|---|
| Quadrant | BADHDUFLAG | Total packets | Discarded packets |
| A | 0 | 240 | 0 |
| B | 0 | 240 | 0 |
| C | 0 | 240 | 0 |
| D | 0 | 240 | 0 |
| Mode M9 | |||
|---|---|---|---|
| Quadrant | BADHDUFLAG | Total packets | Discarded packets |
| A | 0 | 21 | 0 |
| B | 0 | 21 | 0 |
| C | 0 | 21 | 0 |
| D | 0 | 21 | 0 |
| Quadrant | Total seconds | Saturated seconds | Saturation percentage |
|---|---|---|---|
| A | 11689 | 214 | 1.830781% |
| B | 11689 | 486 | 4.157755% |
| C | 11689 | 172 | 1.471469% |
| D | 11689 | 275 | 2.352639% |
Noise dominated data is calculated using 1-second bins in cleaned event files. If a bin has >2000 counts, and if more than 50% of those come from <1% of pixels, then it is considered to be noise-dominated and hence unusable.
| Quadrant | # 1 sec bins | Bins with >0 counts | Bins with >2000 counts | High rate bins dominated by noise | Noise dominated (total time) | Noise dominated (detector-on time) | Marked lightcurve |
|---|---|---|---|---|---|---|---|
| A | 13819 | 11691 | 16 | 16 | 0.12% | 0.14% | 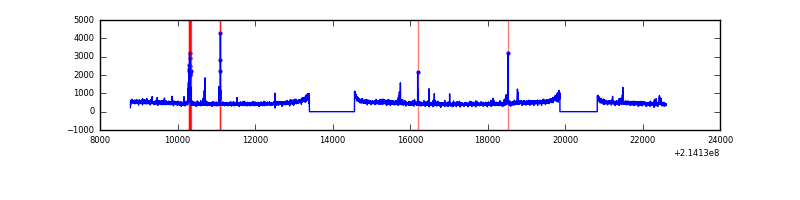 |
| B | 13819 | 11691 | 308 | 308 | 2.23% | 2.63% | 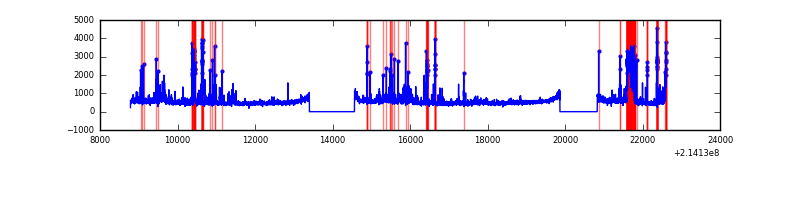 |
| C | 13819 | 11691 | 72 | 72 | 0.52% | 0.62% | 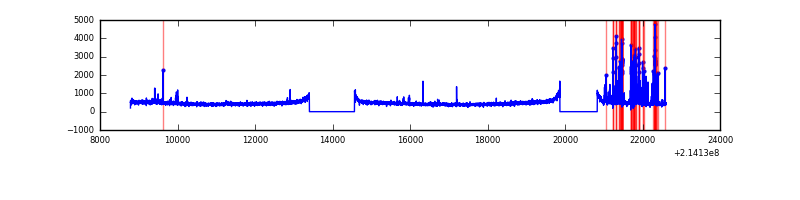 |
| D | 13819 | 11691 | 130 | 130 | 0.94% | 1.11% | 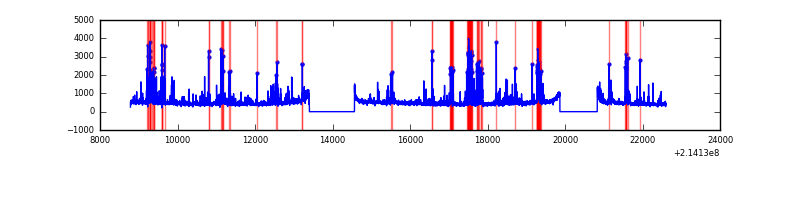 |
Top three noisy pixels from each quadrant. If the there are fewer than three noisy pixels in the level2.evt file, extra rows are filled as -1
| Pixel properties | Quadrant properties | ||||||
|---|---|---|---|---|---|---|---|
| Quadrant | DetID | PixID | Counts | Sigma | Mean | Median | Sigma |
| A | 0 | 50 | 143763 | 493.69 | 1413 | 1382 | 288.4 |
| A | 14 | 250 | 41756 | 139.99 | 1413 | 1382 | 288.4 |
| A | 13 | 6 | 33336 | 110.8 | 1413 | 1382 | 288.4 |
| B | 10 | 245 | 594374 | 2234.02 | 1397 | 1367 | 265.4 |
| B | 10 | 16 | 315788 | 1184.51 | 1397 | 1367 | 265.4 |
| B | 5 | 172 | 179216 | 670.0 | 1397 | 1367 | 265.4 |
| C | 5 | 250 | 318814 | 1020.72 | 1347 | 1353 | 311.0 |
| C | 1 | 16 | 154685 | 493.0 | 1347 | 1353 | 311.0 |
| C | 5 | 233 | 43463 | 135.4 | 1347 | 1353 | 311.0 |
| D | 12 | 233 | 389548 | 1166.21 | 1356 | 1314 | 332.9 |
| D | 4 | 95 | 336538 | 1006.97 | 1356 | 1314 | 332.9 |
| D | 2 | 152 | 303474 | 907.65 | 1356 | 1314 | 332.9 |
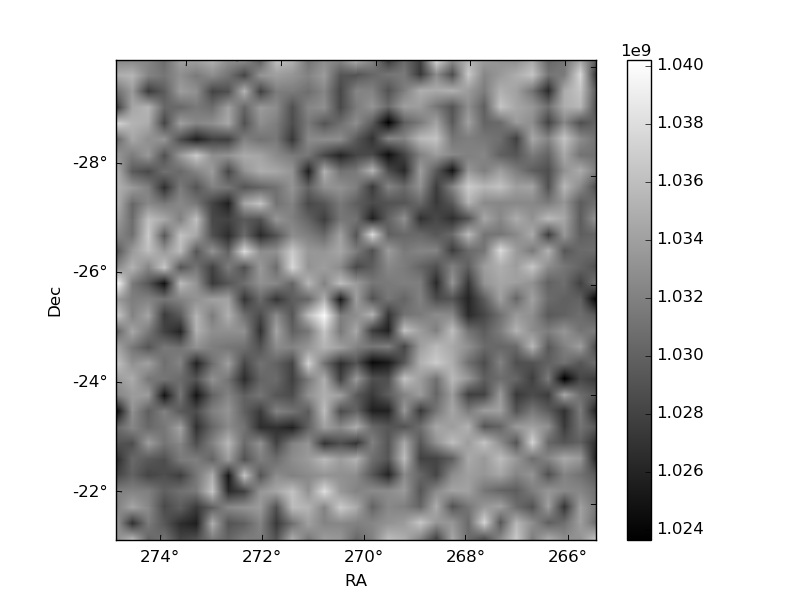
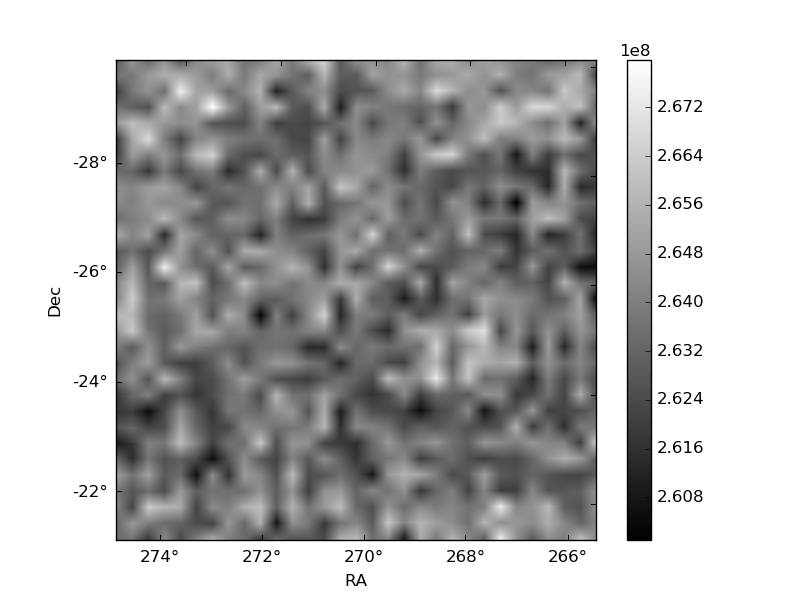
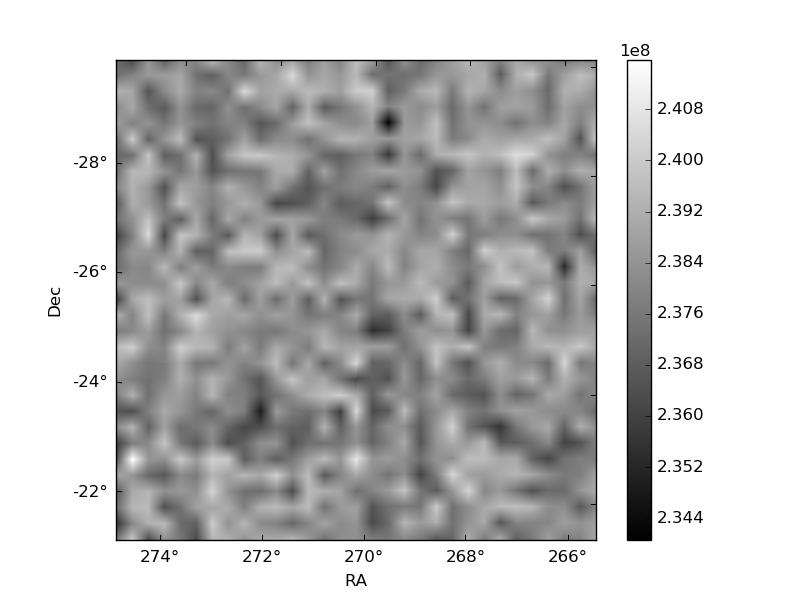
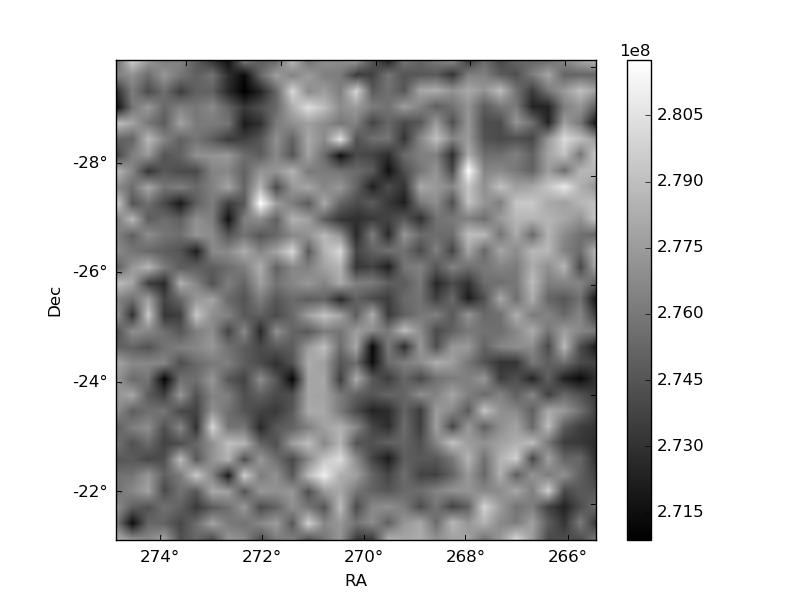
Histogram calculated using DETX and DETY for each event in the final _common_clean file
| Quadrant A | 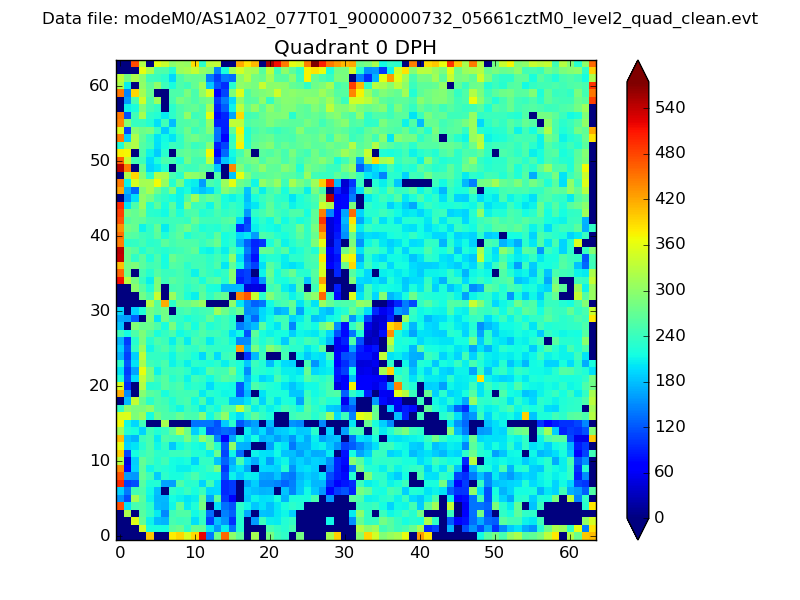 |
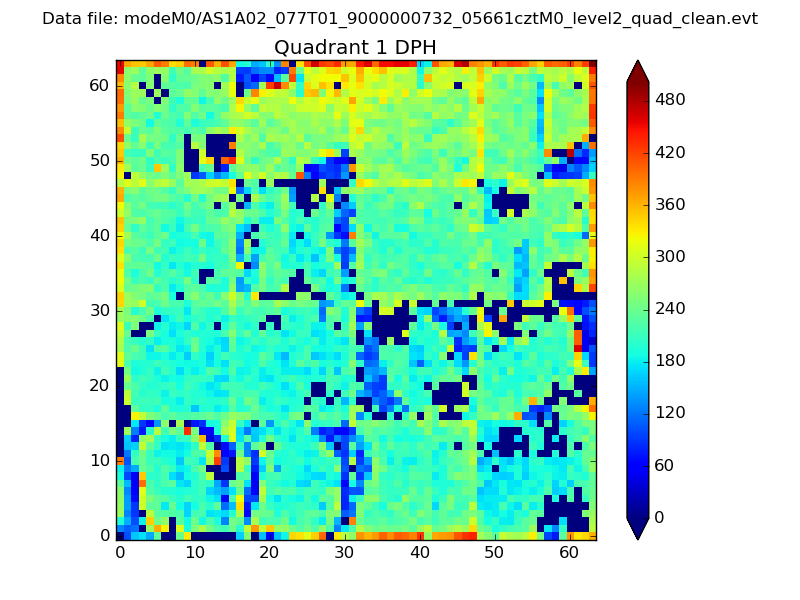 |
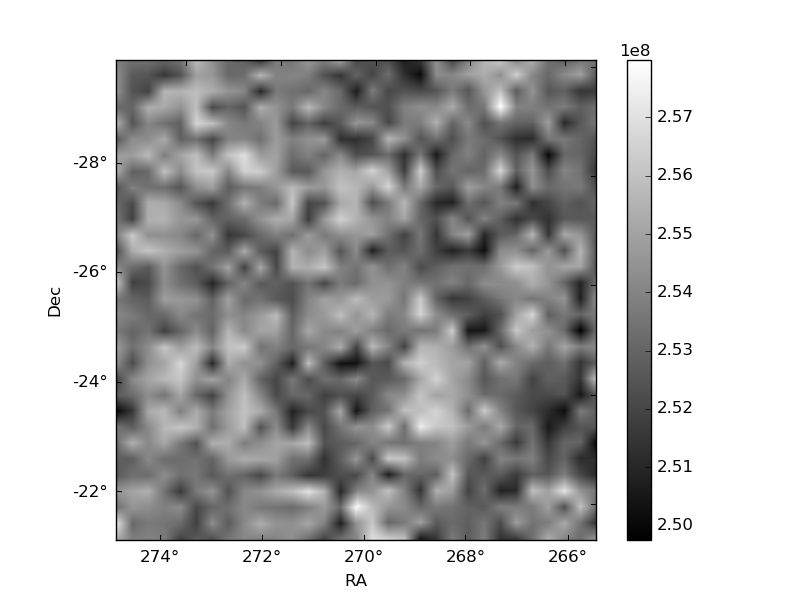
Quadrant B |
|---|---|---|---|
| Quadrant D | 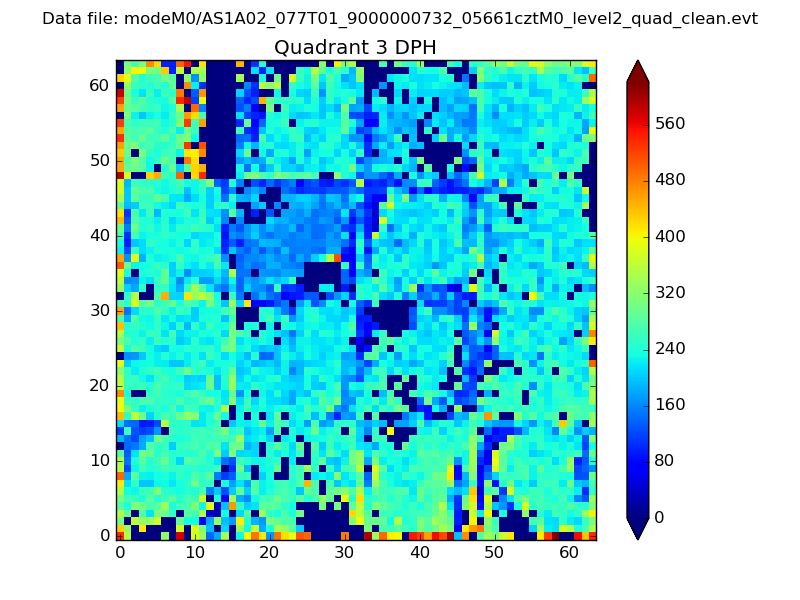 |
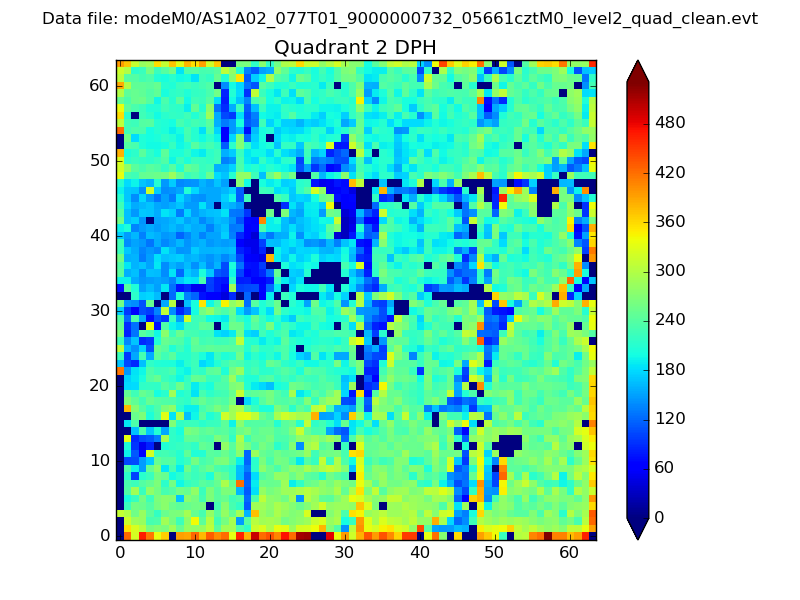 |
Quadrant C |
| Plot type | Count rate plots | Images |
|---|---|---|
| Comparison with Poisson distribution Blue bars denote a histogram of data divided into 1 sec bins. Red curve is a Poisson curve with rate = median count rate of data. |
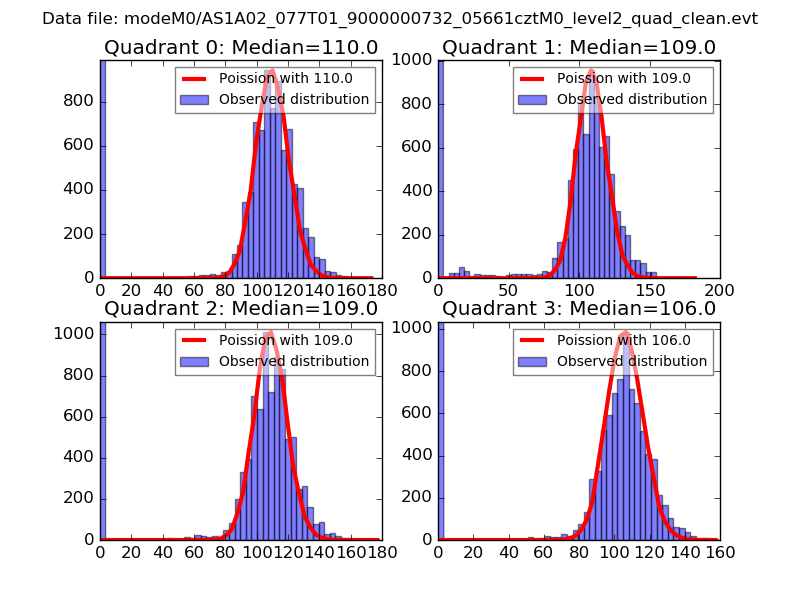 |
 |
| Quadrant-wise count rates Data is divided into 100 sec bins |
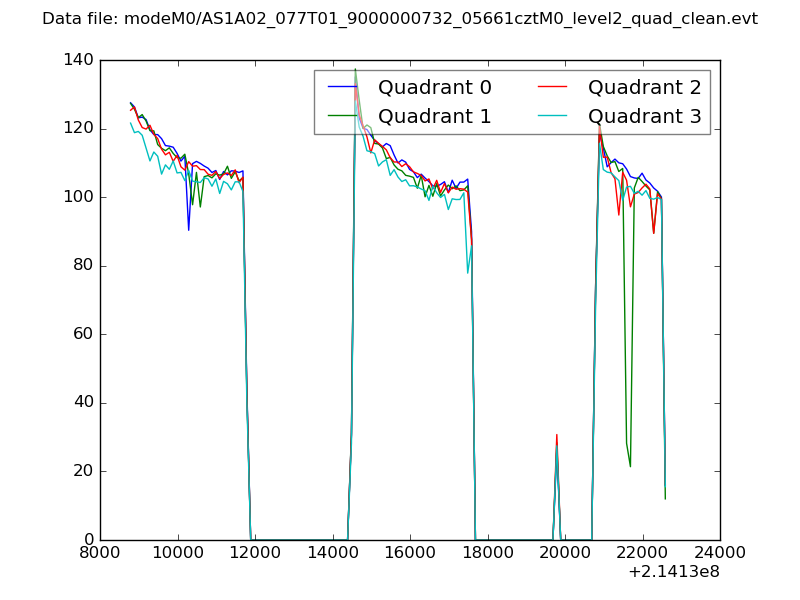 |
|
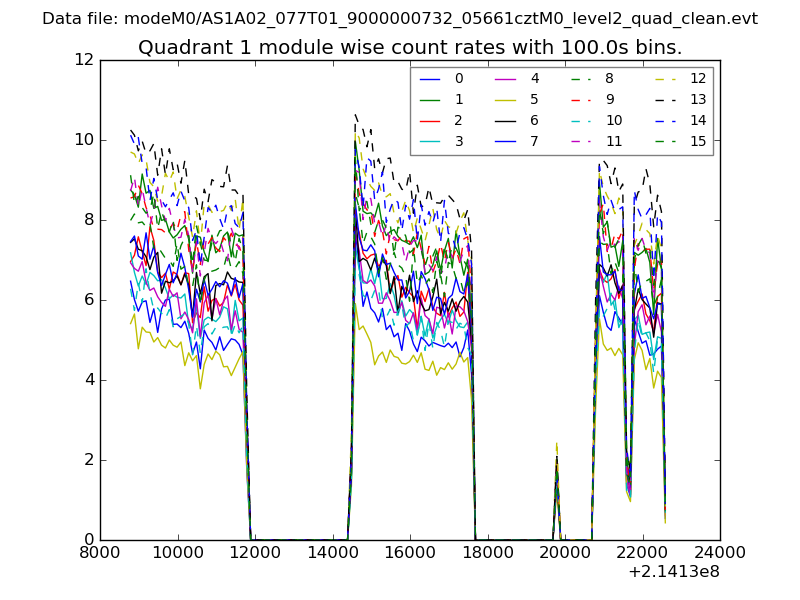
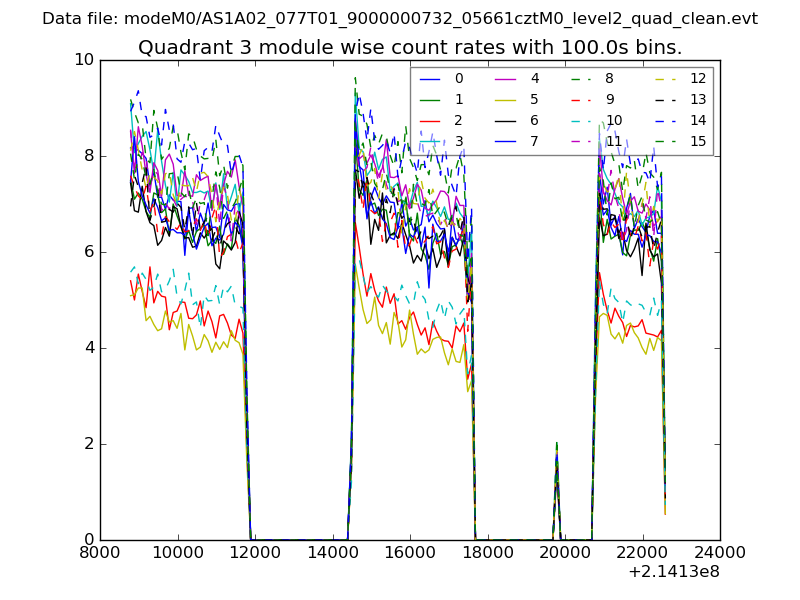
| Module-wise count rates for Quadrant A Data is divided into 100 sec bins |
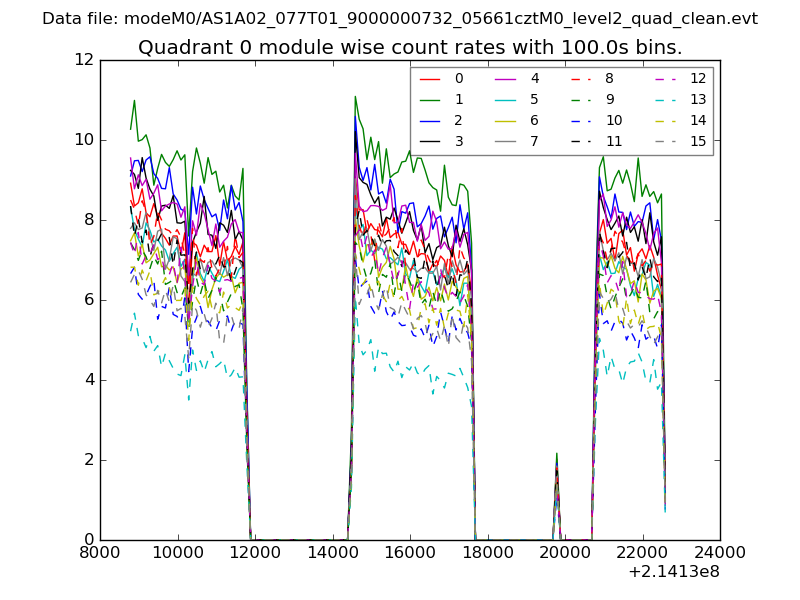 |
 |
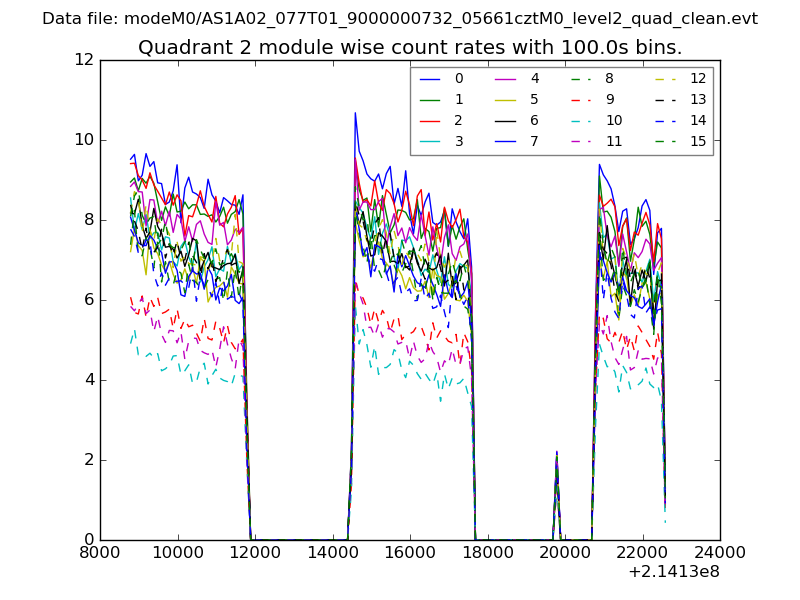
| Module-wise count rates for Quadrant B Data is divided into 100 sec bins |
 |
 |
| Module-wise count rates for Quadrant C Data is divided into 100 sec bins |
 |
 |
| Module-wise count rates for Quadrant D Data is divided into 100 sec bins |
 |
 |
| Parameter | Plot |
|---|---|
| CZT HV Monitor | 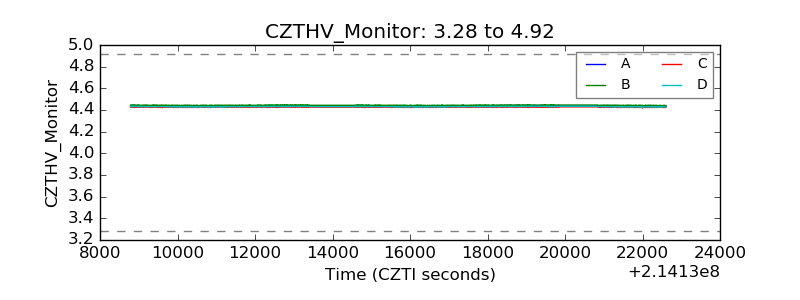 |
| D_VDD | 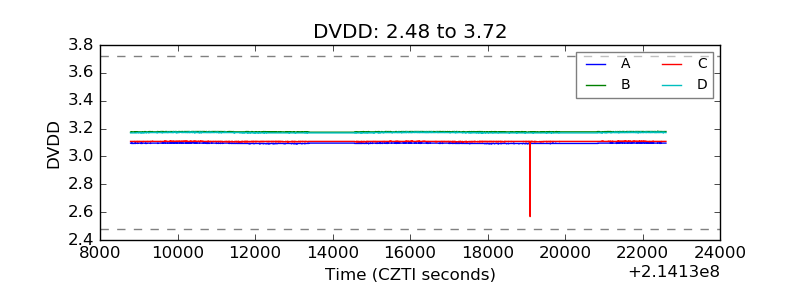 |
| Temperature 1 | 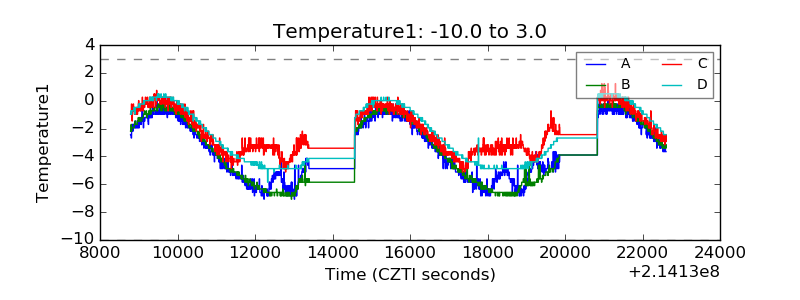 |
| Veto HV Monitor | 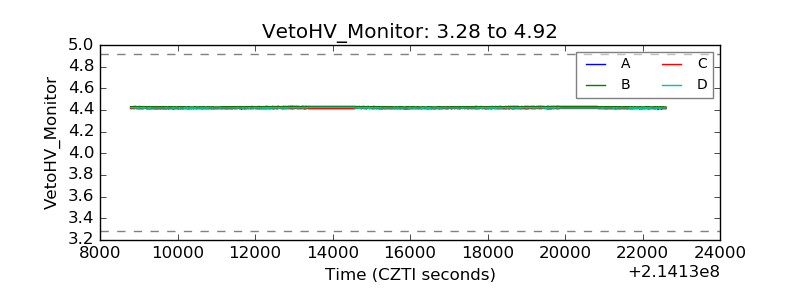 |
| Veto LLD | 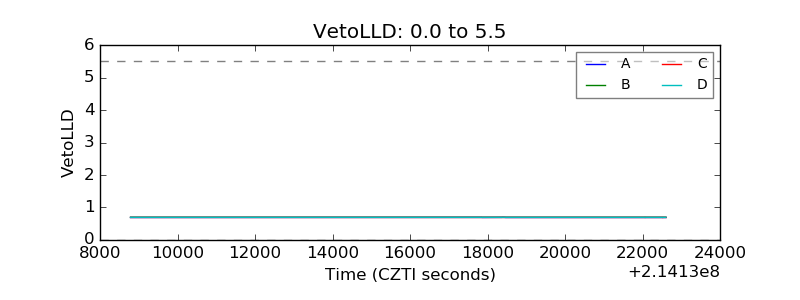 |
| Alpha Counter | 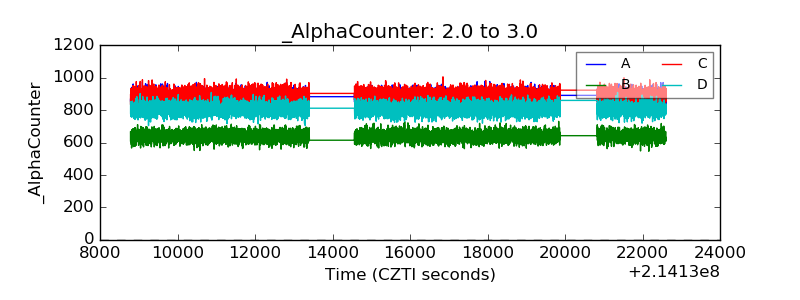 |
| _CPM_Rate | 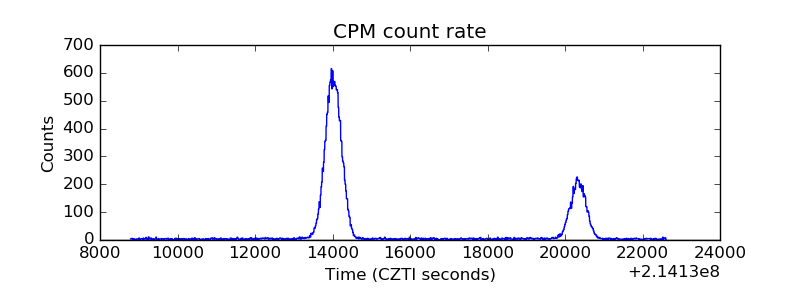 |
| CZT Counter | 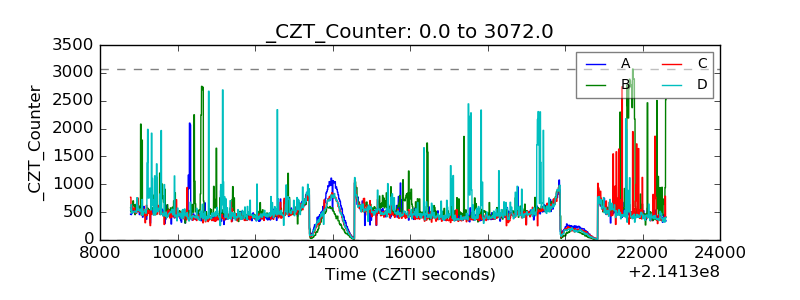 |
| +2.5 Volts monitor |  |
| +5 Volts monitor |  |
| _ROLL_ROT | 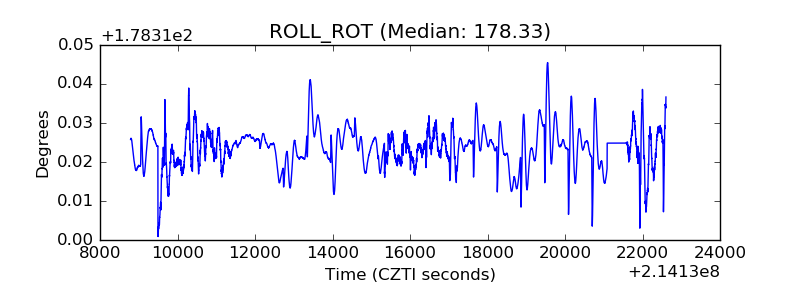 |
| _Roll_DEC | 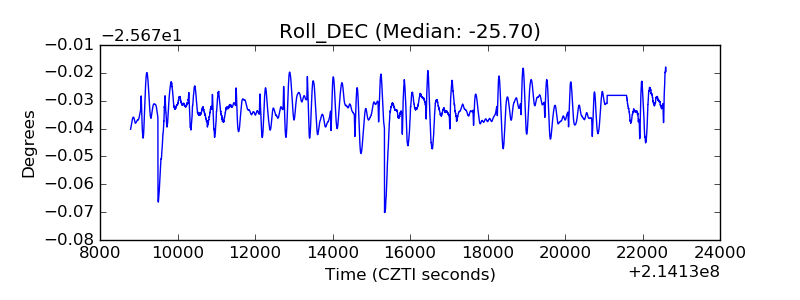 |
| _Roll_RA | 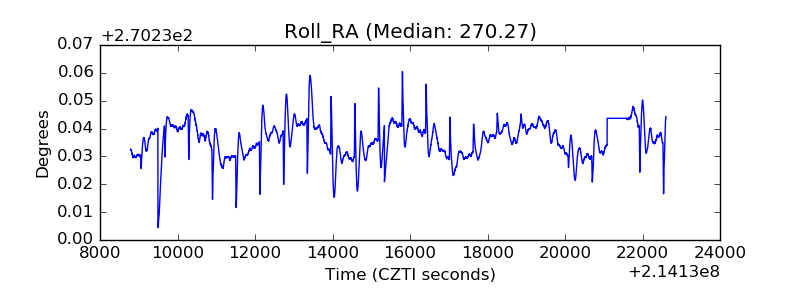 |
| Veto Counter | 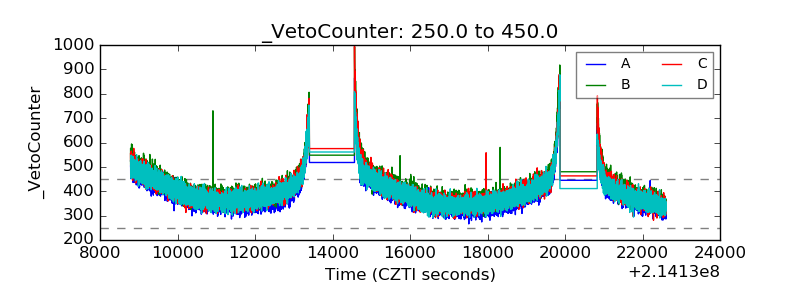 |