| Param | Original file | Final file |
|---|---|---|
| Filename | modeM0/AS1A02_077T01_9000000732_05662cztM0_level2.evt | modeM0/AS1A02_077T01_9000000732_05662cztM0_level2_quad_clean.evt |
| Size (bytes) | 544,682,880 | 68,434,560 |
| Size | 519.5 MB | 65.3 MB |
| Events in quadrant A | 2,960,398 | 439,853 |
| Events in quadrant B | 6,218,921 | 340,191 |
| Events in quadrant C | 3,365,579 | 432,704 |
| Events in quadrant D | 3,524,405 | 419,992 |
| Mode M0 | |||
|---|---|---|---|
| Quadrant | BADHDUFLAG | Total packets | Discarded packets |
| A | 0 | 13161 | 2 |
| B | 0 | 22614 | 1 |
| C | 0 | 14369 | 1 |
| D | 0 | 14871 | 1 |
| Mode SS | |||
|---|---|---|---|
| Quadrant | BADHDUFLAG | Total packets | Discarded packets |
| A | 0 | 126 | 0 |
| B | 0 | 126 | 0 |
| C | 0 | 126 | 0 |
| D | 0 | 126 | 0 |
| Mode M9 | |||
|---|---|---|---|
| Quadrant | BADHDUFLAG | Total packets | Discarded packets |
| A | 0 | 6 | 0 |
| B | 0 | 6 | 0 |
| C | 0 | 6 | 0 |
| D | 0 | 6 | 0 |
| Quadrant | Total seconds | Saturated seconds | Saturation percentage |
|---|---|---|---|
| A | 6291 | 68 | 1.080909% |
| B | 6291 | 1280 | 20.346527% |
| C | 6291 | 110 | 1.748530% |
| D | 6291 | 87 | 1.382928% |
Noise dominated data is calculated using 1-second bins in cleaned event files. If a bin has >2000 counts, and if more than 50% of those come from <1% of pixels, then it is considered to be noise-dominated and hence unusable.
| Quadrant | # 1 sec bins | Bins with >0 counts | Bins with >2000 counts | High rate bins dominated by noise | Noise dominated (total time) | Noise dominated (detector-on time) | Marked lightcurve |
|---|---|---|---|---|---|---|---|
| A | 6891 | 6292 | 4 | 4 | 0.06% | 0.06% | 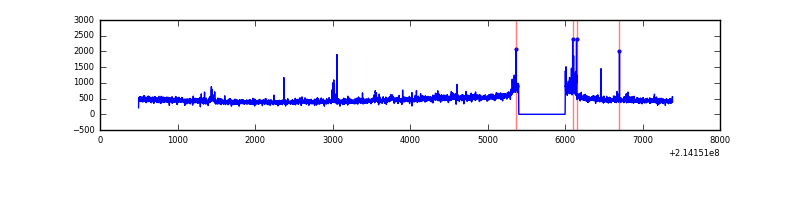 |
| B | 6891 | 6292 | 1157 | 1157 | 16.79% | 18.39% | 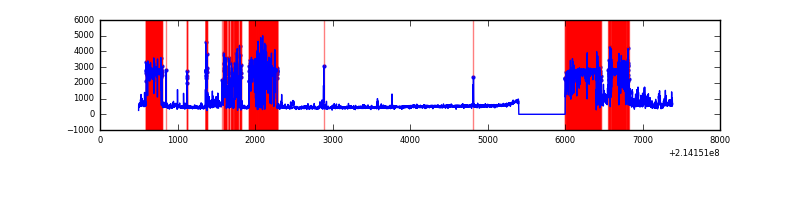 |
| C | 6891 | 6292 | 57 | 57 | 0.83% | 0.91% | 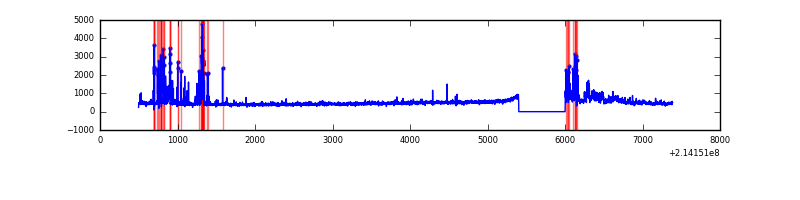 |
| D | 6891 | 6292 | 56 | 56 | 0.81% | 0.89% | 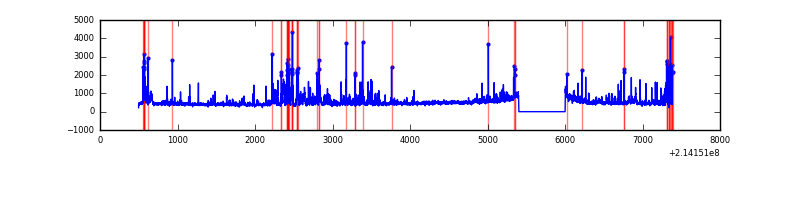 |
Top three noisy pixels from each quadrant. If the there are fewer than three noisy pixels in the level2.evt file, extra rows are filled as -1
| Pixel properties | Quadrant properties | ||||||
|---|---|---|---|---|---|---|---|
| Quadrant | DetID | PixID | Counts | Sigma | Mean | Median | Sigma |
| A | 0 | 50 | 64562 | 420.64 | 739 | 723 | 151.8 |
| A | 14 | 250 | 19758 | 125.42 | 739 | 723 | 151.8 |
| A | 13 | 6 | 16233 | 102.2 | 739 | 723 | 151.8 |
| B | 10 | 245 | 2828950 | 22416.23 | 646 | 630 | 126.2 |
| B | 5 | 172 | 446065 | 3530.35 | 646 | 630 | 126.2 |
| B | 15 | 204 | 272011 | 2150.86 | 646 | 630 | 126.2 |
| C | 1 | 16 | 275984 | 1657.73 | 708 | 710 | 166.1 |
| C | 5 | 250 | 232845 | 1397.94 | 708 | 710 | 166.1 |
| C | 10 | 34 | 49363 | 292.99 | 708 | 710 | 166.1 |
| D | 12 | 233 | 312749 | 1770.85 | 712 | 688 | 176.2 |
| D | 2 | 152 | 158428 | 895.12 | 712 | 688 | 176.2 |
| D | 4 | 95 | 120477 | 679.76 | 712 | 688 | 176.2 |
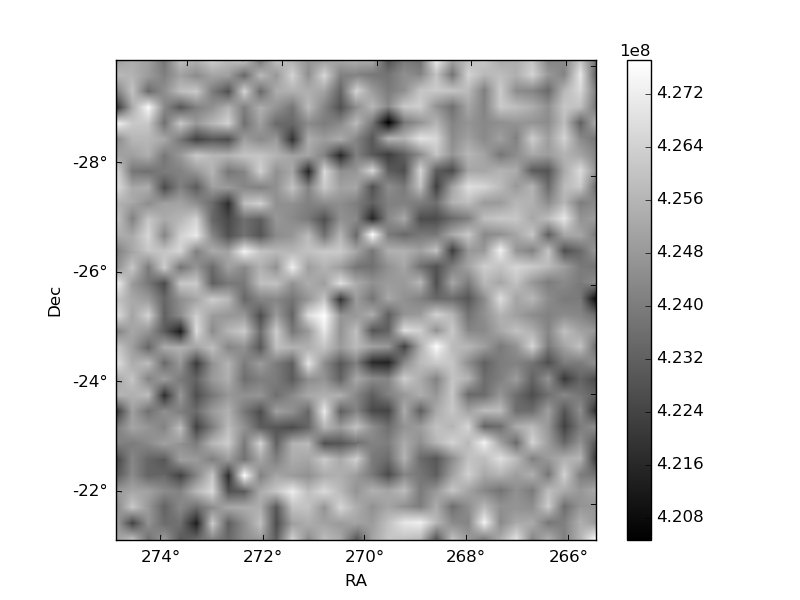
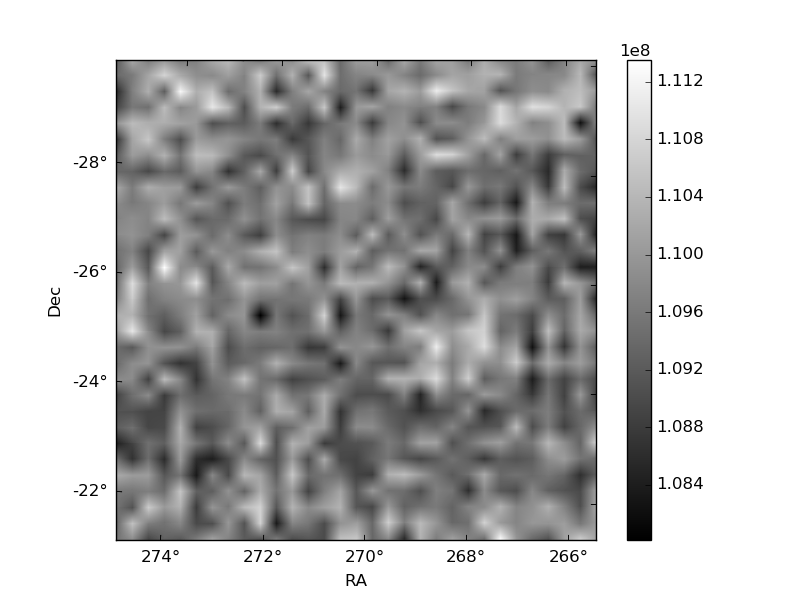
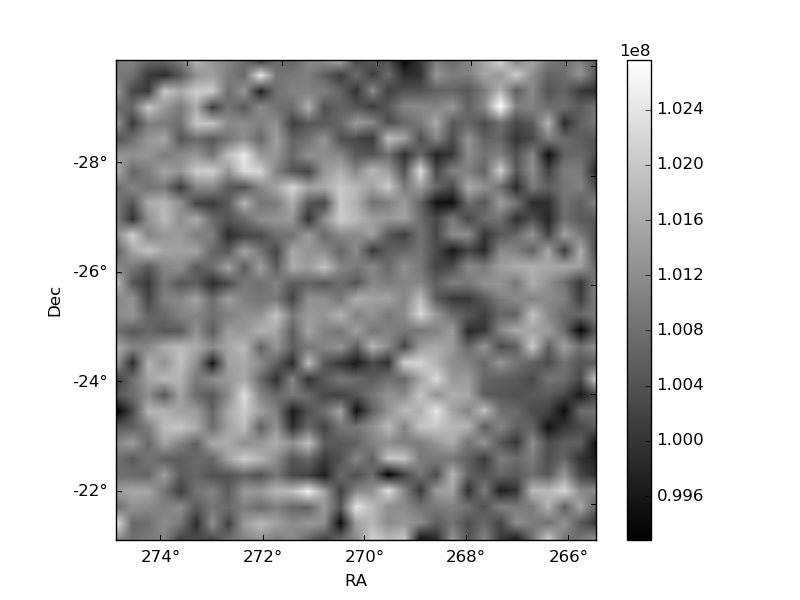
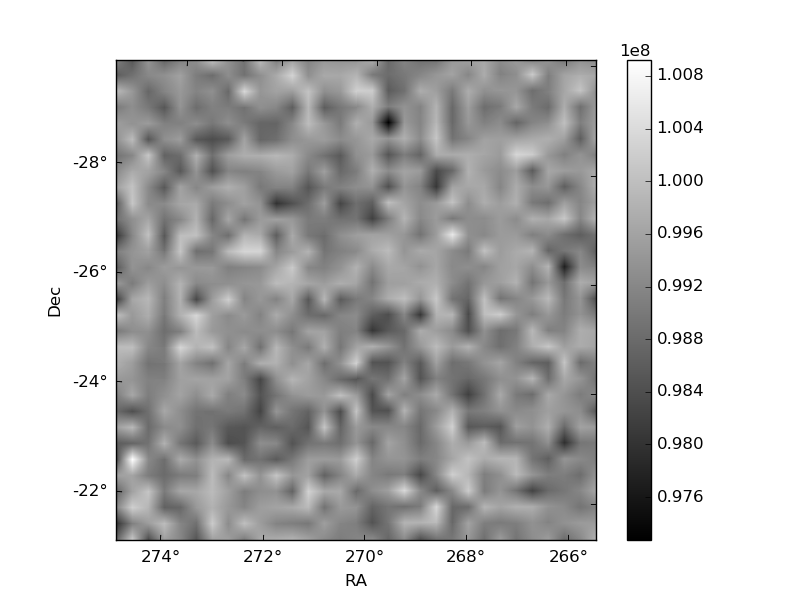
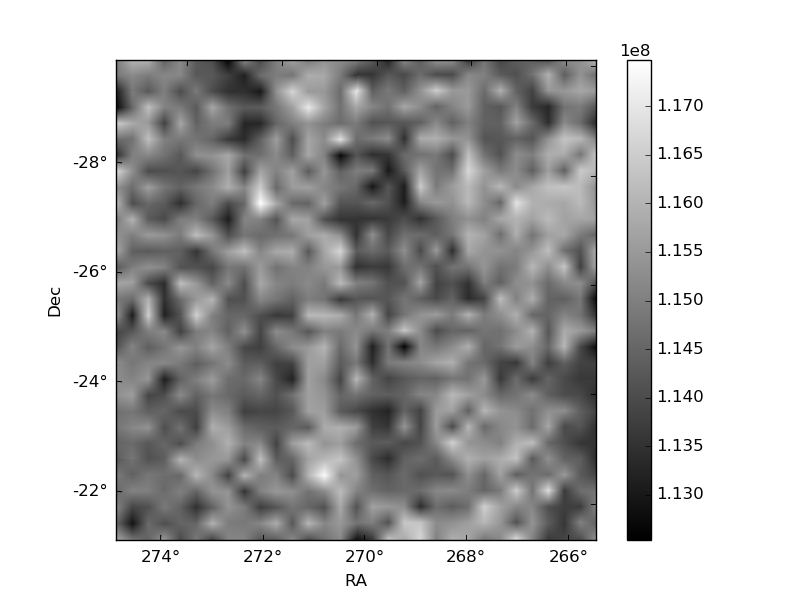
Histogram calculated using DETX and DETY for each event in the final _common_clean file
| Quadrant A | 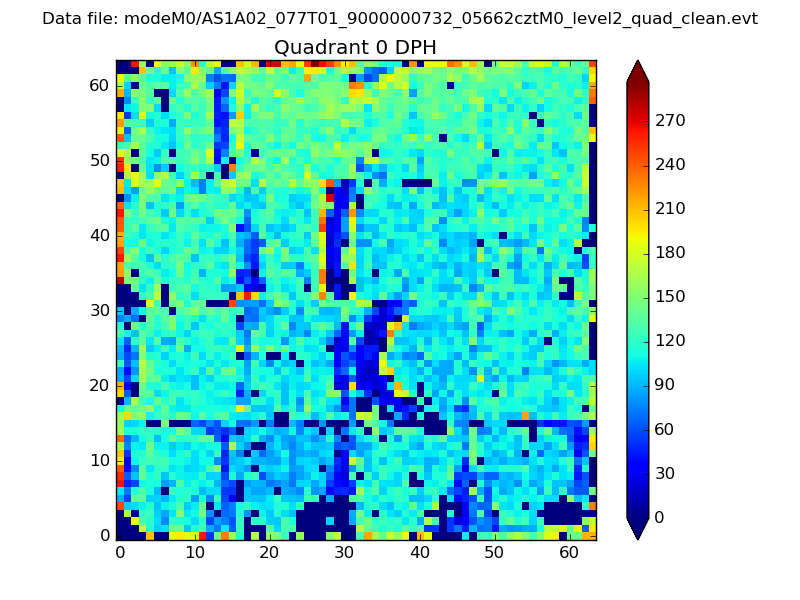 |
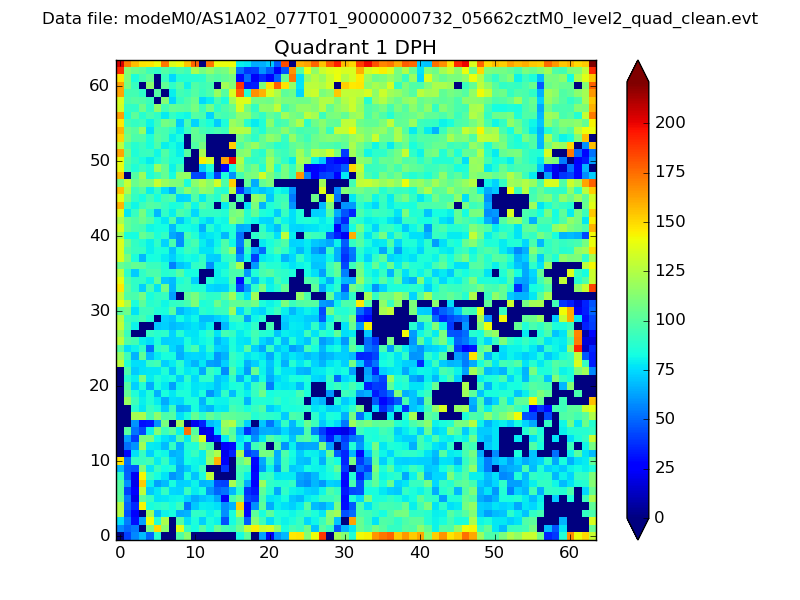 |
Quadrant B |
|---|---|---|---|
| Quadrant D | 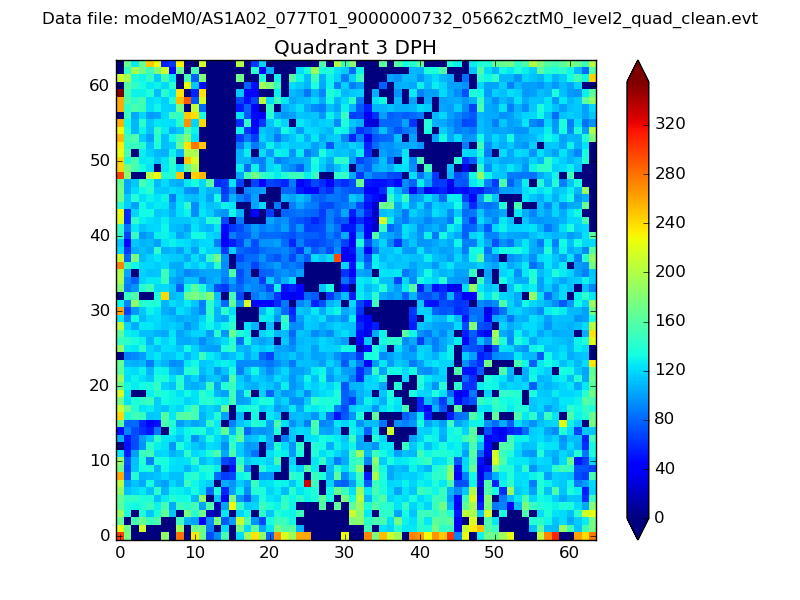 |
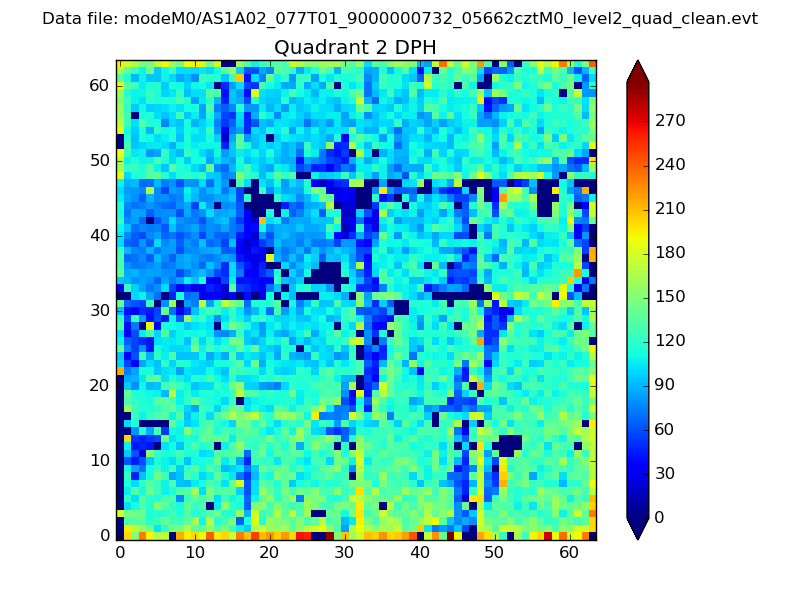 |
Quadrant C |
| Plot type | Count rate plots | Images |
|---|---|---|
| Comparison with Poisson distribution Blue bars denote a histogram of data divided into 1 sec bins. Red curve is a Poisson curve with rate = median count rate of data. |
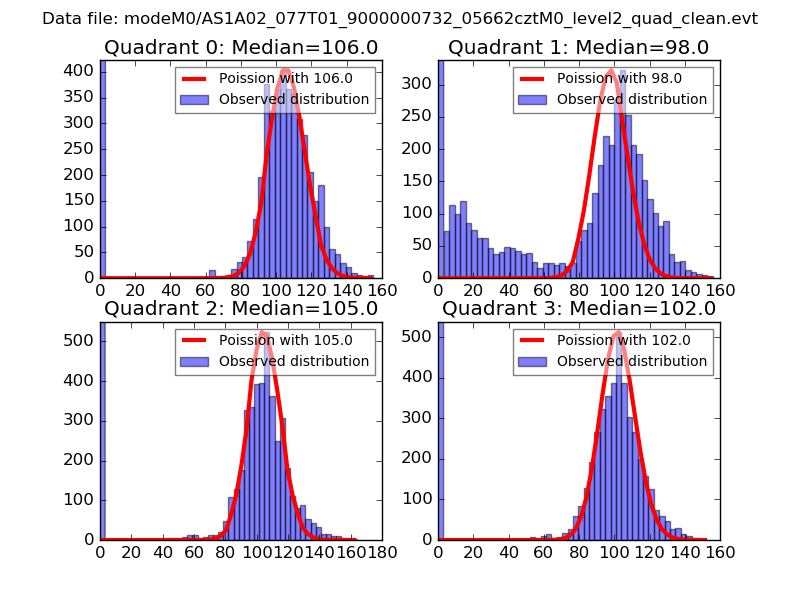 |
 |
| Quadrant-wise count rates Data is divided into 100 sec bins |
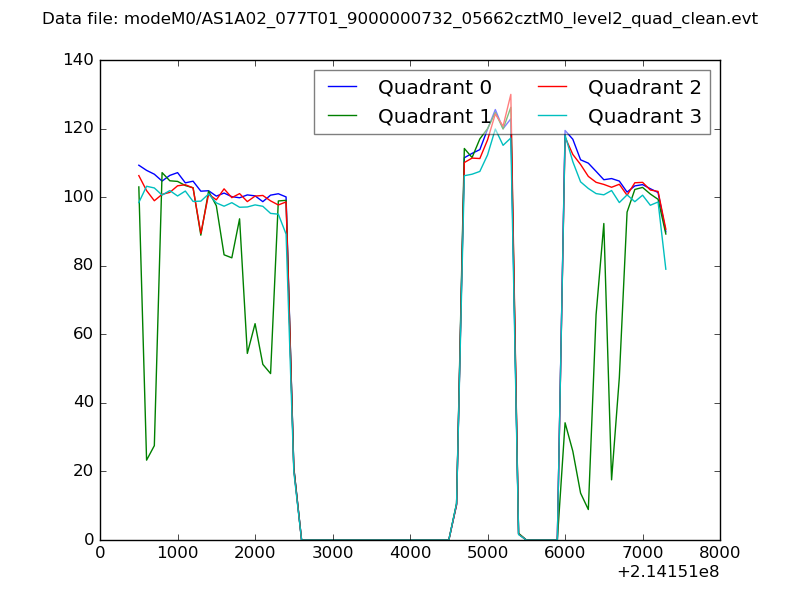 |
|
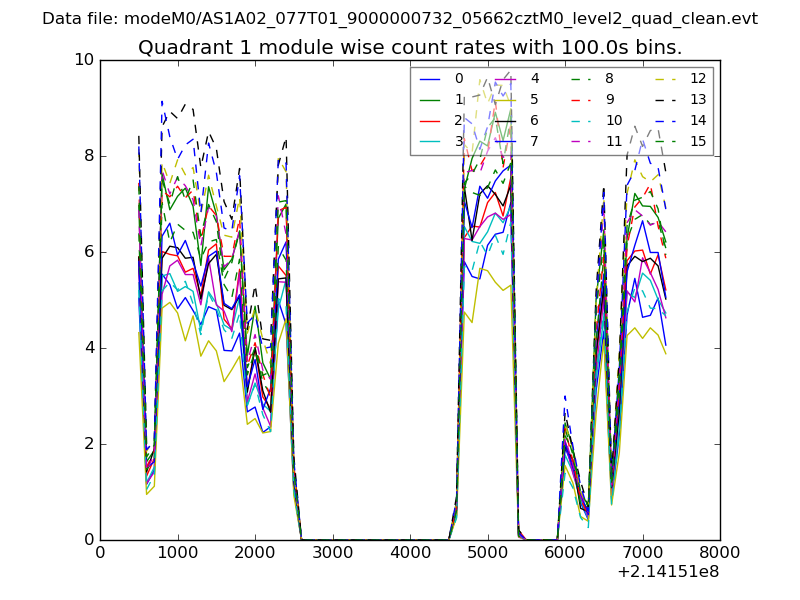
| Module-wise count rates for Quadrant A Data is divided into 100 sec bins |
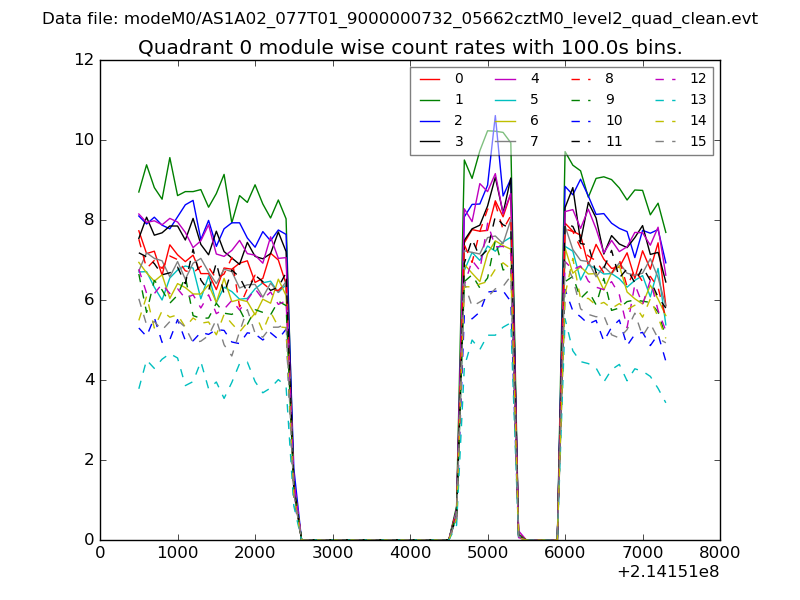 |
 |
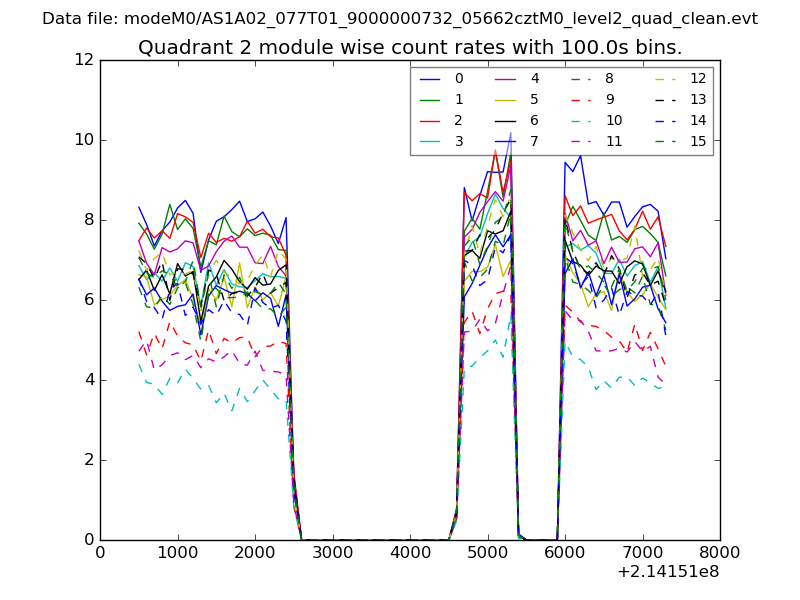
| Module-wise count rates for Quadrant B Data is divided into 100 sec bins |
 |
 |
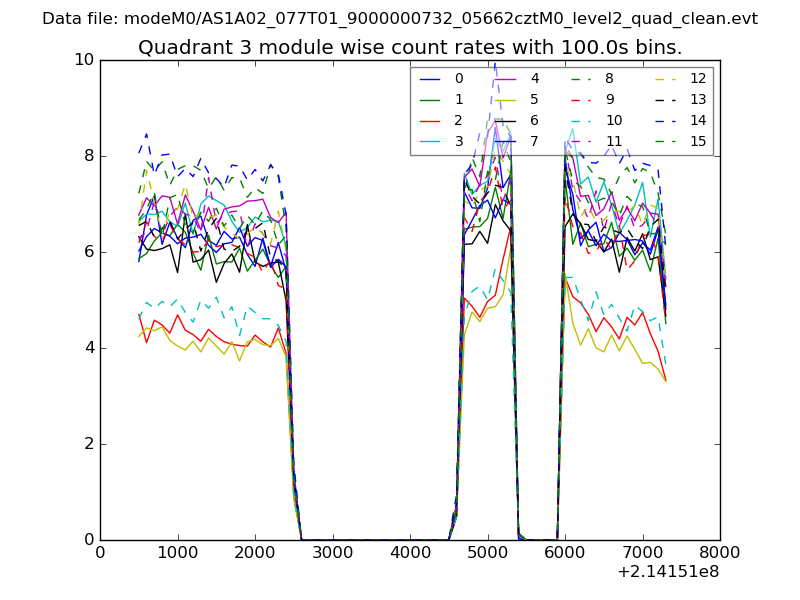
| Module-wise count rates for Quadrant C Data is divided into 100 sec bins |
 |
 |
| Module-wise count rates for Quadrant D Data is divided into 100 sec bins |
 |
 |
| Parameter | Plot |
|---|---|
| CZT HV Monitor | 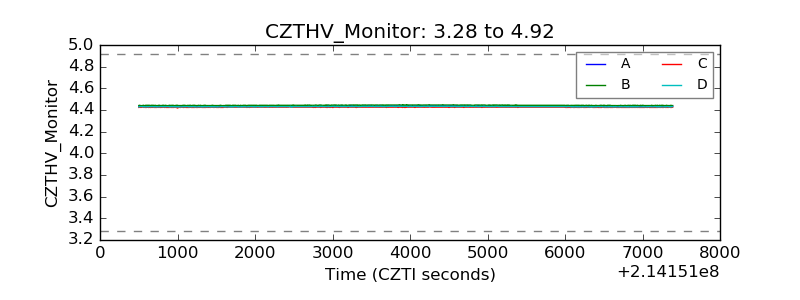 |
| D_VDD | 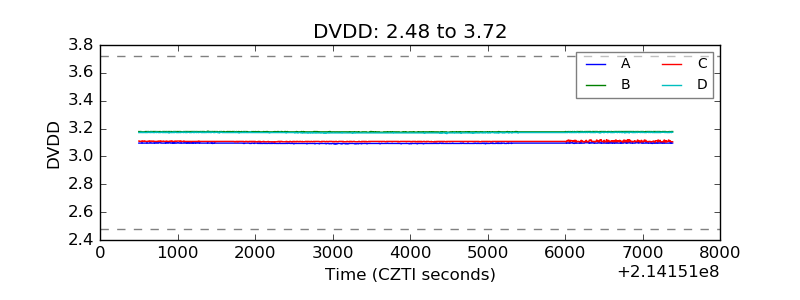 |
| Temperature 1 | 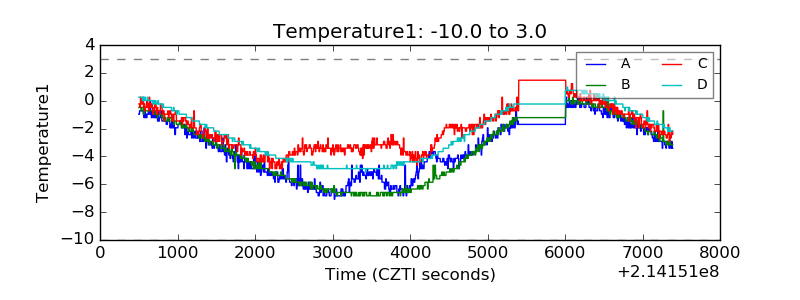 |
| Veto HV Monitor | 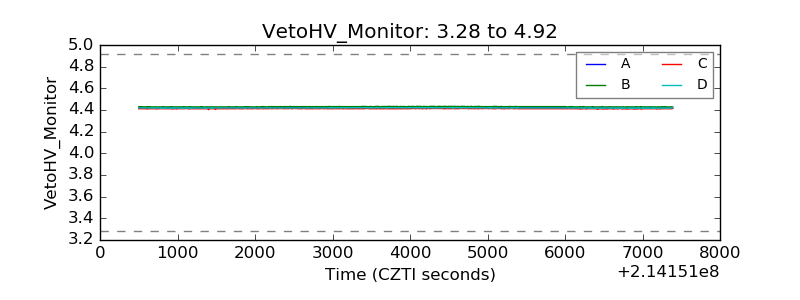 |
| Veto LLD | 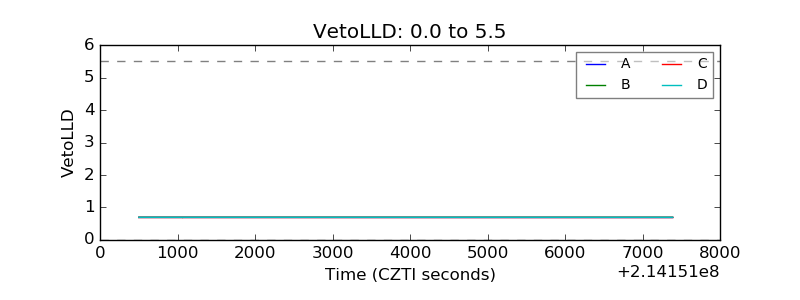 |
| Alpha Counter | 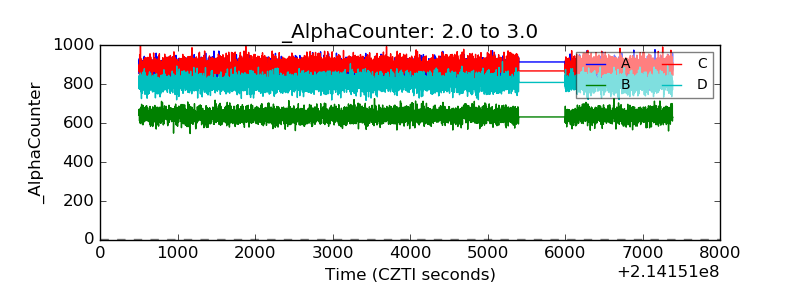 |
| _CPM_Rate | 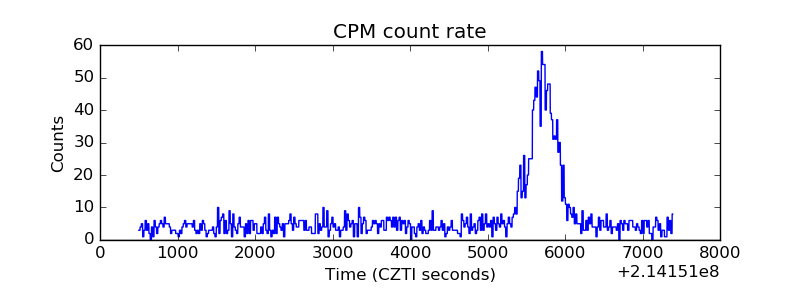 |
| CZT Counter | 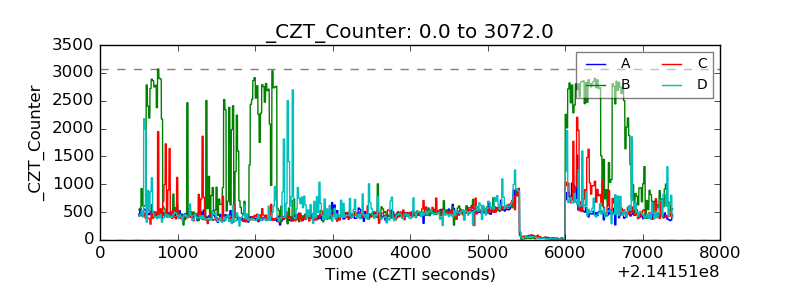 |
| +2.5 Volts monitor |  |
| +5 Volts monitor |  |
| _ROLL_ROT | 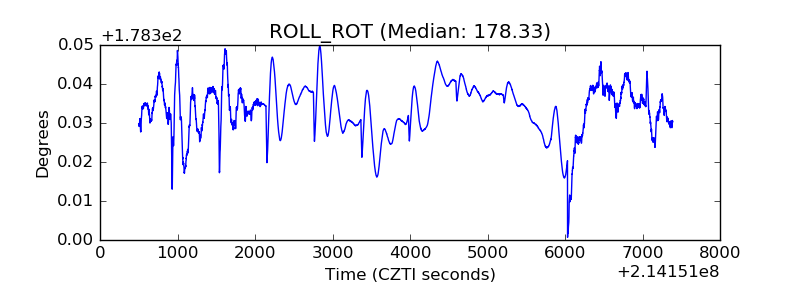 |
| _Roll_DEC | 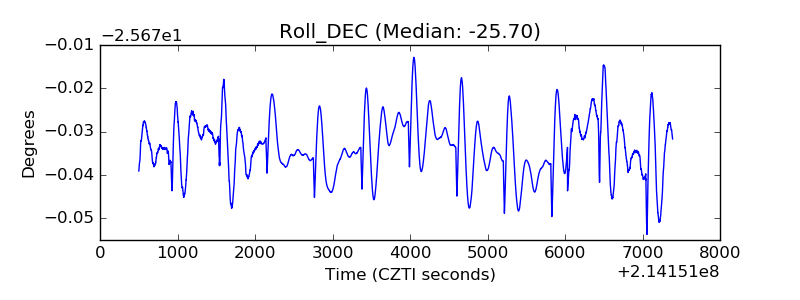 |
| _Roll_RA | 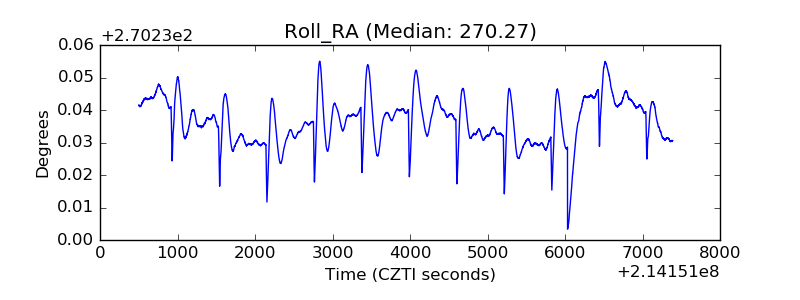 |
| Veto Counter | 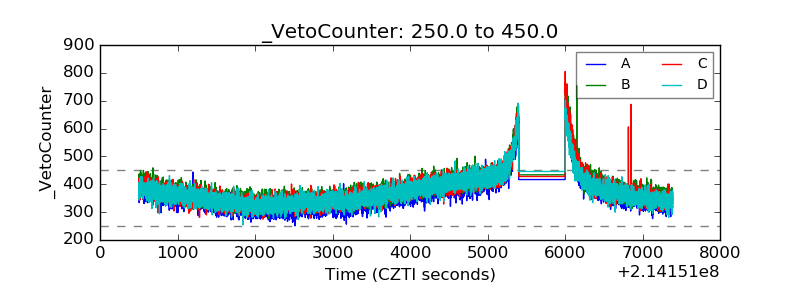 |