| Param | Original file | Final file |
|---|---|---|
| Filename | modeM0/AS1A02_077T01_9000000732_05668cztM0_level2.evt | modeM0/AS1A02_077T01_9000000732_05668cztM0_level2_quad_clean.evt |
| Size (bytes) | 1,089,855,360 | 160,905,600 |
| Size | 1.0 GB | 153.5 MB |
| Events in quadrant A | 7,481,537 | 942,686 |
| Events in quadrant B | 8,471,930 | 941,569 |
| Events in quadrant C | 7,408,703 | 954,897 |
| Events in quadrant D | 8,531,576 | 901,825 |
| Mode M0 | |||
|---|---|---|---|
| Quadrant | BADHDUFLAG | Total packets | Discarded packets |
| A | 0 | 37439 | 3704 |
| B | 0 | 40260 | 4275 |
| C | 0 | 37234 | 3729 |
| D | 0 | 42501 | 5363 |
| Mode SS | |||
|---|---|---|---|
| Quadrant | BADHDUFLAG | Total packets | Discarded packets |
| A | 0 | 372 | 44 |
| B | 0 | 372 | 36 |
| C | 0 | 372 | 32 |
| D | 0 | 372 | 54 |
| Mode M9 | |||
|---|---|---|---|
| Quadrant | BADHDUFLAG | Total packets | Discarded packets |
| A | 0 | 23 | 2 |
| B | 0 | 23 | 4 |
| C | 0 | 23 | 1 |
| D | 0 | 24 | 4 |
| Quadrant | Total seconds | Saturated seconds | Saturation percentage |
|---|---|---|---|
| A | 16451 | 80 | 0.486293% |
| B | 16401 | 148 | 0.902384% |
| C | 16450 | 43 | 0.261398% |
| D | 16299 | 224 | 1.374317% |
Noise dominated data is calculated using 1-second bins in cleaned event files. If a bin has >2000 counts, and if more than 50% of those come from <1% of pixels, then it is considered to be noise-dominated and hence unusable.
| Quadrant | # 1 sec bins | Bins with >0 counts | Bins with >2000 counts | High rate bins dominated by noise | Noise dominated (total time) | Noise dominated (detector-on time) | Marked lightcurve |
|---|---|---|---|---|---|---|---|
| A | 20530 | 17761 | 13 | 13 | 0.06% | 0.07% | 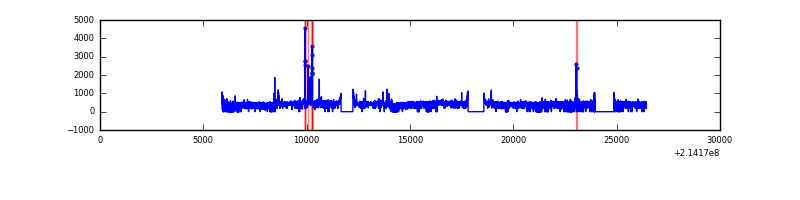 |
| B | 20530 | 17756 | 38 | 38 | 0.19% | 0.21% | 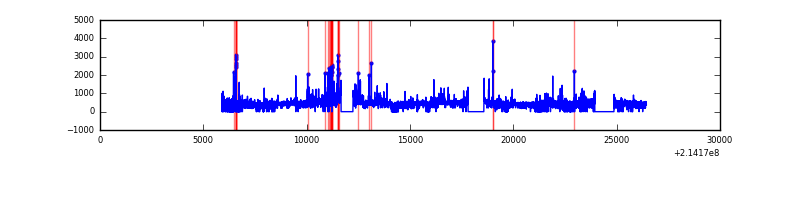 |
| C | 20530 | 17756 | 0 | 0 | 0.00% | 0.00% | 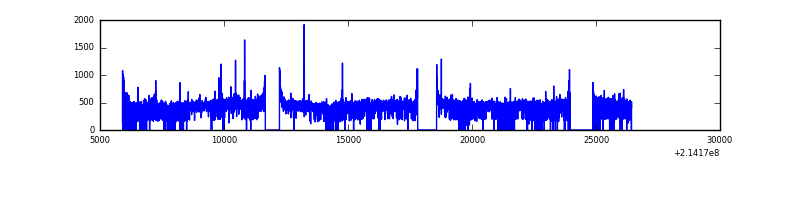 |
| D | 20530 | 17668 | 147 | 147 | 0.72% | 0.83% | 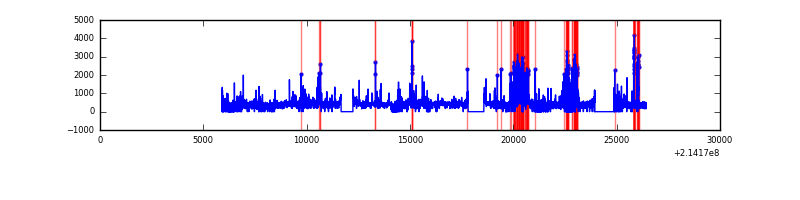 |
Top three noisy pixels from each quadrant. If the there are fewer than three noisy pixels in the level2.evt file, extra rows are filled as -1
| Pixel properties | Quadrant properties | ||||||
|---|---|---|---|---|---|---|---|
| Quadrant | DetID | PixID | Counts | Sigma | Mean | Median | Sigma |
| A | 0 | 50 | 98803 | 250.4 | 1890 | 1848 | 387.2 |
| A | 4 | 2 | 41370 | 102.07 | 1890 | 1848 | 387.2 |
| A | 13 | 6 | 38344 | 94.25 | 1890 | 1848 | 387.2 |
| B | 5 | 172 | 269300 | 729.76 | 1905 | 1857 | 366.5 |
| B | 0 | 219 | 219732 | 594.5 | 1905 | 1857 | 366.5 |
| B | 0 | 214 | 151718 | 408.92 | 1905 | 1857 | 366.5 |
| C | 1 | 16 | 221791 | 516.89 | 1829 | 1834 | 425.5 |
| C | 10 | 34 | 21930 | 47.22 | 1829 | 1834 | 425.5 |
| C | 13 | 61 | 14617 | 30.04 | 1829 | 1834 | 425.5 |
| D | 2 | 152 | 1318292 | 2966.38 | 1802 | 1743 | 443.8 |
| D | 2 | 136 | 164753 | 367.29 | 1802 | 1743 | 443.8 |
| D | 7 | 55 | 59749 | 130.7 | 1802 | 1743 | 443.8 |
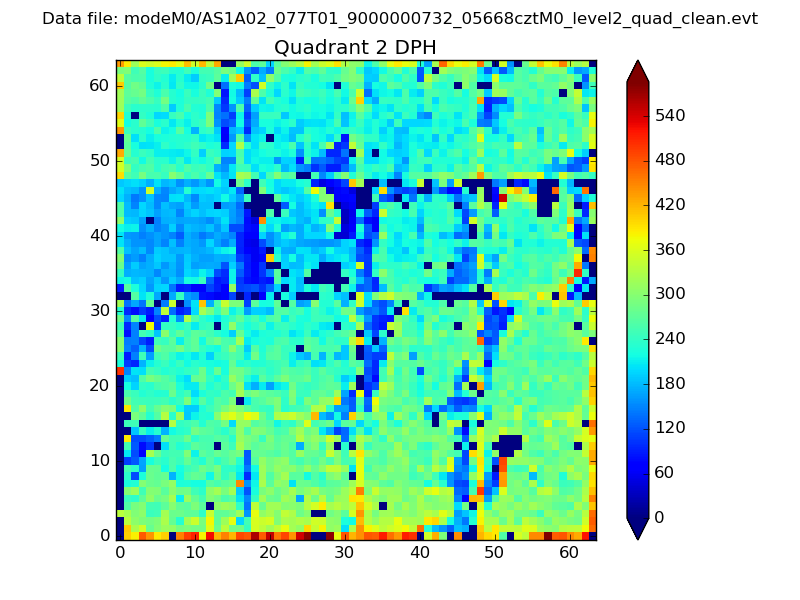
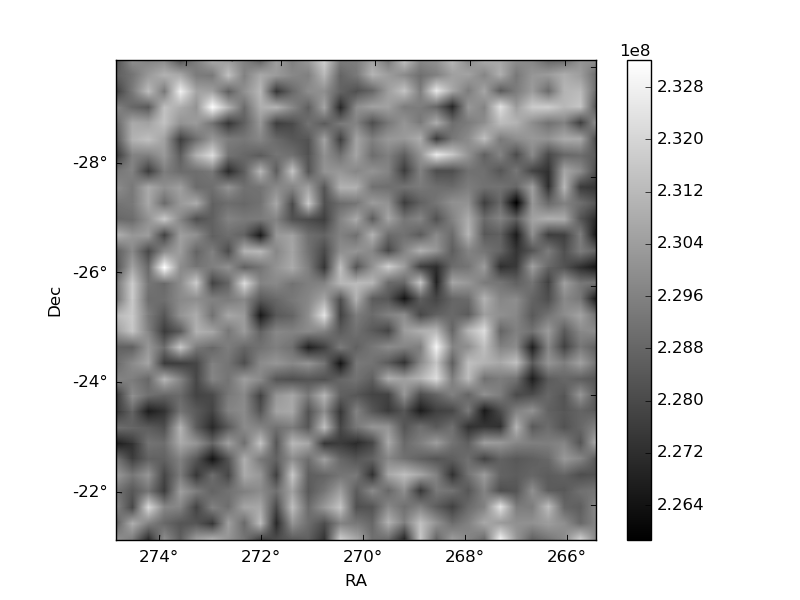
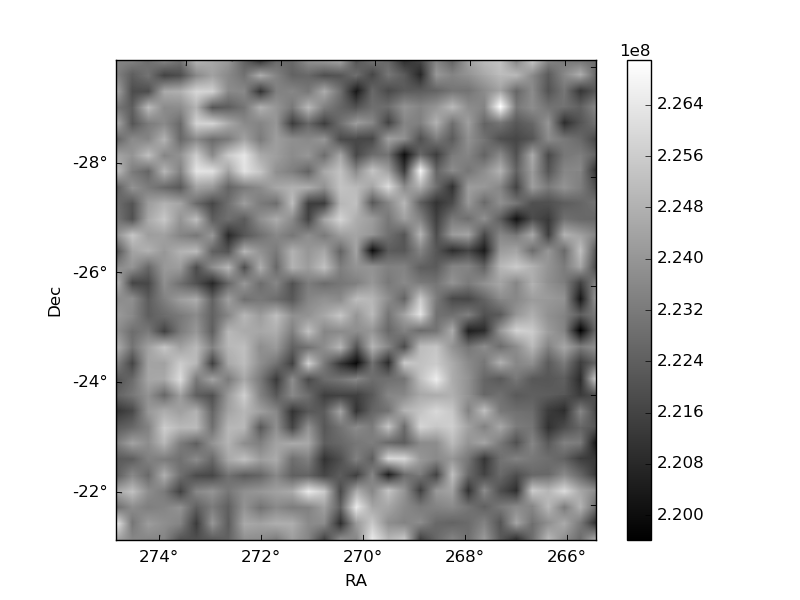
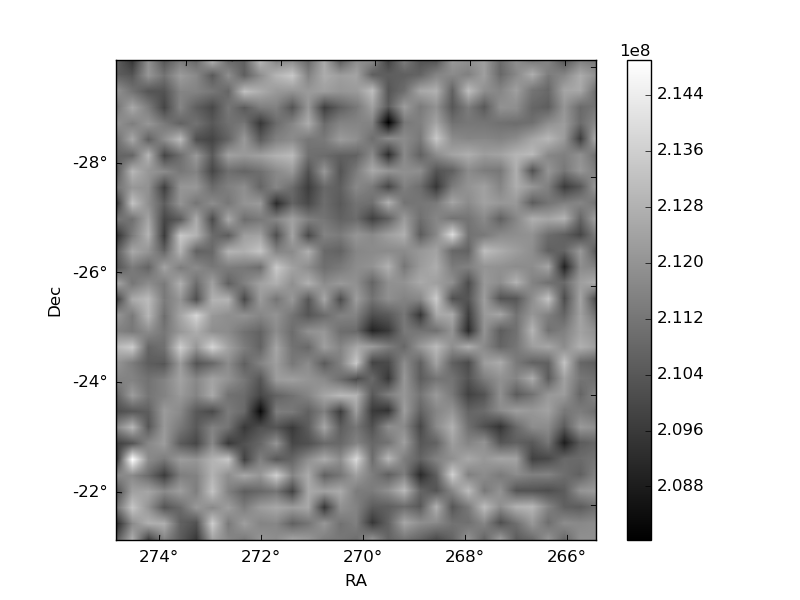
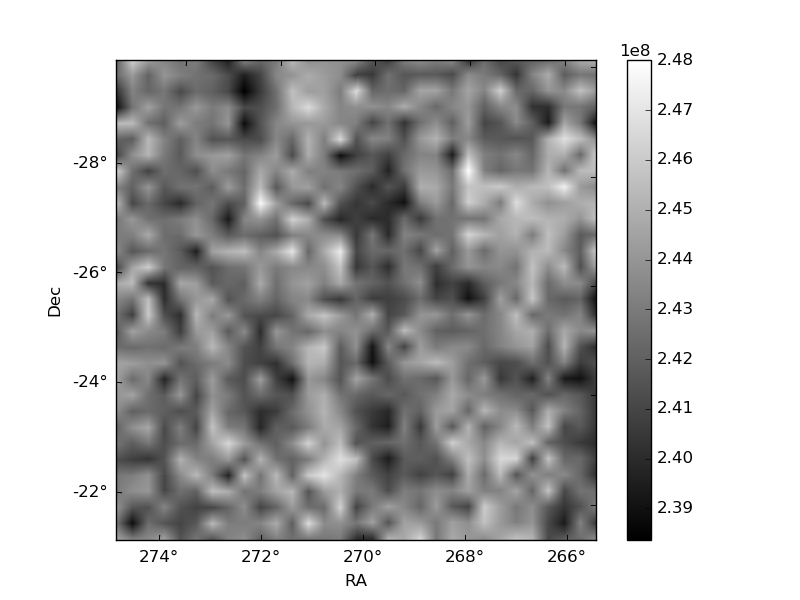
Histogram calculated using DETX and DETY for each event in the final _common_clean file
| Quadrant A | 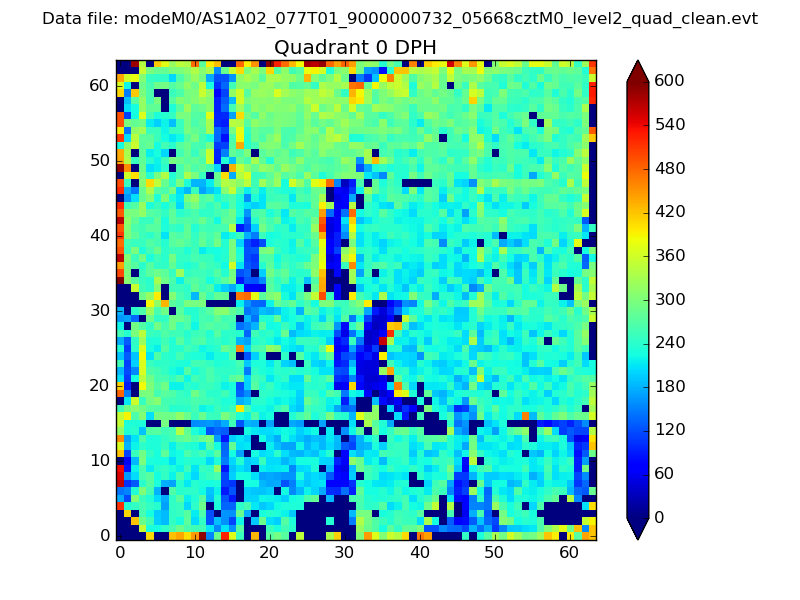 |
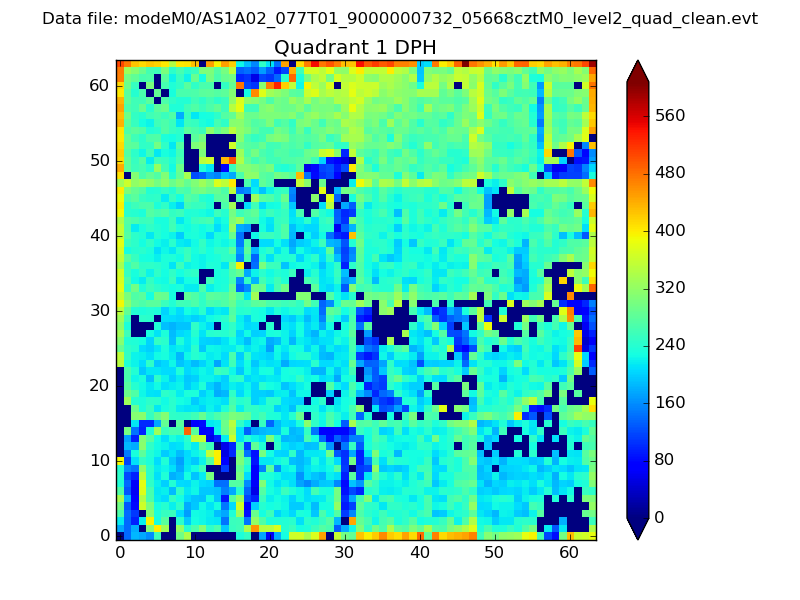 |
Quadrant B |
|---|---|---|---|
| Quadrant D | 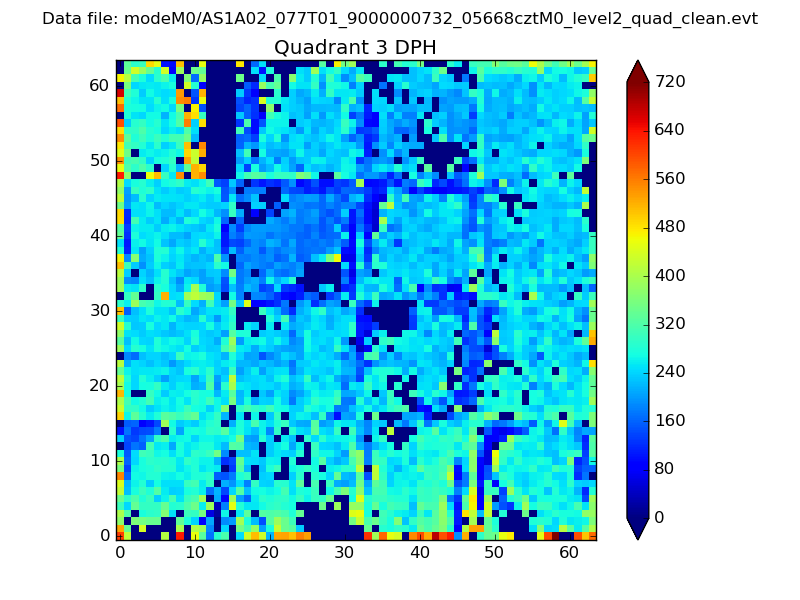 |
 |
Quadrant C |
| Plot type | Count rate plots | Images |
|---|---|---|
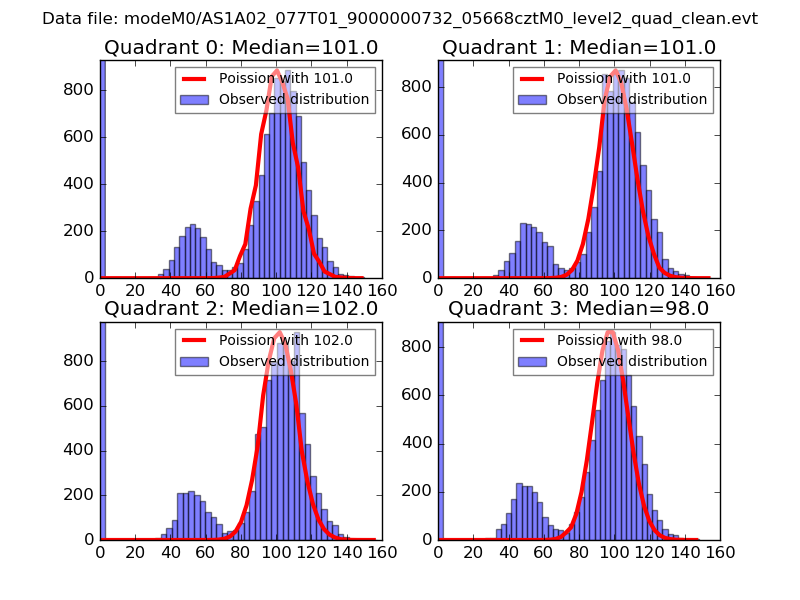
| Comparison with Poisson distribution Blue bars denote a histogram of data divided into 1 sec bins. Red curve is a Poisson curve with rate = median count rate of data. |
 |
 |
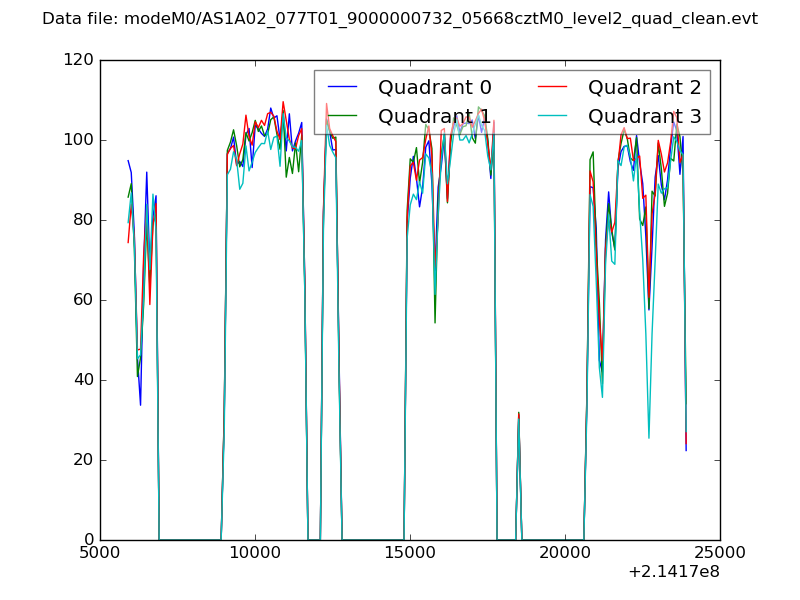
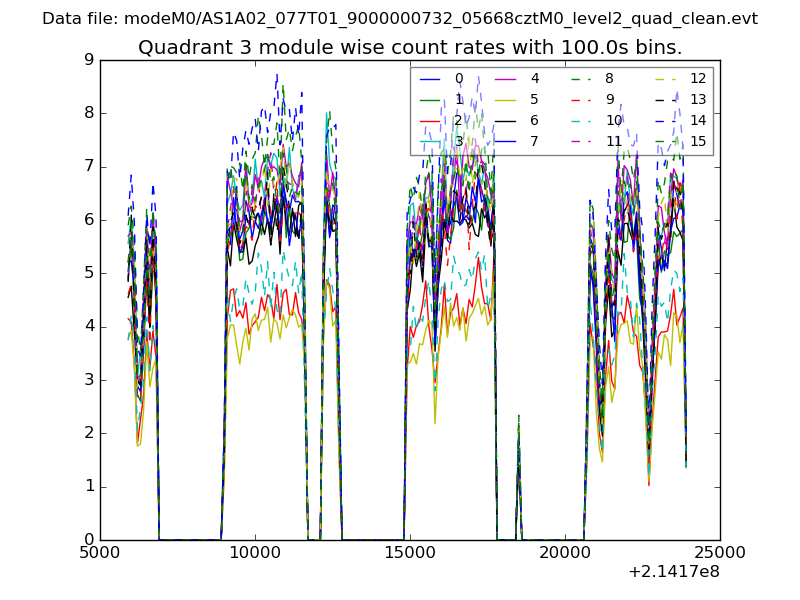
| Quadrant-wise count rates Data is divided into 100 sec bins |
 |
|
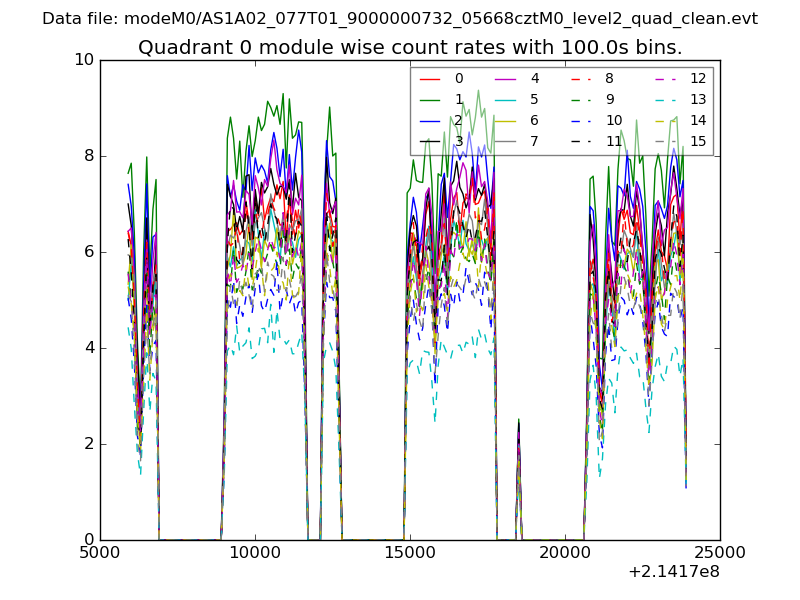
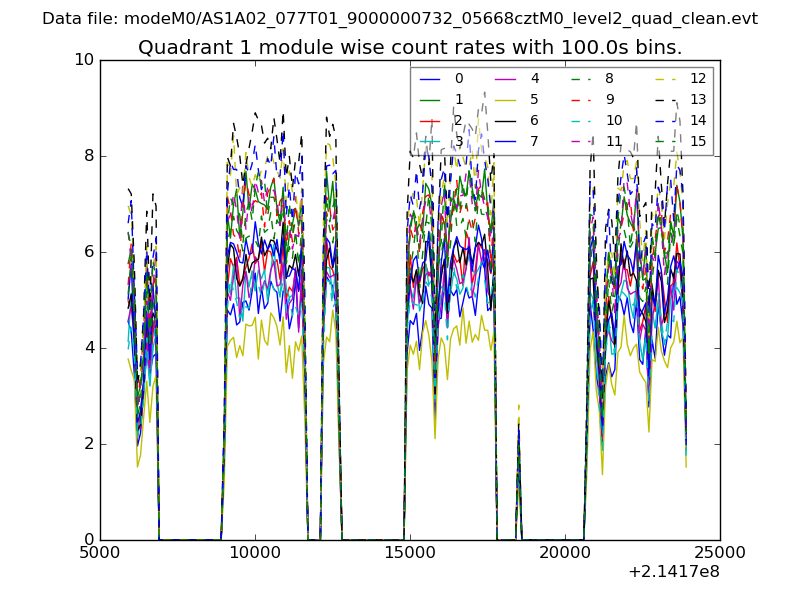
| Module-wise count rates for Quadrant A Data is divided into 100 sec bins |
 |
 |
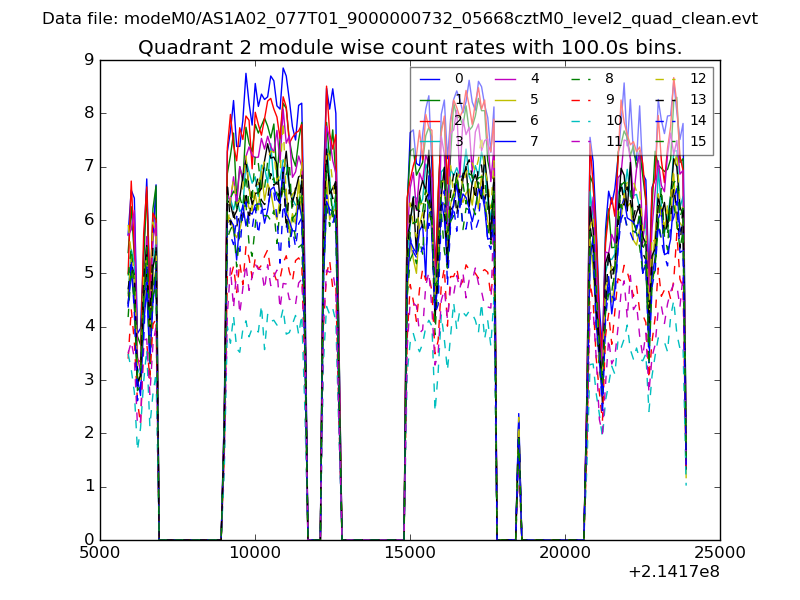
| Module-wise count rates for Quadrant B Data is divided into 100 sec bins |
 |
 |
| Module-wise count rates for Quadrant C Data is divided into 100 sec bins |
 |
 |
| Module-wise count rates for Quadrant D Data is divided into 100 sec bins |
 |
 |
| Parameter | Plot |
|---|---|
| CZT HV Monitor | 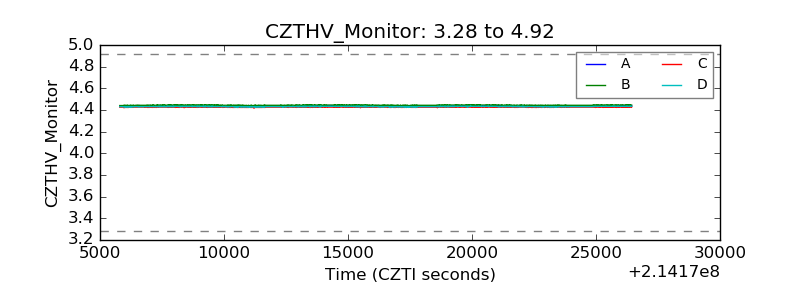 |
| D_VDD | 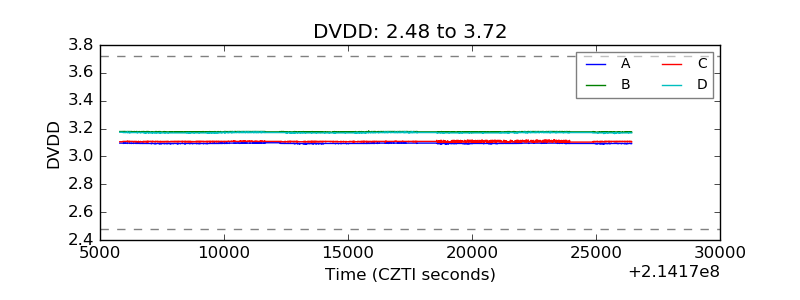 |
| Temperature 1 | 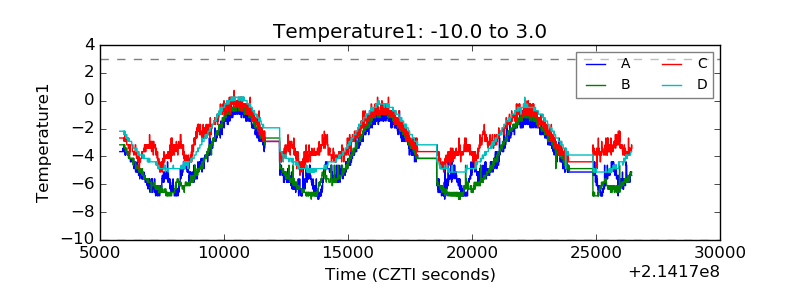 |
| Veto HV Monitor | 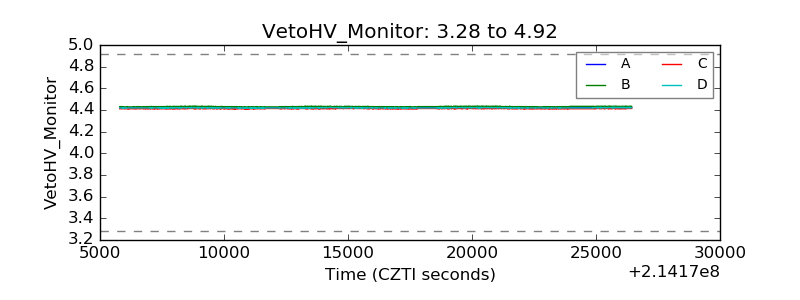 |
| Veto LLD | 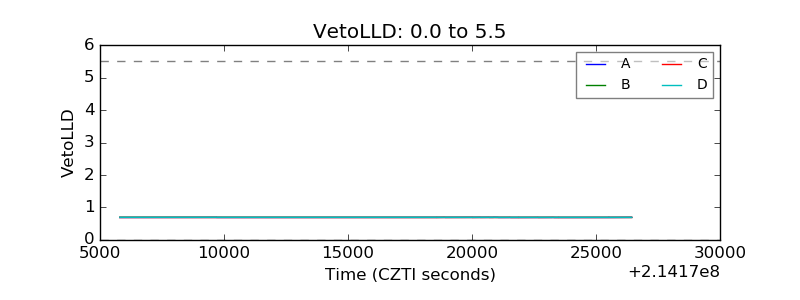 |
| Alpha Counter | 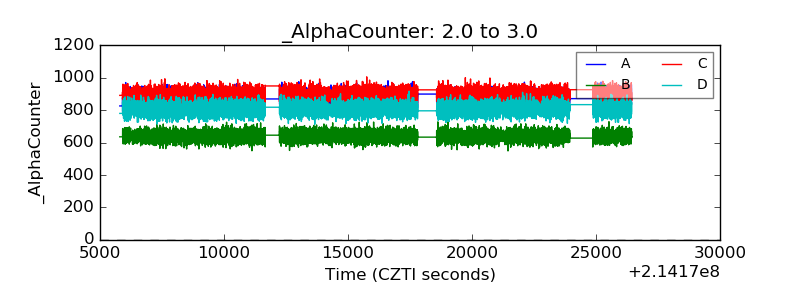 |
| _CPM_Rate | 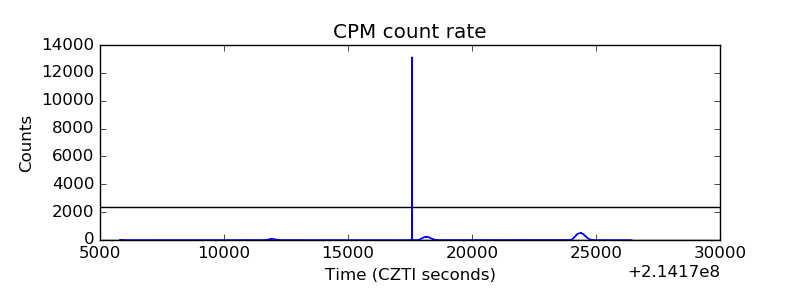 |
| CZT Counter | 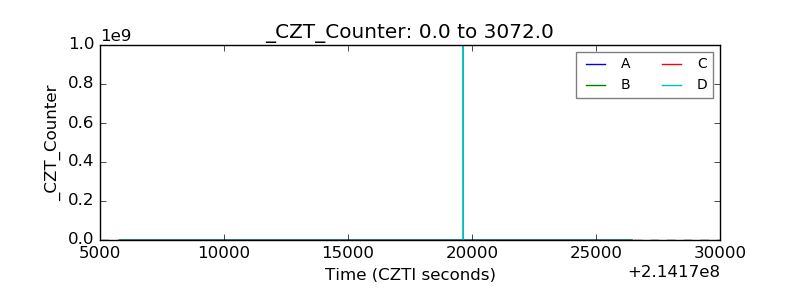 |
| +2.5 Volts monitor |  |
| +5 Volts monitor |  |
| _ROLL_ROT | 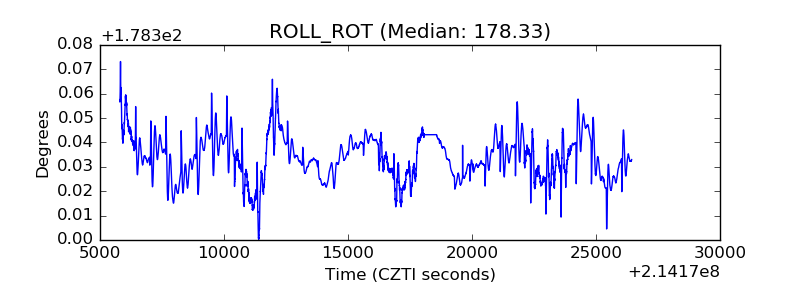 |
| _Roll_DEC | 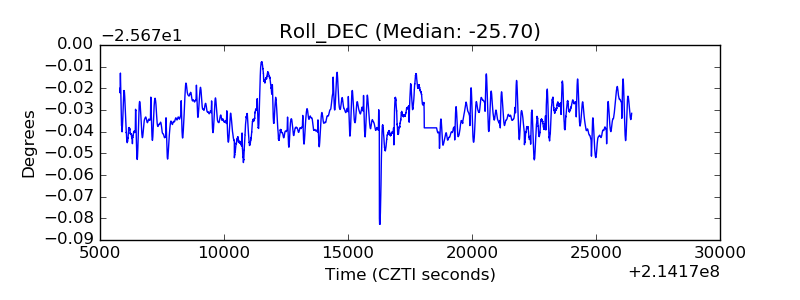 |
| _Roll_RA | 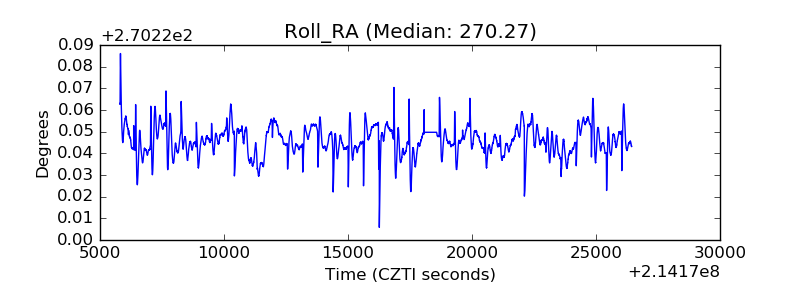 |
| Veto Counter | 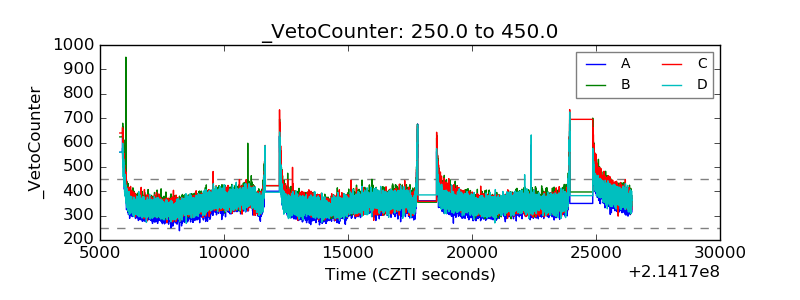 |