| Param | Original file | Final file |
|---|---|---|
| Filename | modeM0/AS1A02_077T01_9000000732_05675cztM0_level2.evt | modeM0/AS1A02_077T01_9000000732_05675cztM0_level2_quad_clean.evt |
| Size (bytes) | 802,751,040 | 149,313,600 |
| Size | 765.6 MB | 142.4 MB |
| Events in quadrant A | 5,409,428 | 948,691 |
| Events in quadrant B | 6,716,779 | 942,601 |
| Events in quadrant C | 5,453,099 | 940,499 |
| Events in quadrant D | 5,966,066 | 907,620 |
| Mode M0 | |||
|---|---|---|---|
| Quadrant | BADHDUFLAG | Total packets | Discarded packets |
| A | 0 | 23612 | 7 |
| B | 0 | 27440 | 2 |
| C | 0 | 23903 | 8 |
| D | 0 | 25080 | 2 |
| Mode SS | |||
|---|---|---|---|
| Quadrant | BADHDUFLAG | Total packets | Discarded packets |
| A | 0 | 232 | 0 |
| B | 0 | 232 | 0 |
| C | 0 | 232 | 0 |
| D | 0 | 232 | 0 |
| Mode M9 | |||
|---|---|---|---|
| Quadrant | BADHDUFLAG | Total packets | Discarded packets |
| A | 0 | 23 | 0 |
| B | 0 | 23 | 0 |
| C | 0 | 23 | 0 |
| D | 0 | 23 | 0 |
| Quadrant | Total seconds | Saturated seconds | Saturation percentage |
|---|---|---|---|
| A | 11306 | 171 | 1.512471% |
| B | 11308 | 239 | 2.113548% |
| C | 11305 | 103 | 0.911101% |
| D | 11308 | 179 | 1.582950% |
Noise dominated data is calculated using 1-second bins in cleaned event files. If a bin has >2000 counts, and if more than 50% of those come from <1% of pixels, then it is considered to be noise-dominated and hence unusable.
| Quadrant | # 1 sec bins | Bins with >0 counts | Bins with >2000 counts | High rate bins dominated by noise | Noise dominated (total time) | Noise dominated (detector-on time) | Marked lightcurve |
|---|---|---|---|---|---|---|---|
| A | 13628 | 11310 | 6 | 6 | 0.04% | 0.05% | 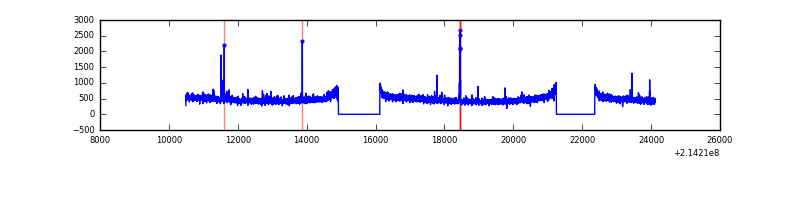 |
| B | 13628 | 11310 | 63 | 63 | 0.46% | 0.56% | 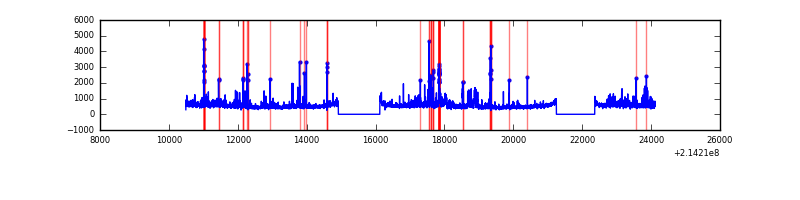 |
| C | 13628 | 11310 | 1 | 1 | 0.01% | 0.01% | 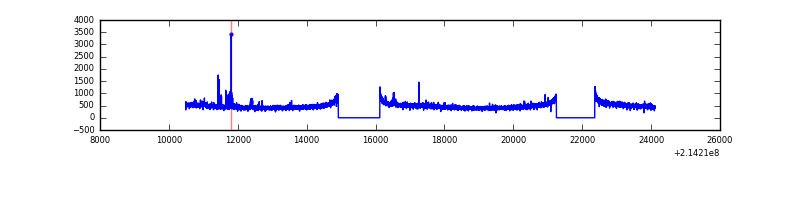 |
| D | 13628 | 11310 | 50 | 50 | 0.37% | 0.44% | 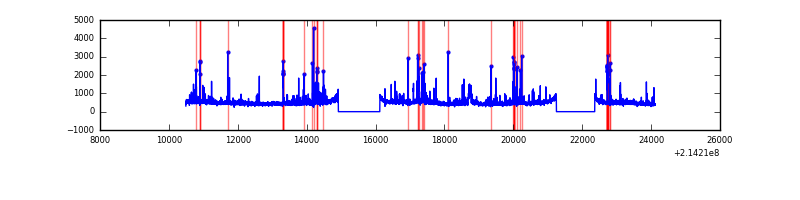 |
Top three noisy pixels from each quadrant. If the there are fewer than three noisy pixels in the level2.evt file, extra rows are filled as -1
| Pixel properties | Quadrant properties | ||||||
|---|---|---|---|---|---|---|---|
| Quadrant | DetID | PixID | Counts | Sigma | Mean | Median | Sigma |
| A | 0 | 50 | 33362 | 114.49 | 1377 | 1350 | 279.6 |
| A | 13 | 6 | 23165 | 78.02 | 1377 | 1350 | 279.6 |
| A | 4 | 2 | 20859 | 69.77 | 1377 | 1350 | 279.6 |
| B | 5 | 172 | 411324 | 1569.89 | 1373 | 1342 | 261.2 |
| B | 15 | 204 | 377943 | 1442.07 | 1373 | 1342 | 261.2 |
| B | 0 | 214 | 287522 | 1095.83 | 1373 | 1342 | 261.2 |
| C | 1 | 16 | 316894 | 1041.24 | 1311 | 1319 | 303.1 |
| C | 13 | 61 | 10778 | 31.21 | 1311 | 1319 | 303.1 |
| C | 10 | 34 | 8966 | 25.23 | 1311 | 1319 | 303.1 |
| D | 2 | 152 | 345418 | 1055.95 | 1326 | 1285 | 325.9 |
| D | 8 | 195 | 212304 | 647.5 | 1326 | 1285 | 325.9 |
| D | 10 | 15 | 97575 | 295.46 | 1326 | 1285 | 325.9 |
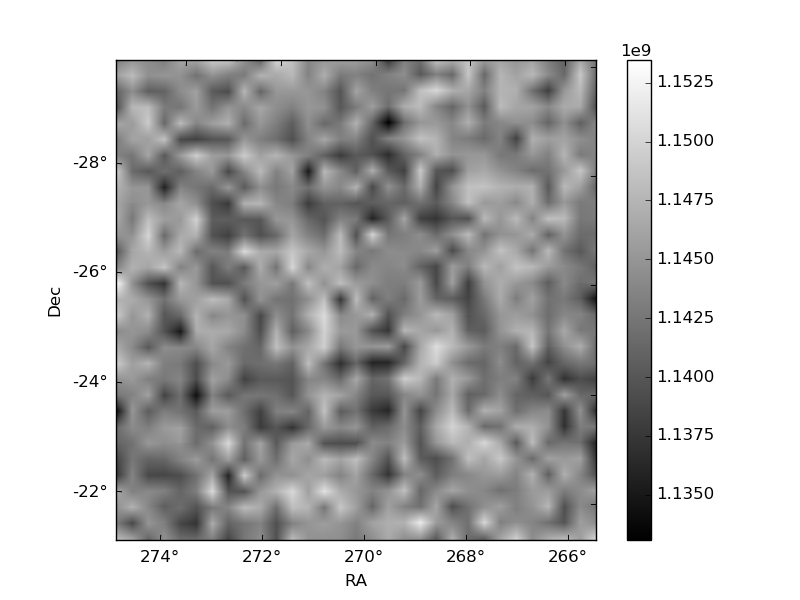
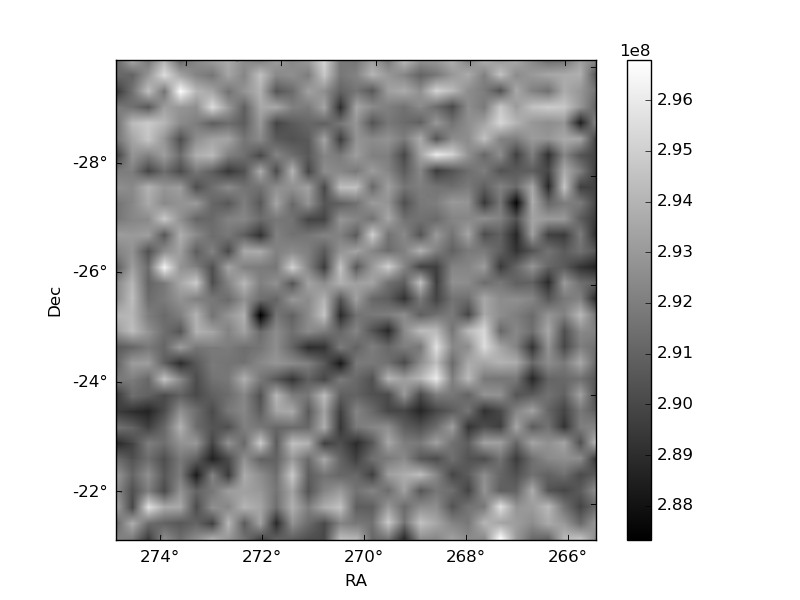
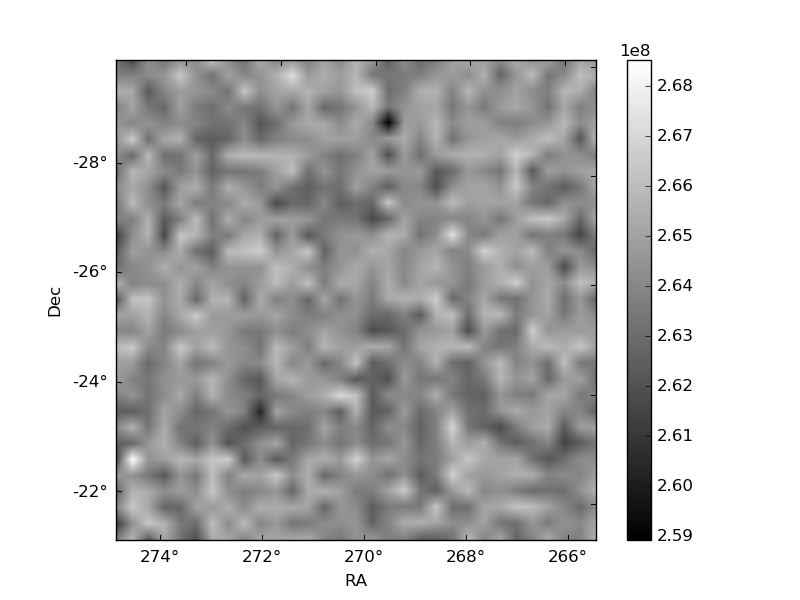
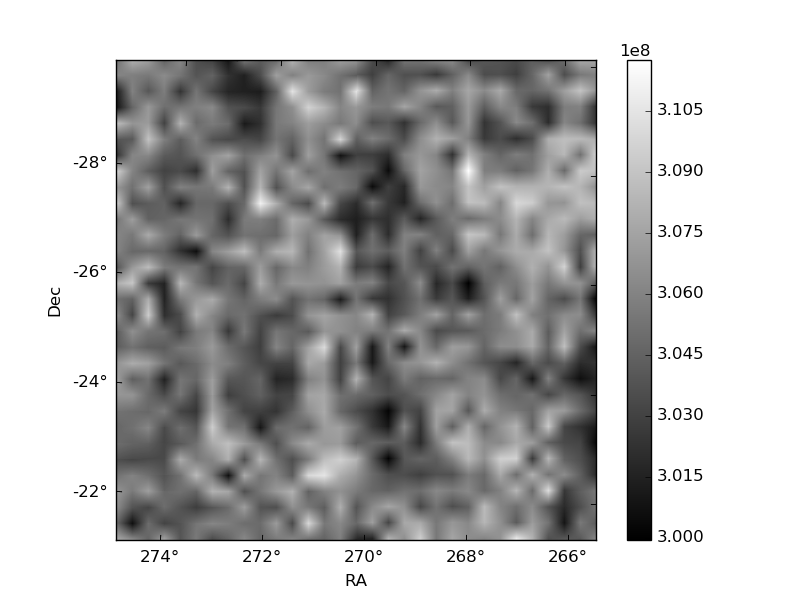
Histogram calculated using DETX and DETY for each event in the final _common_clean file
| Quadrant A | 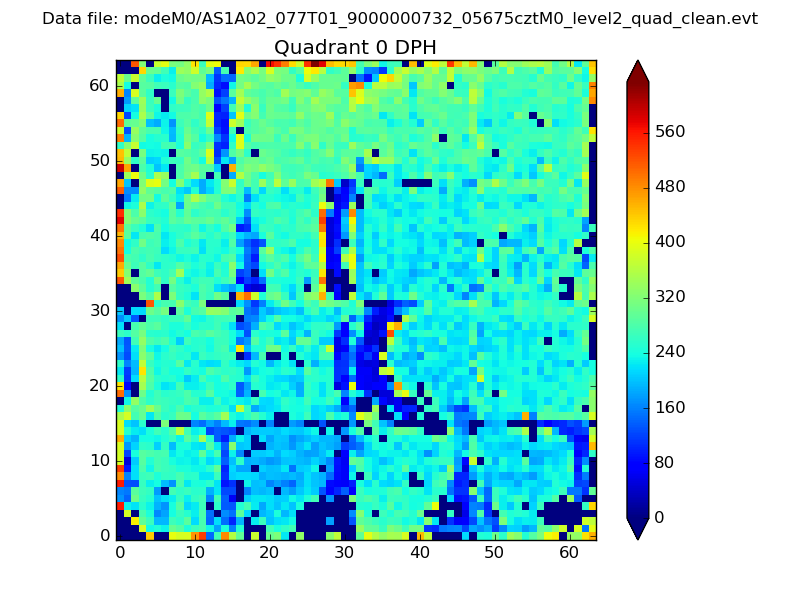 |
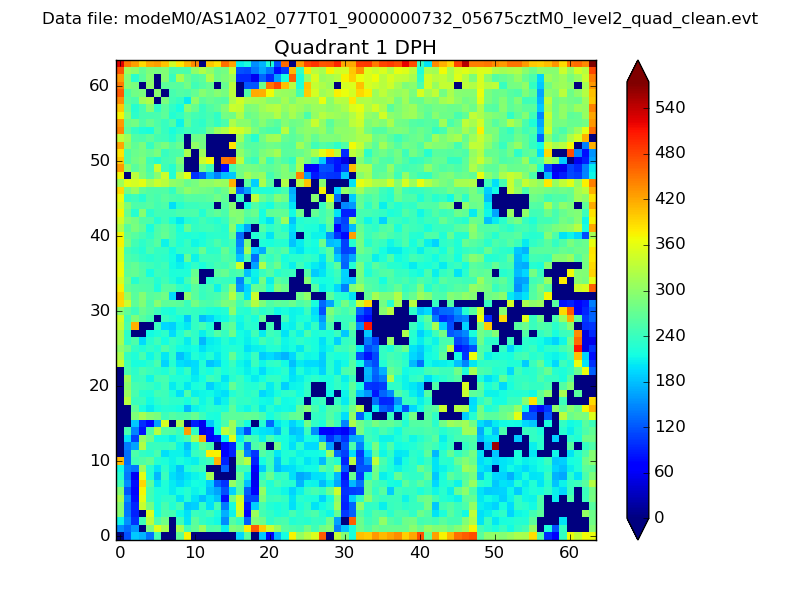 |
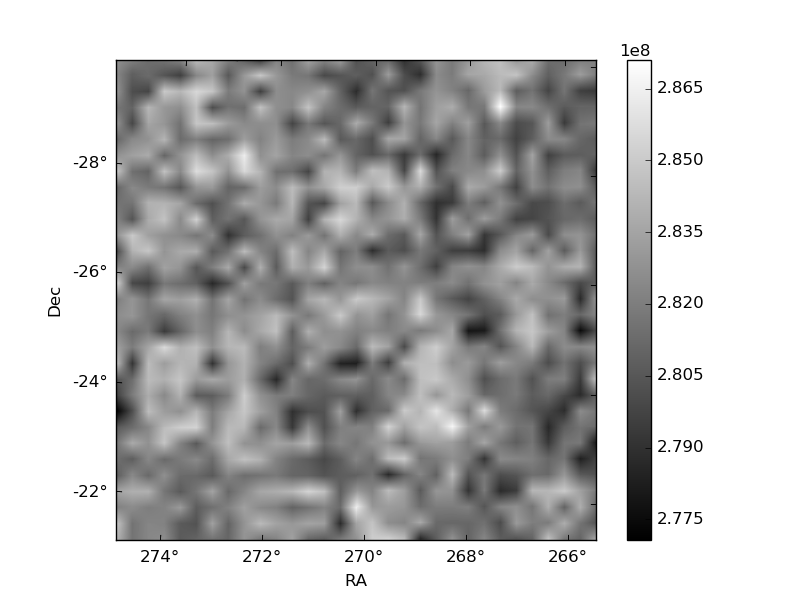
Quadrant B |
|---|---|---|---|
| Quadrant D | 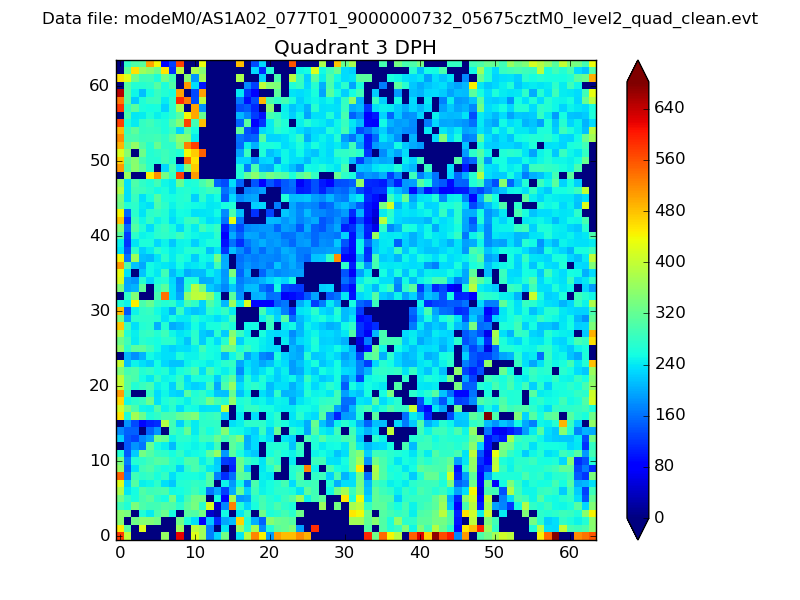 |
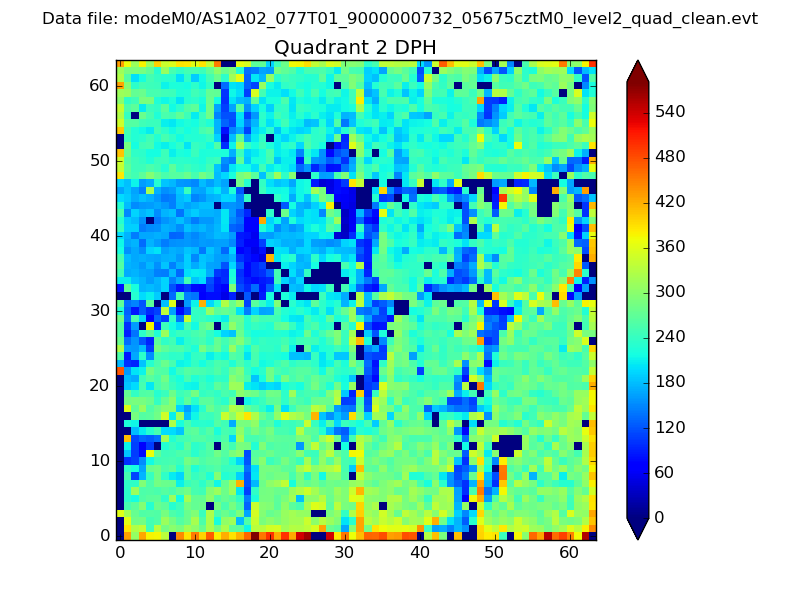 |
Quadrant C |
| Plot type | Count rate plots | Images |
|---|---|---|
| Comparison with Poisson distribution Blue bars denote a histogram of data divided into 1 sec bins. Red curve is a Poisson curve with rate = median count rate of data. |
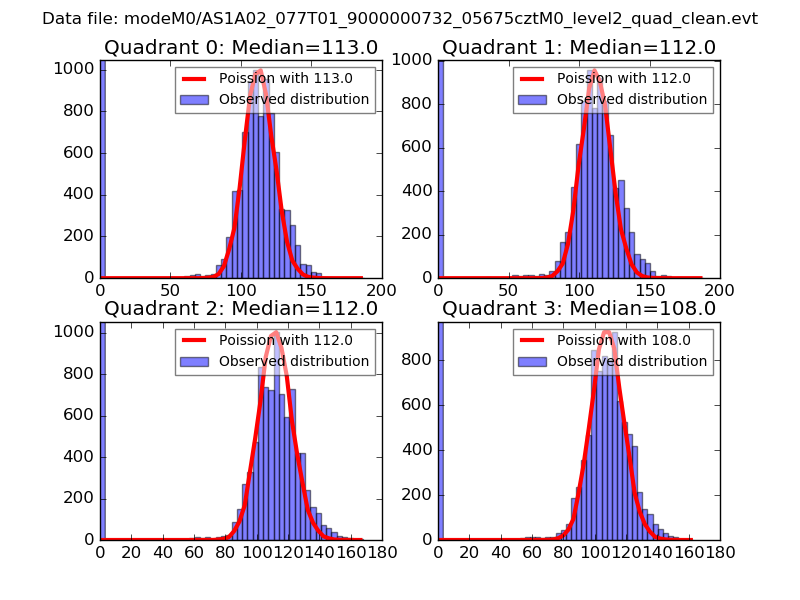 |
 |
| Quadrant-wise count rates Data is divided into 100 sec bins |
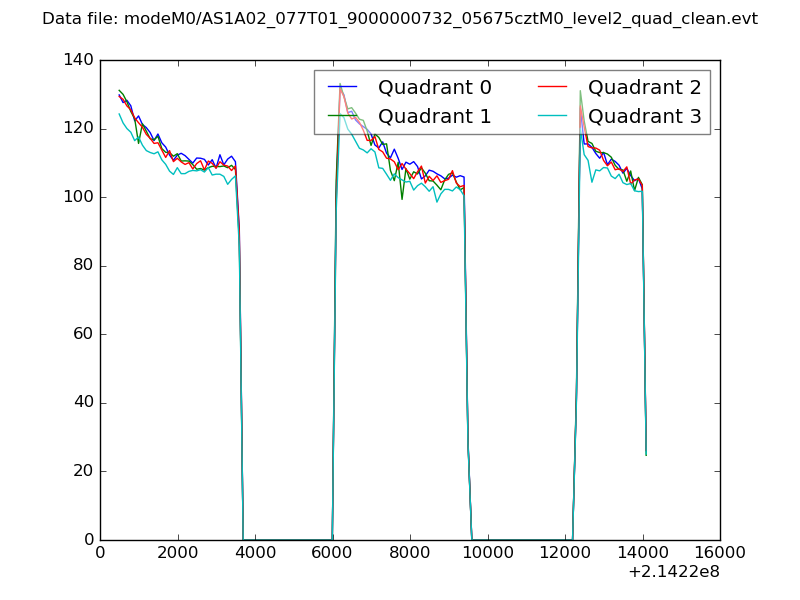 |
|
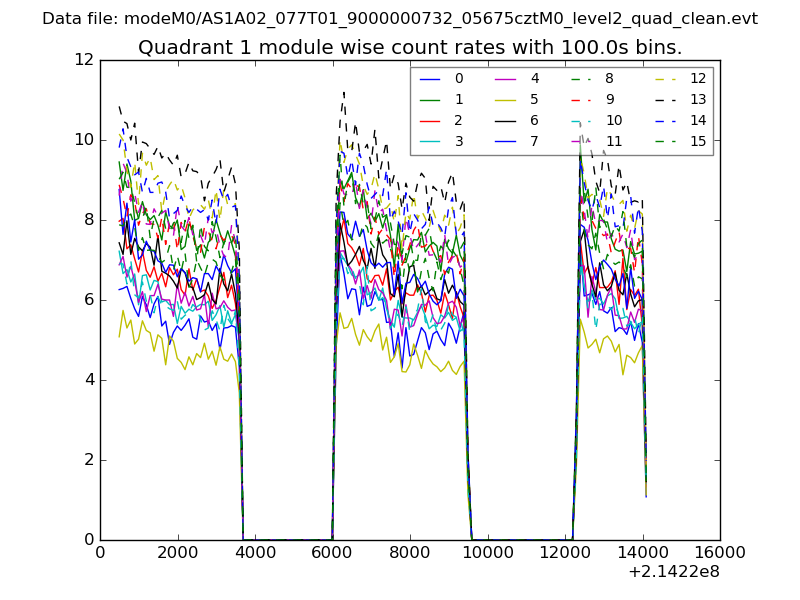
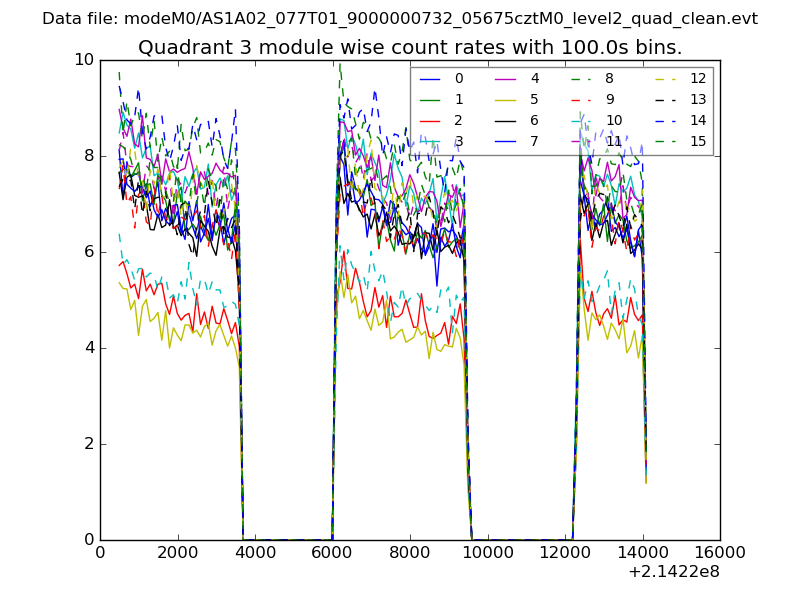
| Module-wise count rates for Quadrant A Data is divided into 100 sec bins |
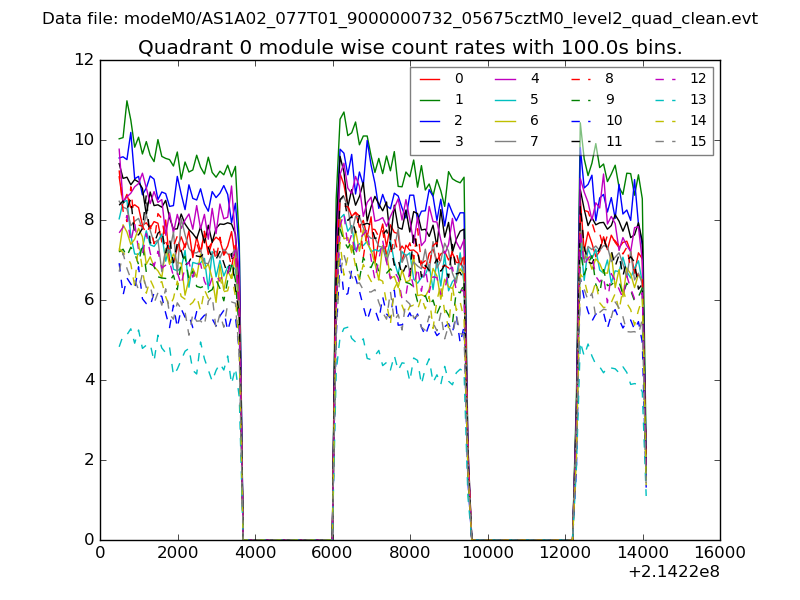 |
 |
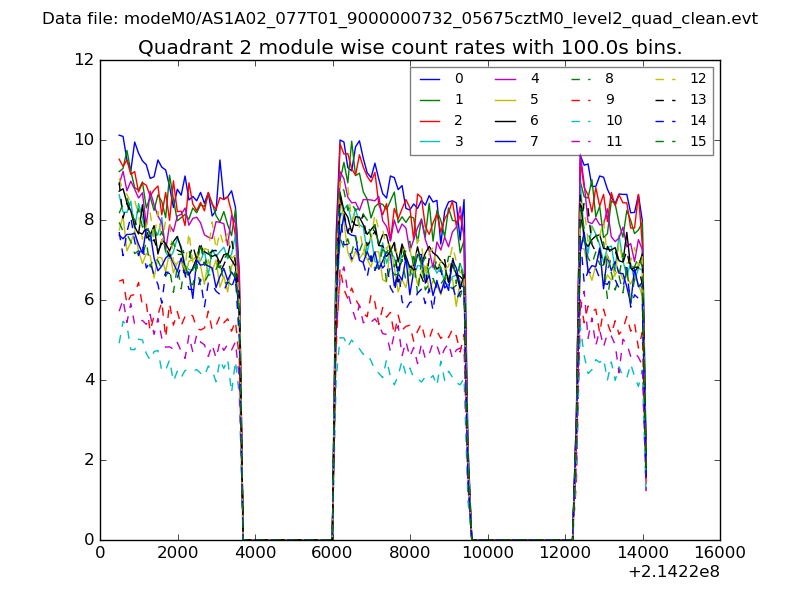
| Module-wise count rates for Quadrant B Data is divided into 100 sec bins |
 |
 |
| Module-wise count rates for Quadrant C Data is divided into 100 sec bins |
 |
 |
| Module-wise count rates for Quadrant D Data is divided into 100 sec bins |
 |
 |
| Parameter | Plot |
|---|---|
| CZT HV Monitor | 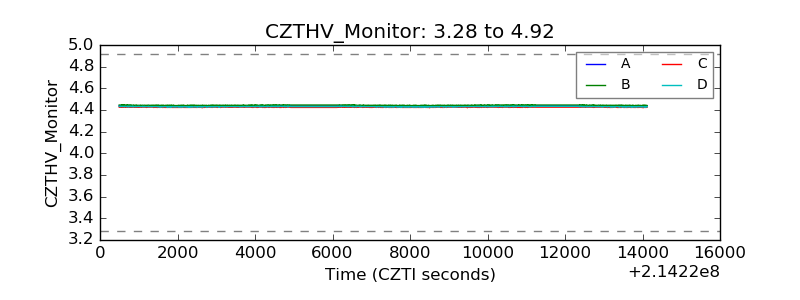 |
| D_VDD | 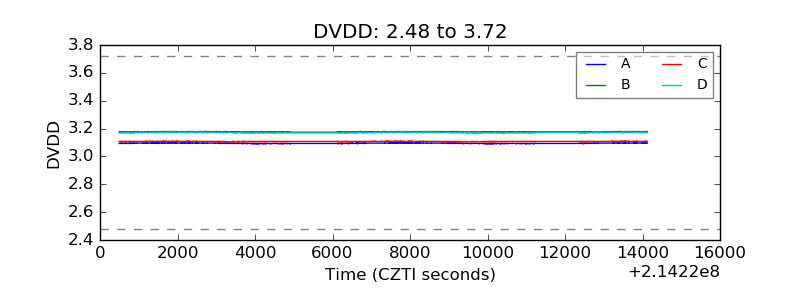 |
| Temperature 1 | 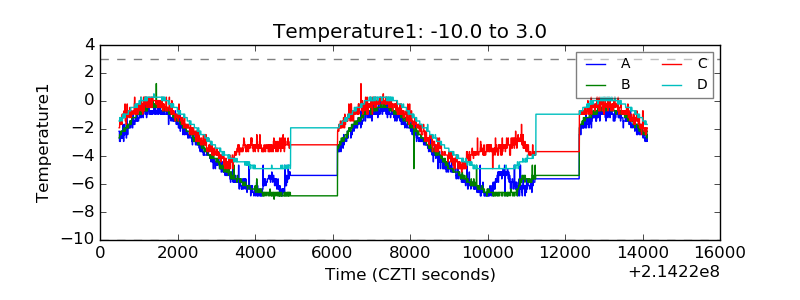 |
| Veto HV Monitor | 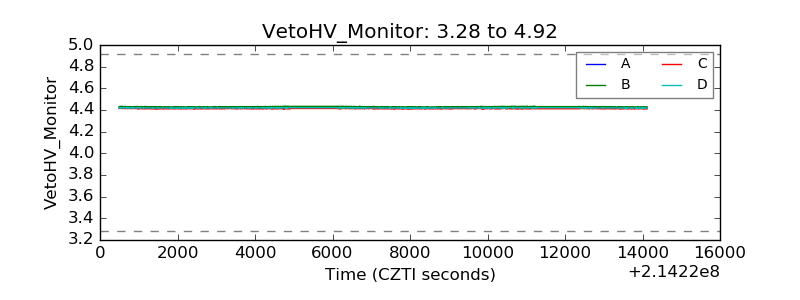 |
| Veto LLD | 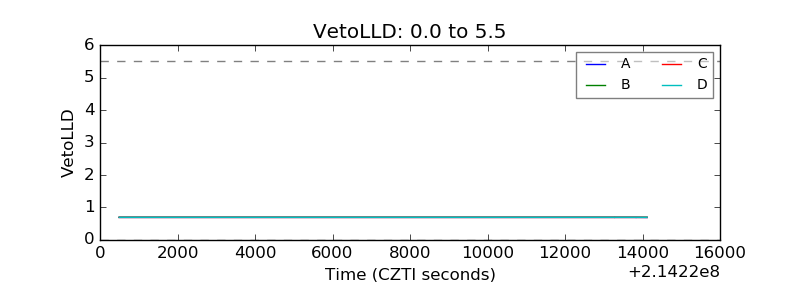 |
| Alpha Counter | 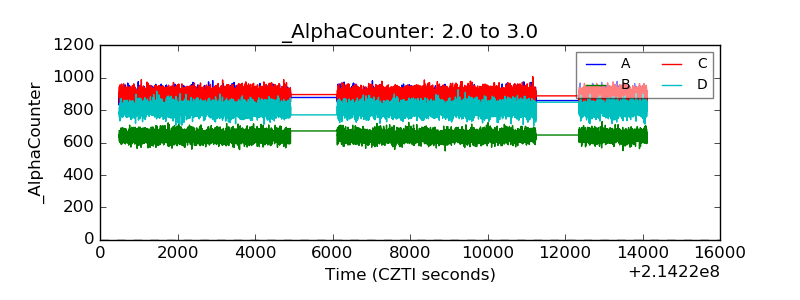 |
| _CPM_Rate | 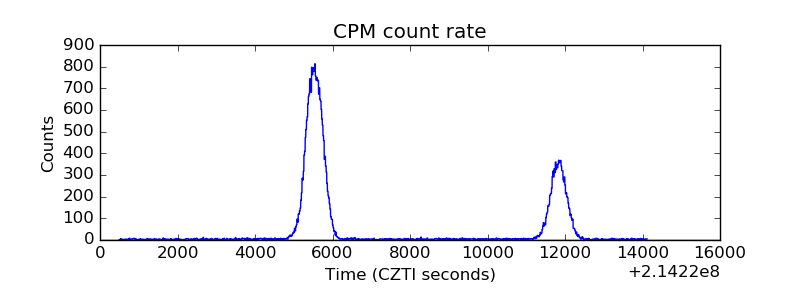 |
| CZT Counter | 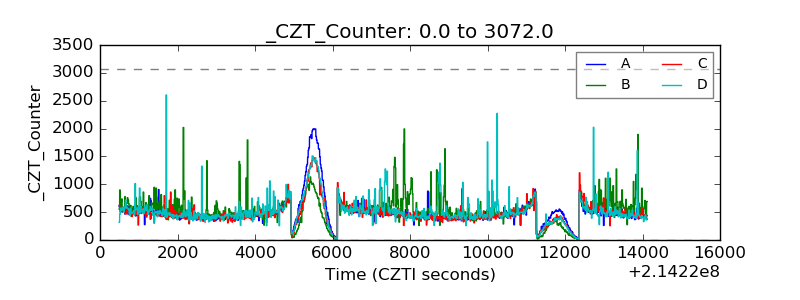 |
| +2.5 Volts monitor |  |
| +5 Volts monitor |  |
| _ROLL_ROT | 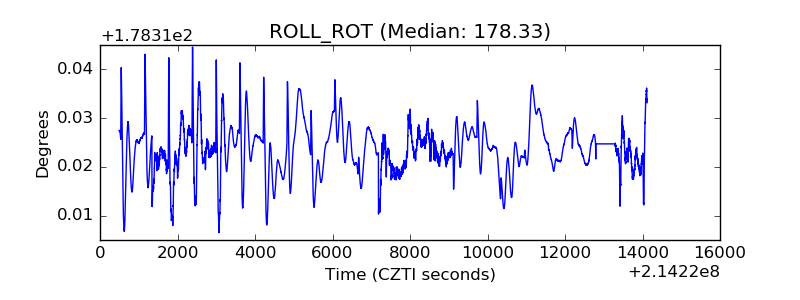 |
| _Roll_DEC | 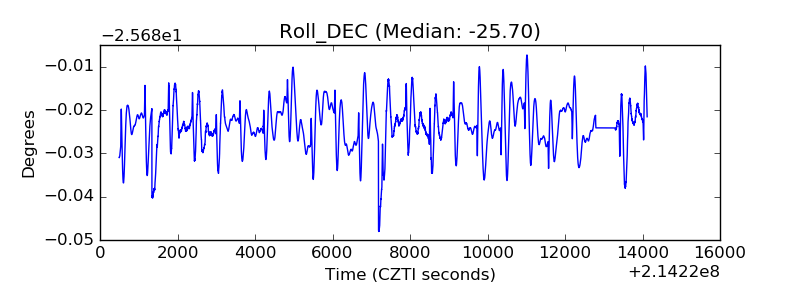 |
| _Roll_RA | 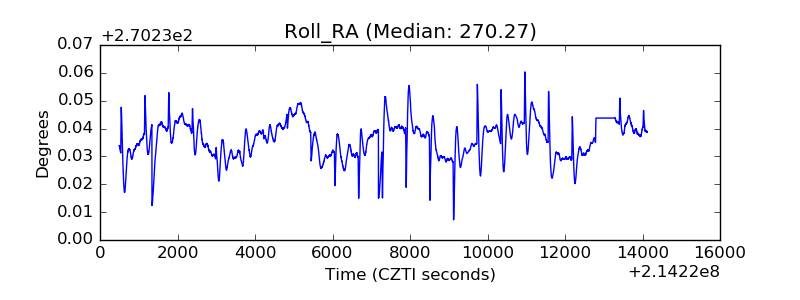 |
| Veto Counter | 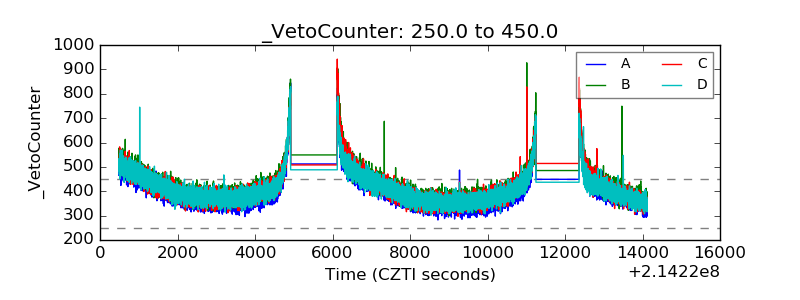 |