| Param | Original file | Final file |
|---|---|---|
| Filename | modeM0/AS1A02_077T01_9000000732_05676cztM0_level2.evt | modeM0/AS1A02_077T01_9000000732_05676cztM0_level2_quad_clean.evt |
| Size (bytes) | 144,547,200 | 31,152,960 |
| Size | 137.9 MB | 29.7 MB |
| Events in quadrant A | 956,757 | 197,101 |
| Events in quadrant B | 1,213,783 | 194,673 |
| Events in quadrant C | 956,332 | 196,740 |
| Events in quadrant D | 1,093,342 | 189,987 |
| Mode M0 | |||
|---|---|---|---|
| Quadrant | BADHDUFLAG | Total packets | Discarded packets |
| A | 0 | 4611 | 1 |
| B | 0 | 5191 | 0 |
| C | 0 | 4558 | 0 |
| D | 0 | 5026 | 0 |
| Mode SS | |||
|---|---|---|---|
| Quadrant | BADHDUFLAG | Total packets | Discarded packets |
| A | 0 | 46 | 0 |
| B | 0 | 46 | 0 |
| C | 0 | 46 | 0 |
| D | 0 | 46 | 0 |
| Quadrant | Total seconds | Saturated seconds | Saturation percentage |
|---|---|---|---|
| A | 2276 | 0 | 0.000000% |
| B | 2276 | 3 | 0.131810% |
| C | 2276 | 0 | 0.000000% |
| D | 2276 | 27 | 1.186292% |
Noise dominated data is calculated using 1-second bins in cleaned event files. If a bin has >2000 counts, and if more than 50% of those come from <1% of pixels, then it is considered to be noise-dominated and hence unusable.
| Quadrant | # 1 sec bins | Bins with >0 counts | Bins with >2000 counts | High rate bins dominated by noise | Noise dominated (total time) | Noise dominated (detector-on time) | Marked lightcurve |
|---|---|---|---|---|---|---|---|
| A | 2276 | 2276 | 1 | 1 | 0.04% | 0.04% | 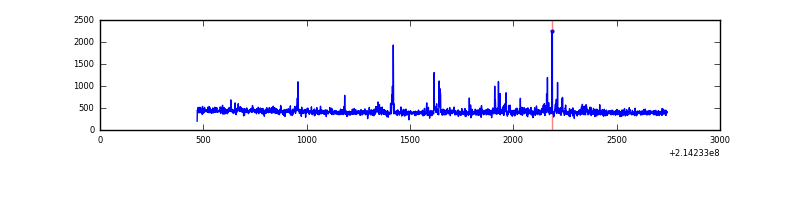 |
| B | 2276 | 2276 | 3 | 3 | 0.13% | 0.13% | 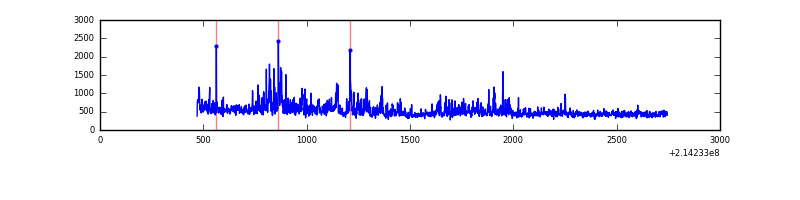 |
| C | 2276 | 2276 | 0 | 0 | 0.00% | 0.00% | 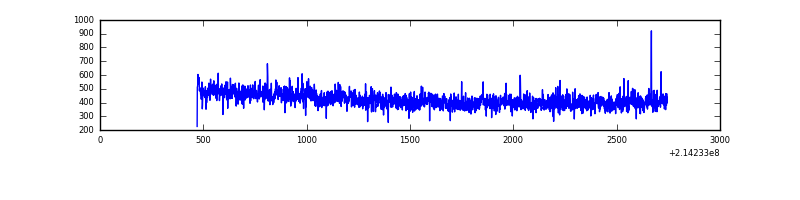 |
| D | 2276 | 2276 | 27 | 27 | 1.19% | 1.19% |  |
Top three noisy pixels from each quadrant. If the there are fewer than three noisy pixels in the level2.evt file, extra rows are filled as -1
| Pixel properties | Quadrant properties | ||||||
|---|---|---|---|---|---|---|---|
| Quadrant | DetID | PixID | Counts | Sigma | Mean | Median | Sigma |
| A | 4 | 2 | 31292 | 625.8 | 235 | 230 | 49.6 |
| A | 0 | 31 | 6524 | 126.8 | 235 | 230 | 49.6 |
| A | 13 | 6 | 5959 | 115.42 | 235 | 230 | 49.6 |
| B | 15 | 204 | 190395 | 4024.75 | 237 | 232 | 47.2 |
| B | 5 | 172 | 42094 | 886.0 | 237 | 232 | 47.2 |
| B | 0 | 214 | 22259 | 466.2 | 237 | 232 | 47.2 |
| C | 1 | 16 | 75208 | 1389.1 | 225 | 226 | 54.0 |
| C | 13 | 61 | 1947 | 31.88 | 225 | 226 | 54.0 |
| C | 8 | 79 | 1474 | 23.12 | 225 | 226 | 54.0 |
| D | 2 | 152 | 142010 | 2440.29 | 225 | 217 | 58.1 |
| D | 10 | 15 | 60281 | 1033.72 | 225 | 217 | 58.1 |
| D | 8 | 195 | 21526 | 366.73 | 225 | 217 | 58.1 |
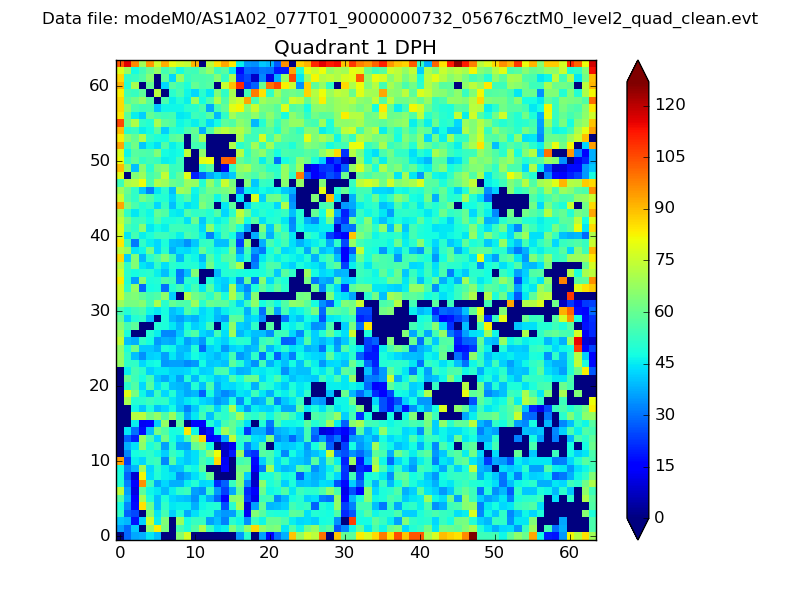
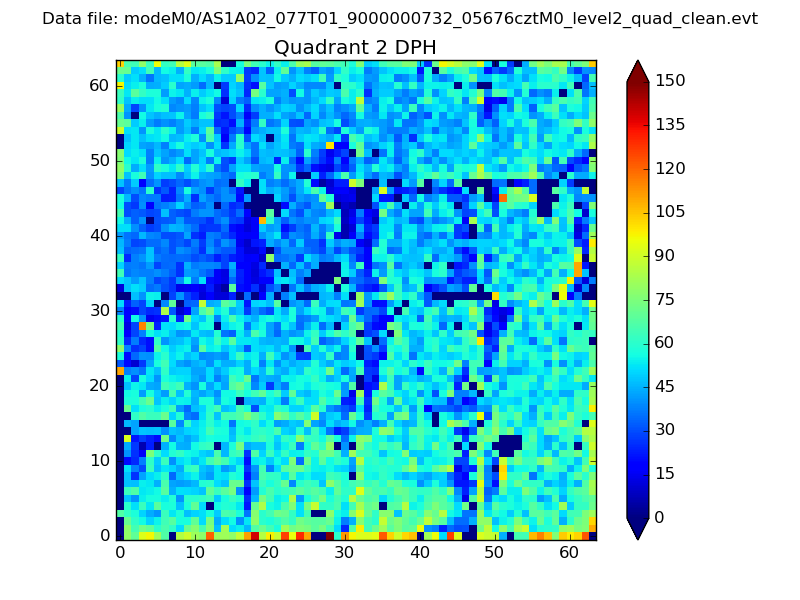
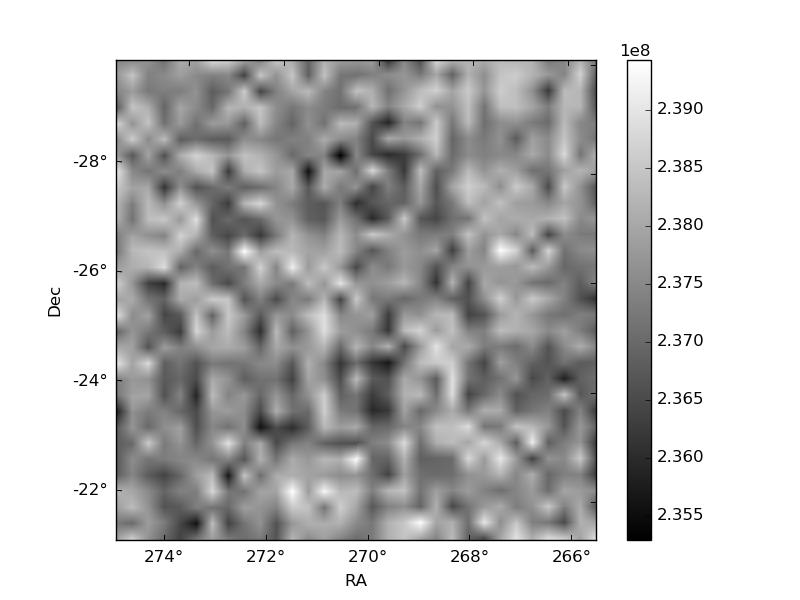
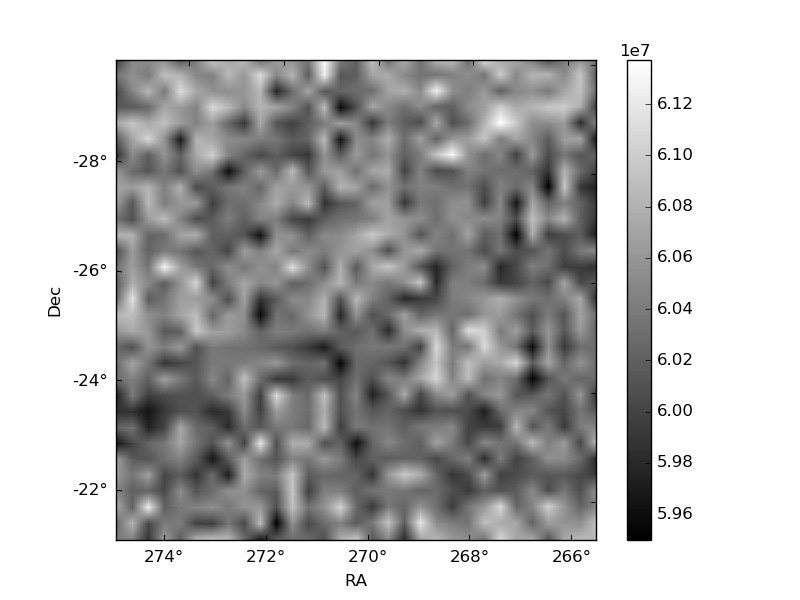
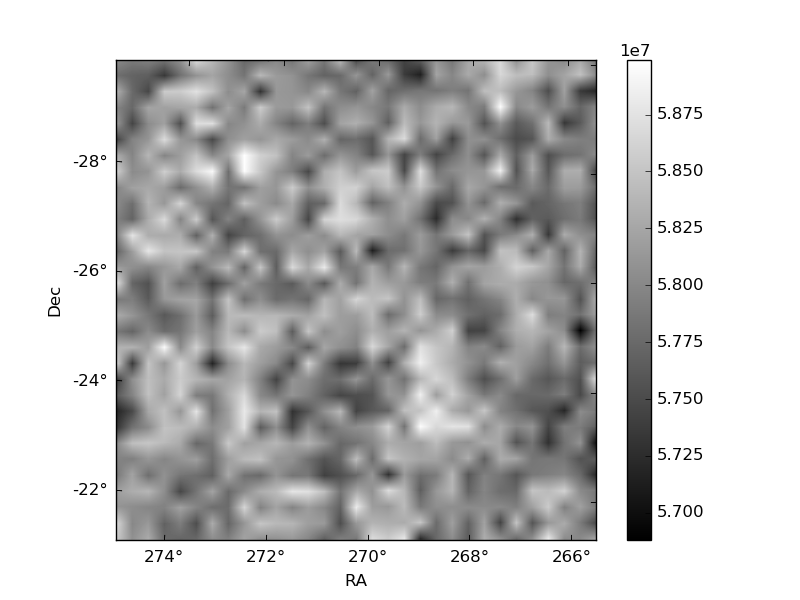
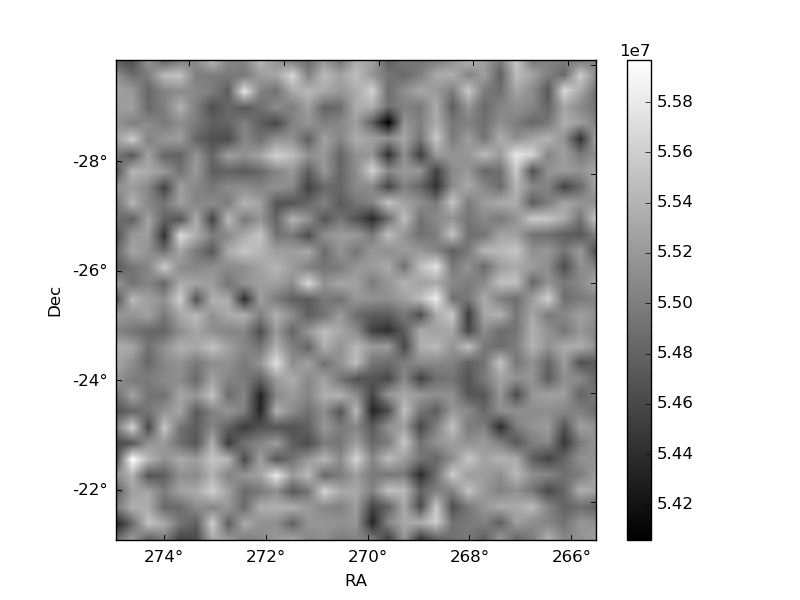
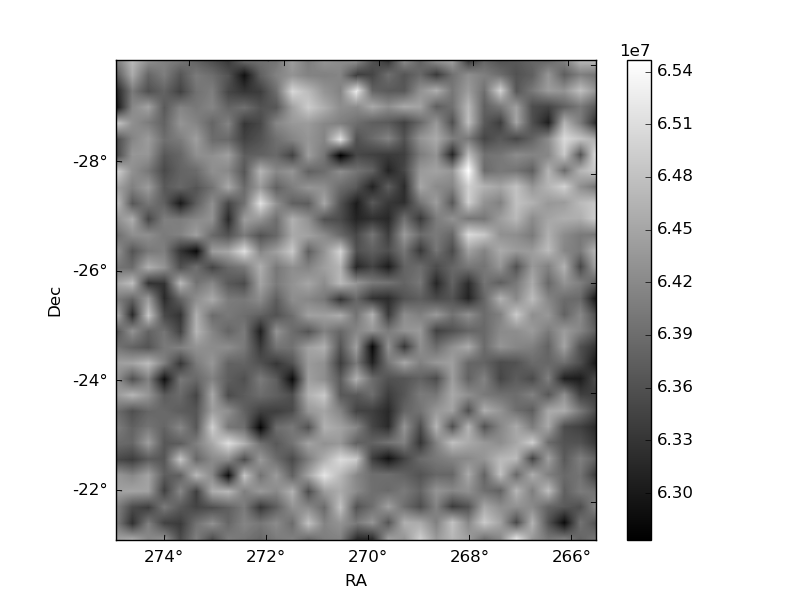
Histogram calculated using DETX and DETY for each event in the final _common_clean file
| Quadrant A | 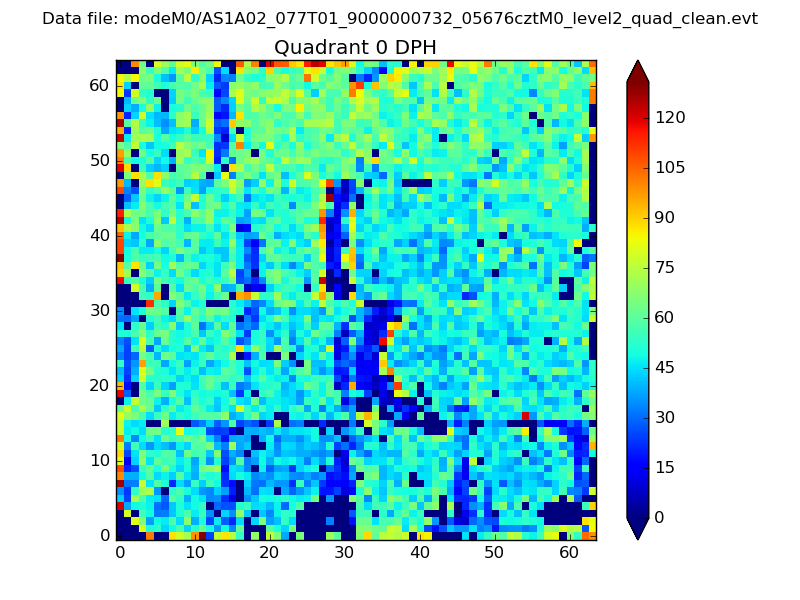 |
 |
Quadrant B |
|---|---|---|---|
| Quadrant D | 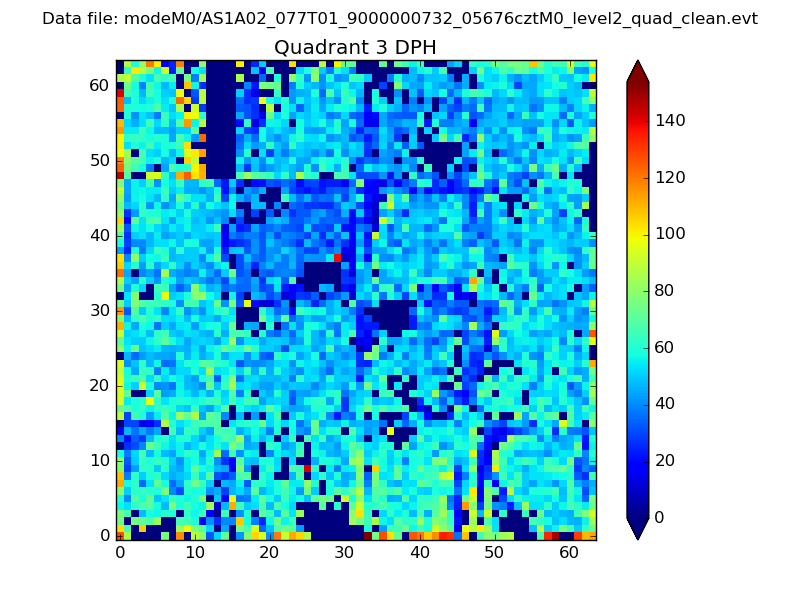 |
 |
Quadrant C |
| Plot type | Count rate plots | Images |
|---|---|---|
| Comparison with Poisson distribution Blue bars denote a histogram of data divided into 1 sec bins. Red curve is a Poisson curve with rate = median count rate of data. |
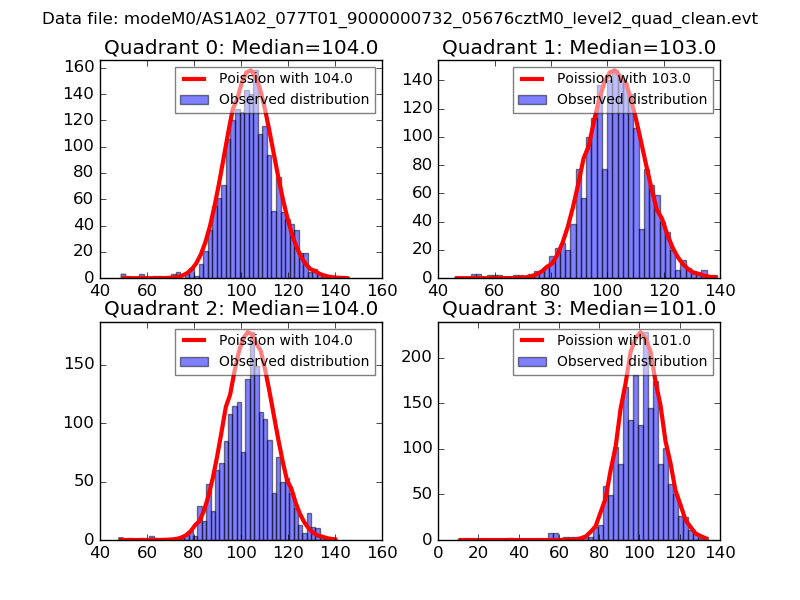 |
 |
| Quadrant-wise count rates Data is divided into 100 sec bins |
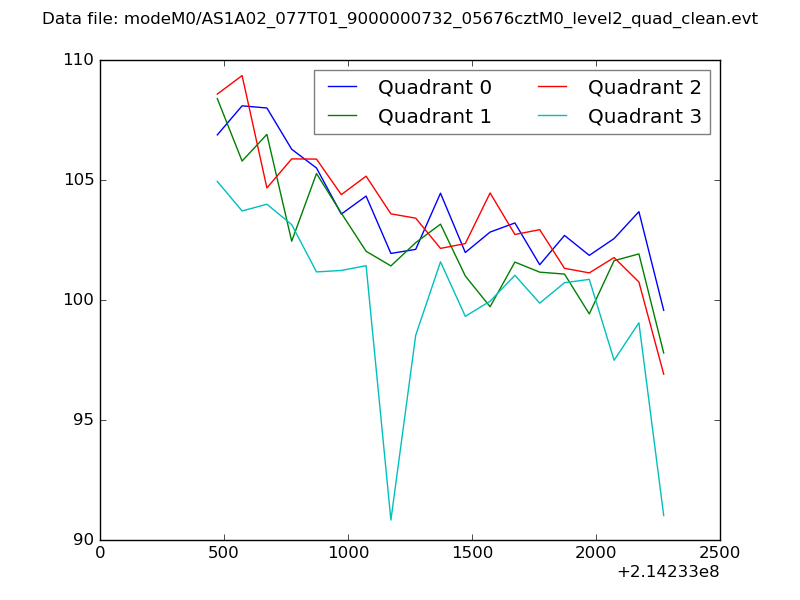 |
|
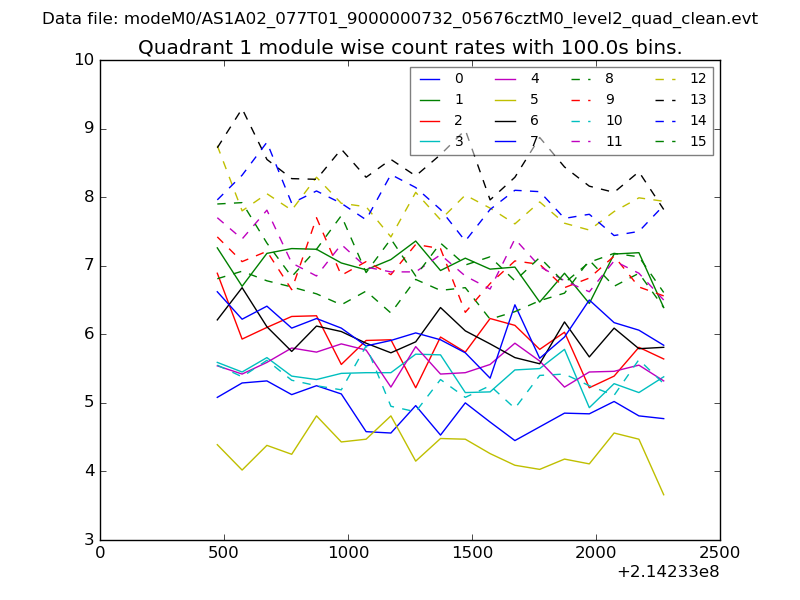
| Module-wise count rates for Quadrant A Data is divided into 100 sec bins |
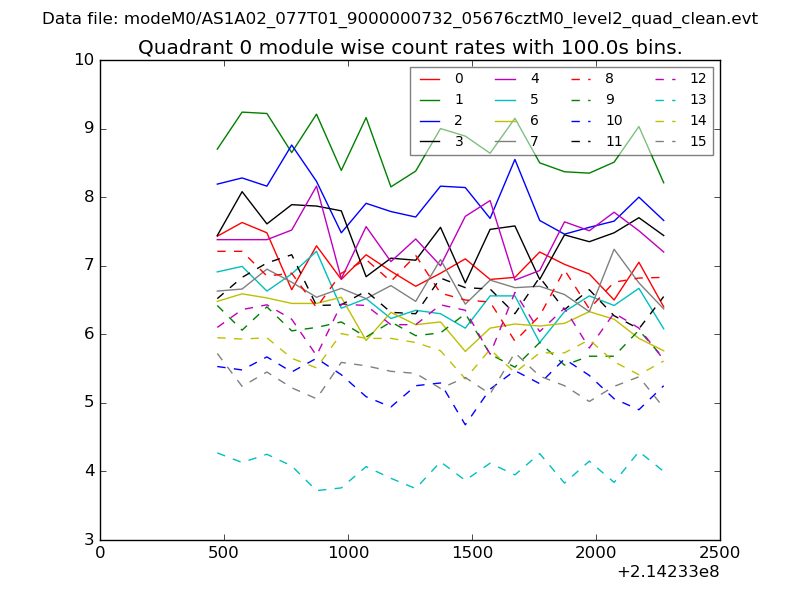 |
 |
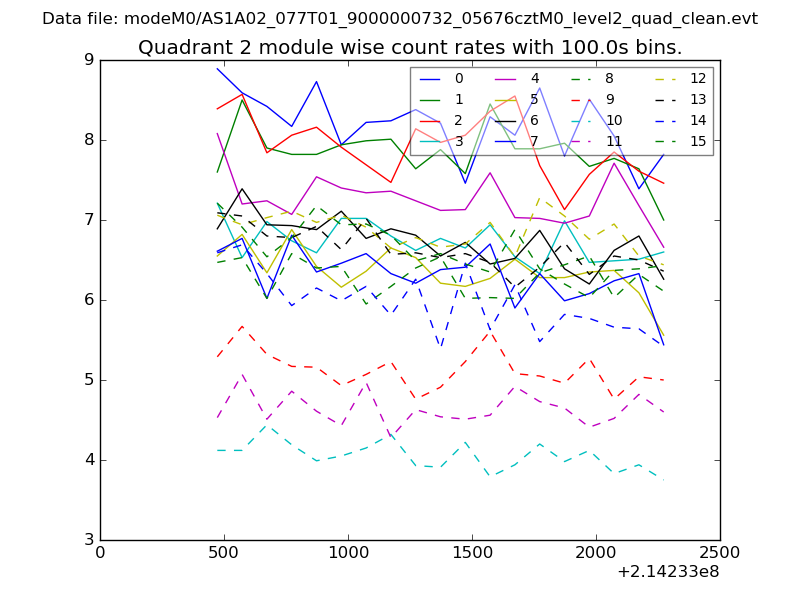
| Module-wise count rates for Quadrant B Data is divided into 100 sec bins |
 |
 |
| Module-wise count rates for Quadrant C Data is divided into 100 sec bins |
 |
 |
| Module-wise count rates for Quadrant D Data is divided into 100 sec bins |
 |
 |
| Parameter | Plot |
|---|---|
| CZT HV Monitor | 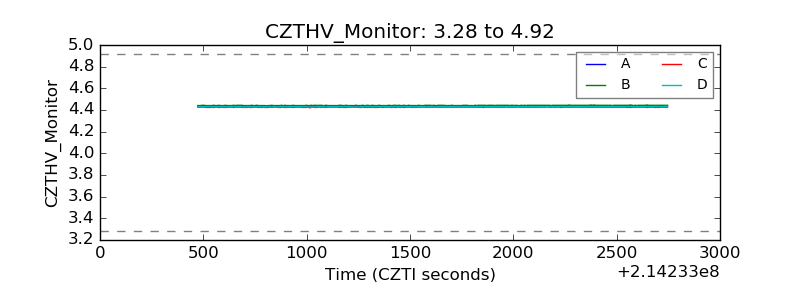 |
| D_VDD | 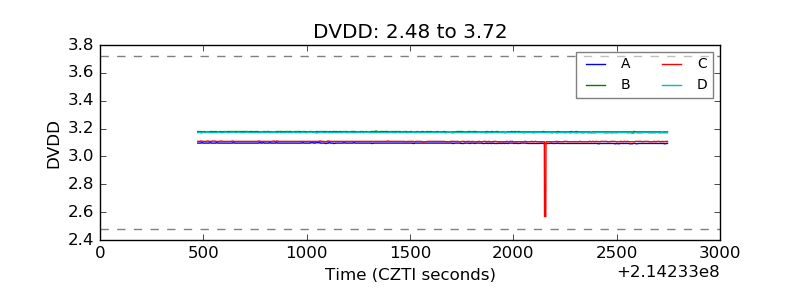 |
| Temperature 1 | 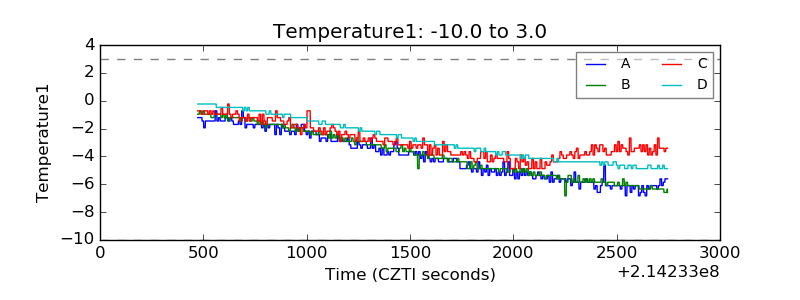 |
| Veto HV Monitor | 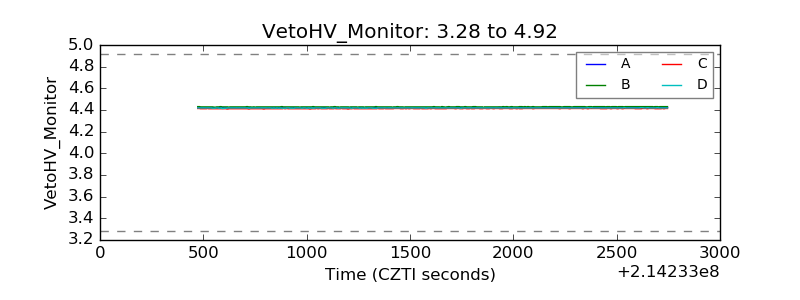 |
| Veto LLD | 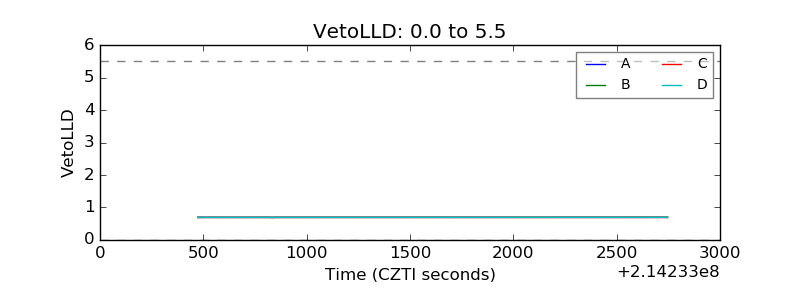 |
| Alpha Counter | 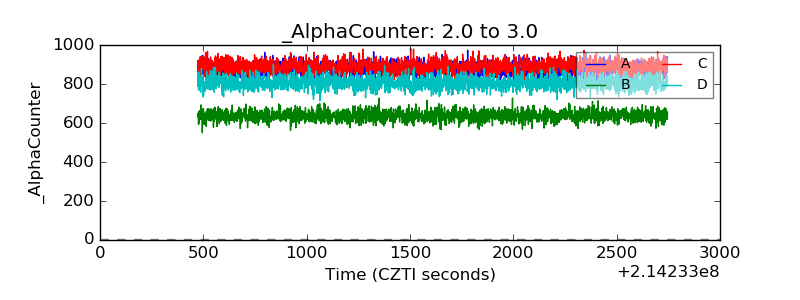 |
| _CPM_Rate | 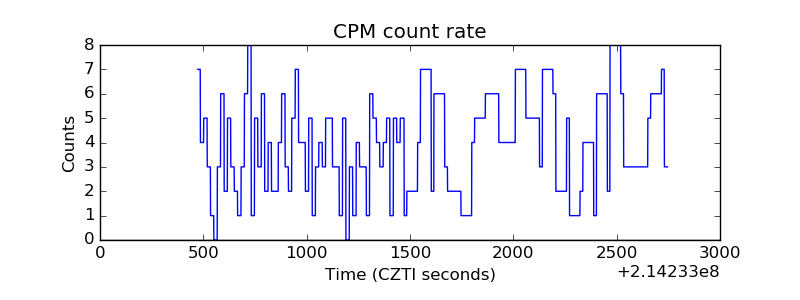 |
| CZT Counter | 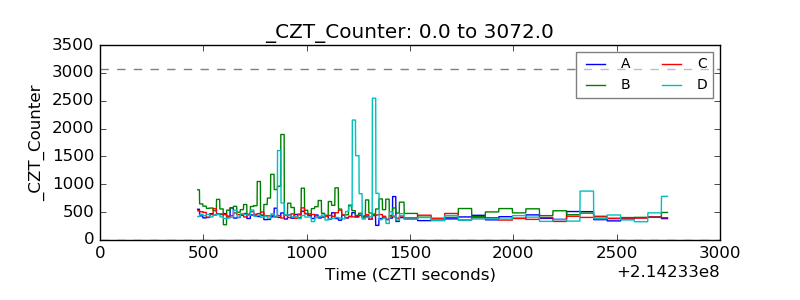 |
| +2.5 Volts monitor |  |
| +5 Volts monitor |  |
| _ROLL_ROT |  |
| _Roll_DEC |  |
| _Roll_RA | 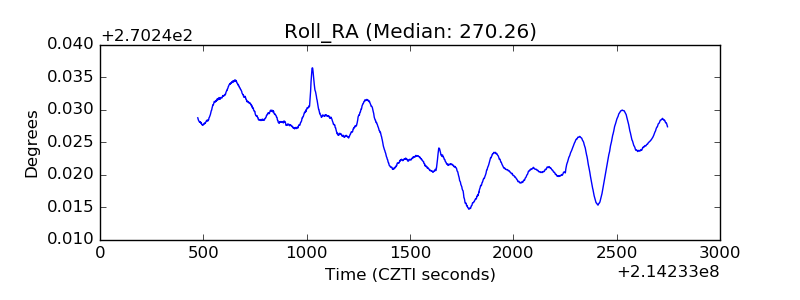 |
| Veto Counter | 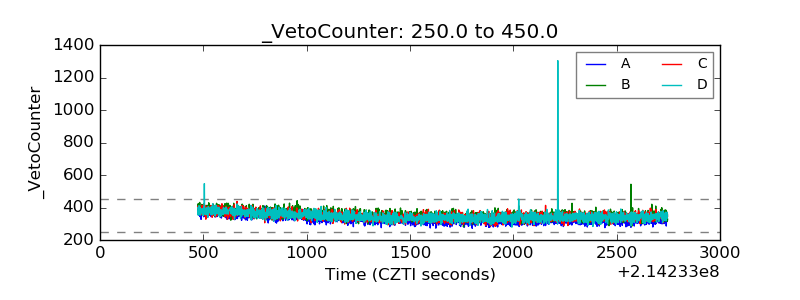 |