| Param | Original file | Final file |
|---|---|---|
| Filename | modeM0/AS1A02_077T01_9000000732_05677cztM0_level2.evt | modeM0/AS1A02_077T01_9000000732_05677cztM0_level2_quad_clean.evt |
| Size (bytes) | 706,596,480 | 101,502,720 |
| Size | 673.9 MB | 96.8 MB |
| Events in quadrant A | 4,649,311 | 606,934 |
| Events in quadrant B | 6,425,039 | 589,422 |
| Events in quadrant C | 4,610,521 | 605,845 |
| Events in quadrant D | 5,039,668 | 581,505 |
| Mode M0 | |||
|---|---|---|---|
| Quadrant | BADHDUFLAG | Total packets | Discarded packets |
| A | 0 | 20919 | 114 |
| B | 0 | 25897 | 150 |
| C | 0 | 20885 | 136 |
| D | 0 | 22125 | 122 |
| Mode SS | |||
|---|---|---|---|
| Quadrant | BADHDUFLAG | Total packets | Discarded packets |
| A | 0 | 204 | 6 |
| B | 0 | 204 | 0 |
| C | 0 | 204 | 0 |
| D | 0 | 204 | 0 |
| Mode M9 | |||
|---|---|---|---|
| Quadrant | BADHDUFLAG | Total packets | Discarded packets |
| A | 0 | 11 | 0 |
| B | 0 | 11 | 0 |
| C | 0 | 11 | 0 |
| D | 0 | 11 | 0 |
| Quadrant | Total seconds | Saturated seconds | Saturation percentage |
|---|---|---|---|
| A | 9958 | 105 | 1.054429% |
| B | 9947 | 385 | 3.870514% |
| C | 9948 | 69 | 0.693607% |
| D | 9965 | 99 | 0.993477% |
Noise dominated data is calculated using 1-second bins in cleaned event files. If a bin has >2000 counts, and if more than 50% of those come from <1% of pixels, then it is considered to be noise-dominated and hence unusable.
| Quadrant | # 1 sec bins | Bins with >0 counts | Bins with >2000 counts | High rate bins dominated by noise | Noise dominated (total time) | Noise dominated (detector-on time) | Marked lightcurve |
|---|---|---|---|---|---|---|---|
| A | 11144 | 10010 | 0 | 0 | 0.00% | 0.00% | 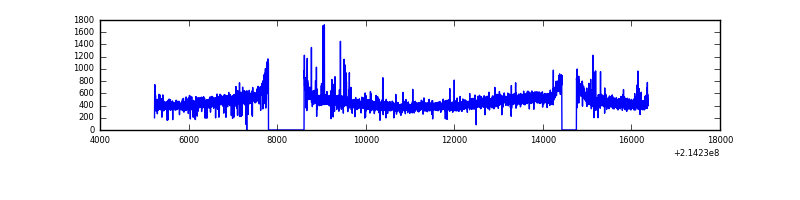 |
| B | 11144 | 10011 | 181 | 181 | 1.62% | 1.81% | 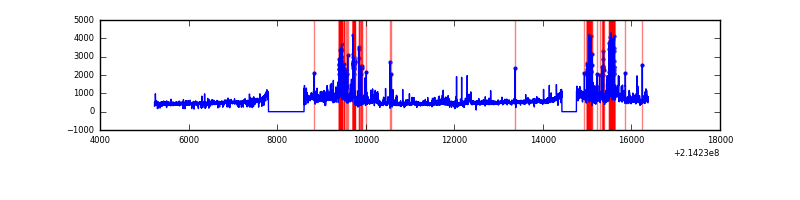 |
| C | 11144 | 10011 | 3 | 3 | 0.03% | 0.03% | 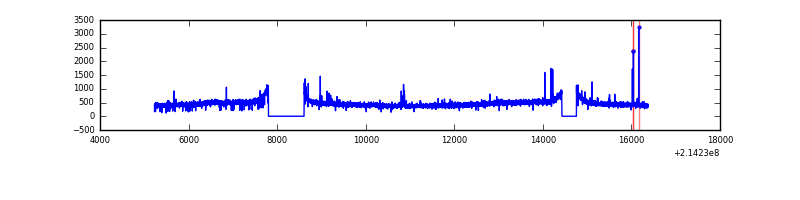 |
| D | 11144 | 10009 | 35 | 35 | 0.31% | 0.35% | 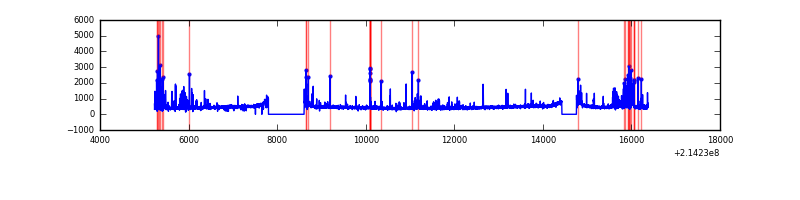 |
Top three noisy pixels from each quadrant. If the there are fewer than three noisy pixels in the level2.evt file, extra rows are filled as -1
| Pixel properties | Quadrant properties | ||||||
|---|---|---|---|---|---|---|---|
| Quadrant | DetID | PixID | Counts | Sigma | Mean | Median | Sigma |
| A | 4 | 2 | 38353 | 151.75 | 1187 | 1162 | 245.1 |
| A | 0 | 50 | 29252 | 114.61 | 1187 | 1162 | 245.1 |
| A | 0 | 226 | 11772 | 43.29 | 1187 | 1162 | 245.1 |
| B | 5 | 172 | 705625 | 3079.19 | 1184 | 1156 | 228.8 |
| B | 15 | 204 | 499188 | 2176.87 | 1184 | 1156 | 228.8 |
| B | 0 | 219 | 200682 | 872.12 | 1184 | 1156 | 228.8 |
| C | 1 | 16 | 115147 | 424.21 | 1147 | 1152 | 268.7 |
| C | 13 | 61 | 9300 | 30.32 | 1147 | 1152 | 268.7 |
| C | 8 | 222 | 7471 | 23.52 | 1147 | 1152 | 268.7 |
| D | 2 | 152 | 249495 | 878.87 | 1145 | 1110 | 282.6 |
| D | 2 | 136 | 168237 | 591.35 | 1145 | 1110 | 282.6 |
| D | 10 | 15 | 137128 | 481.28 | 1145 | 1110 | 282.6 |
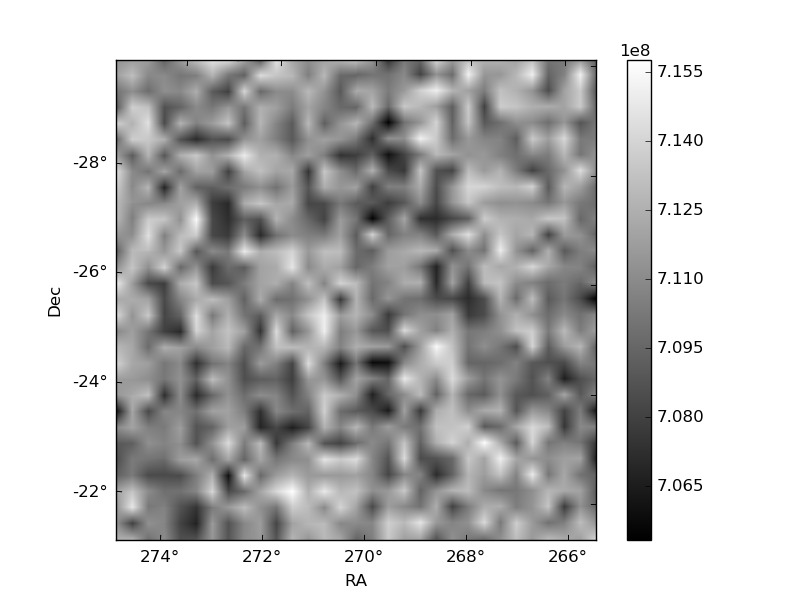
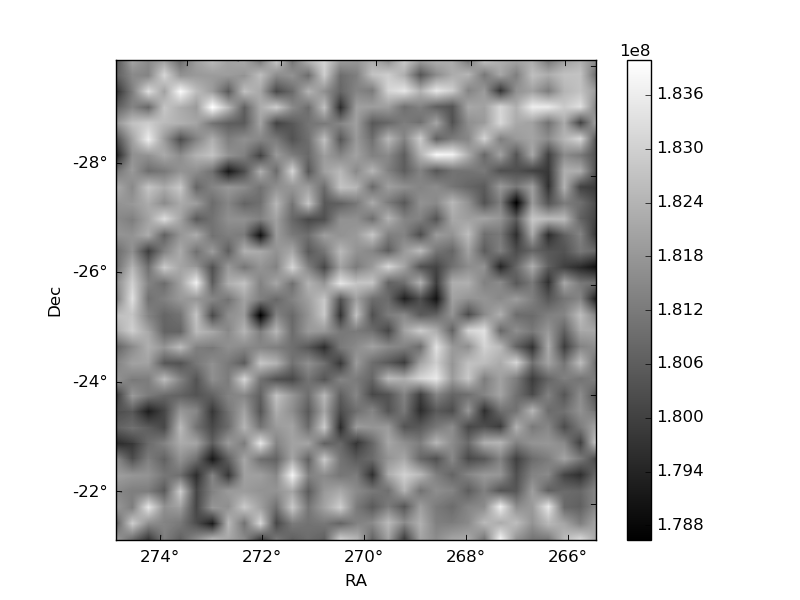
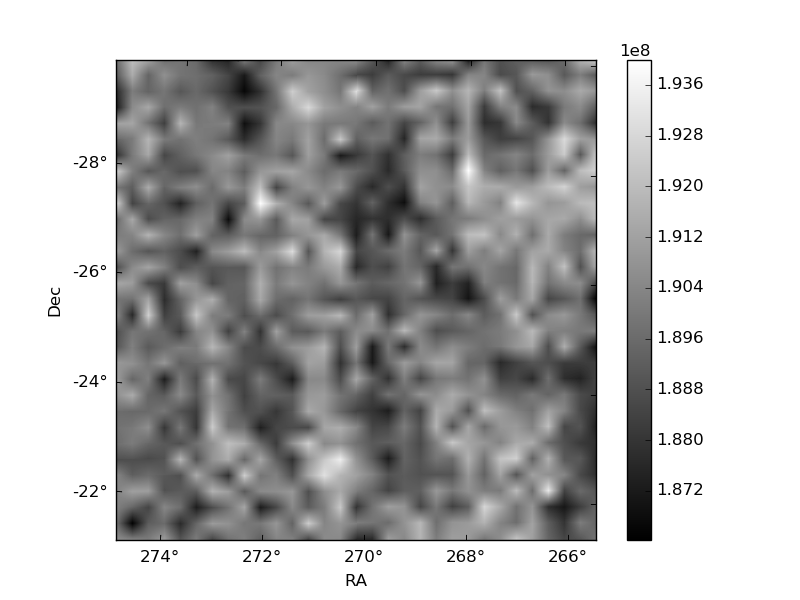
Histogram calculated using DETX and DETY for each event in the final _common_clean file
| Quadrant A | 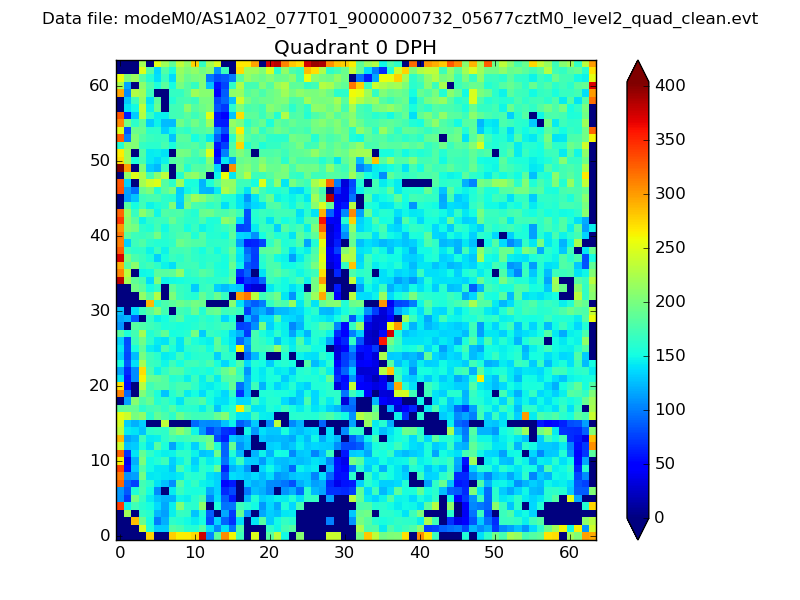 |
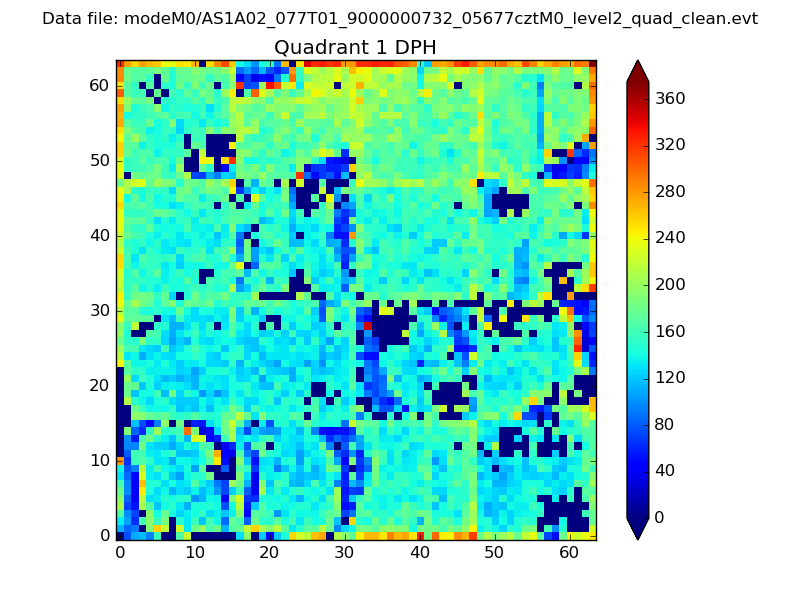 |
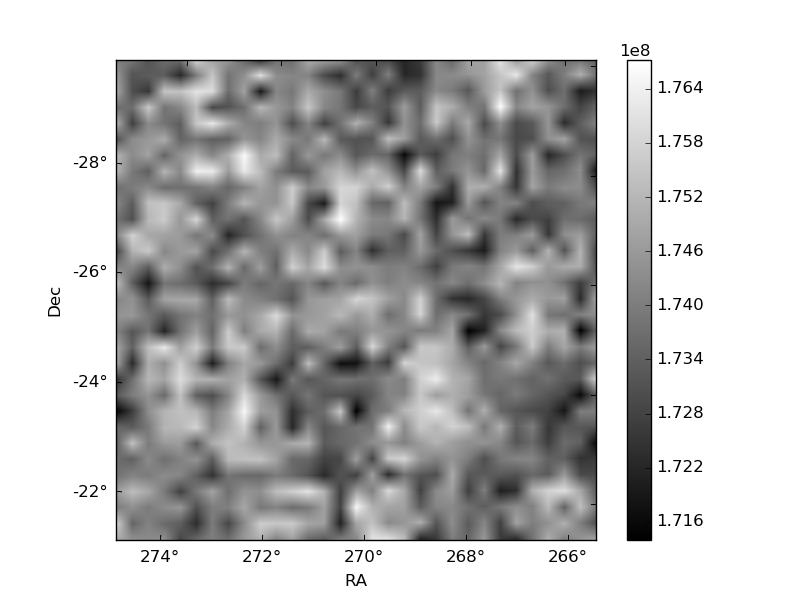
Quadrant B |
|---|---|---|---|
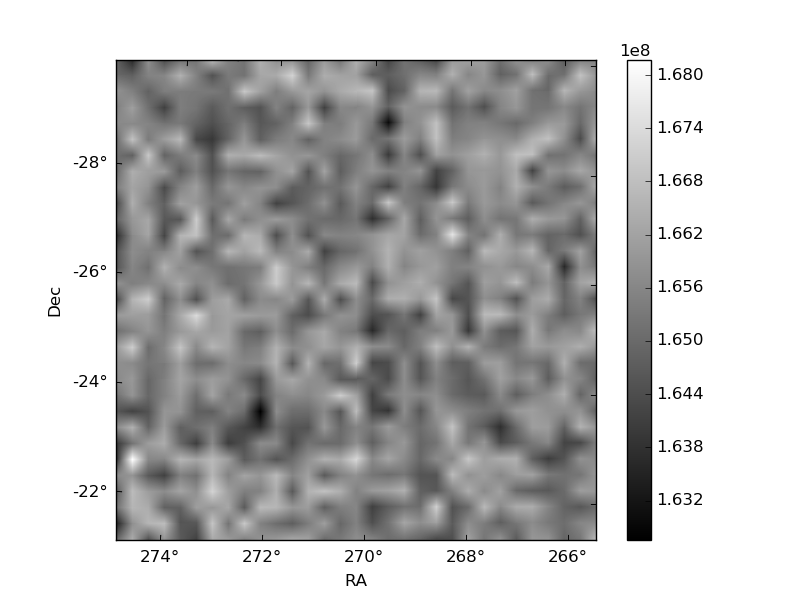
| Quadrant D | 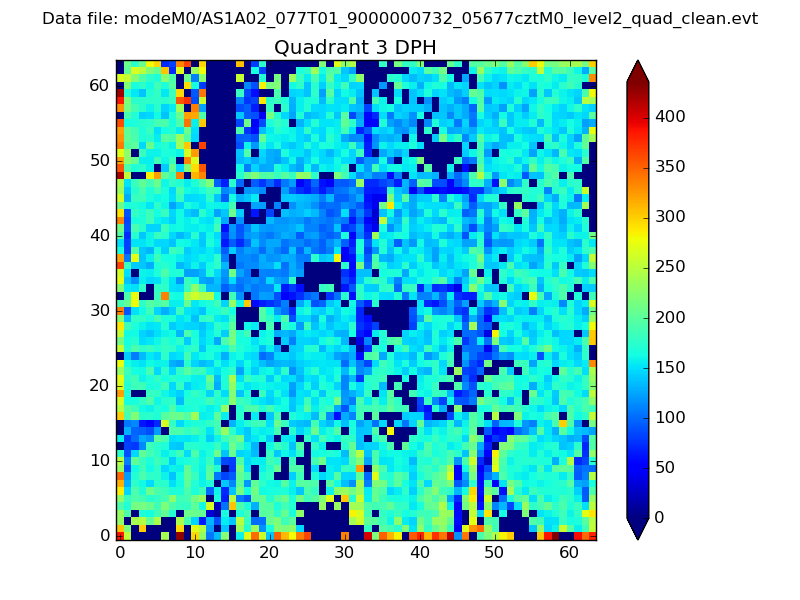 |
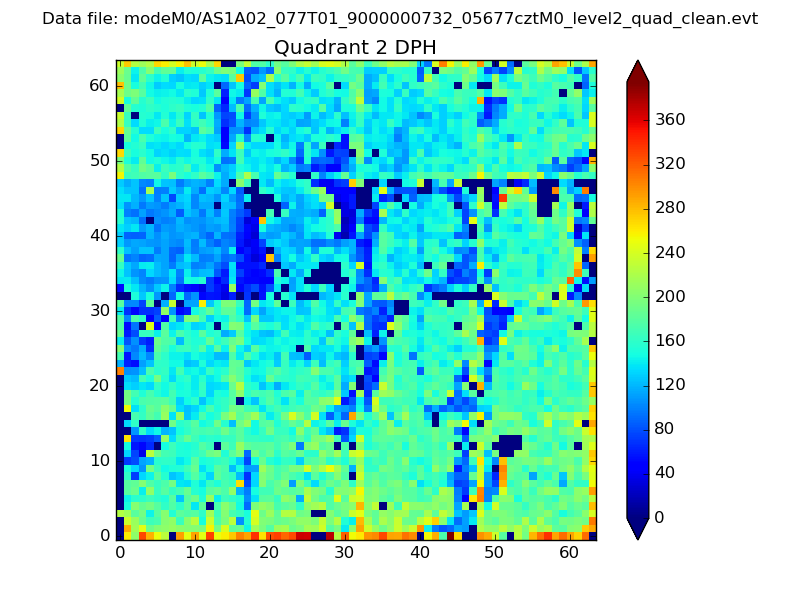 |
Quadrant C |
| Plot type | Count rate plots | Images |
|---|---|---|
| Comparison with Poisson distribution Blue bars denote a histogram of data divided into 1 sec bins. Red curve is a Poisson curve with rate = median count rate of data. |
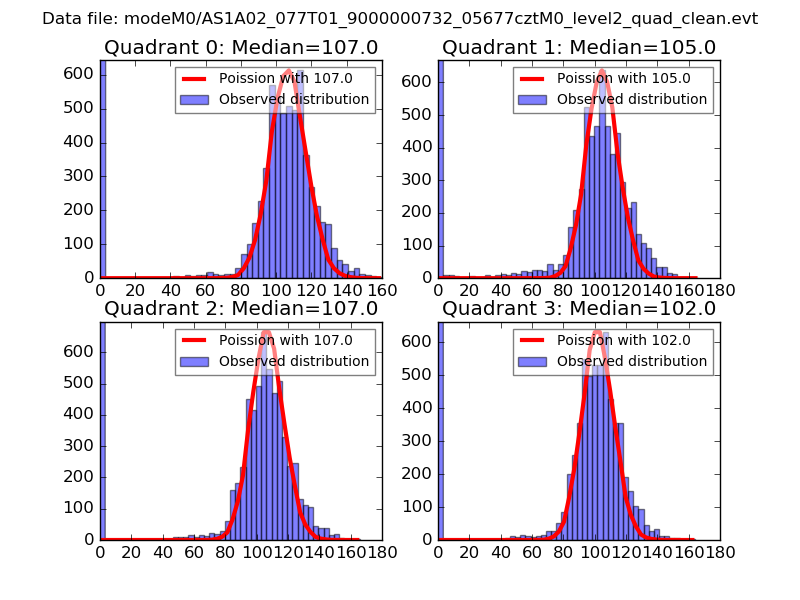 |
 |
| Quadrant-wise count rates Data is divided into 100 sec bins |
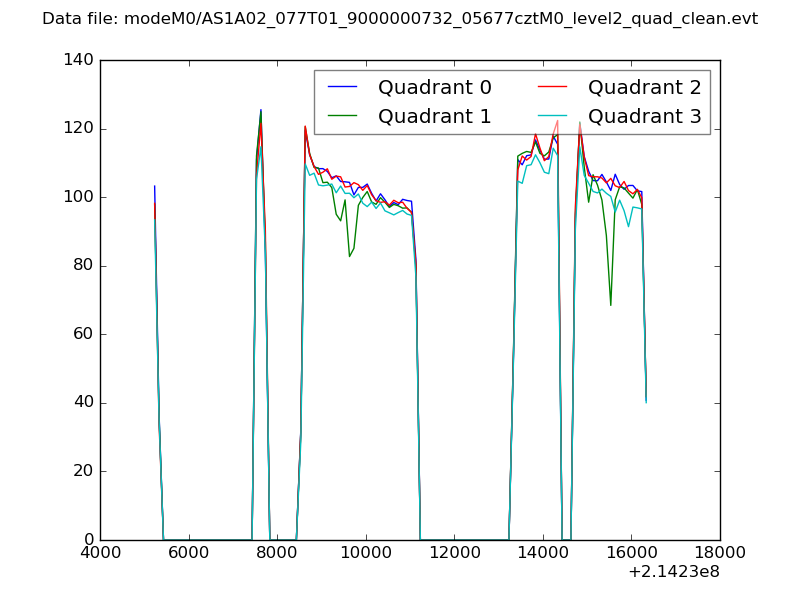 |
|
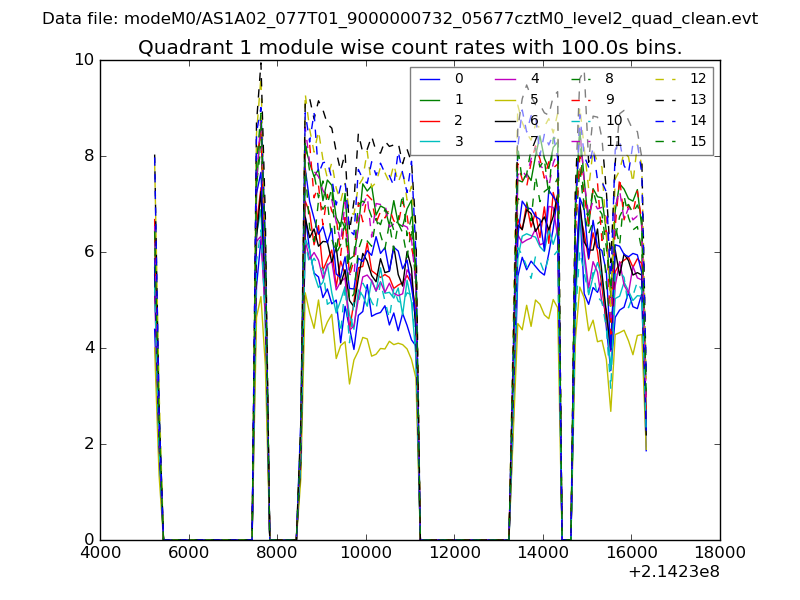
| Module-wise count rates for Quadrant A Data is divided into 100 sec bins |
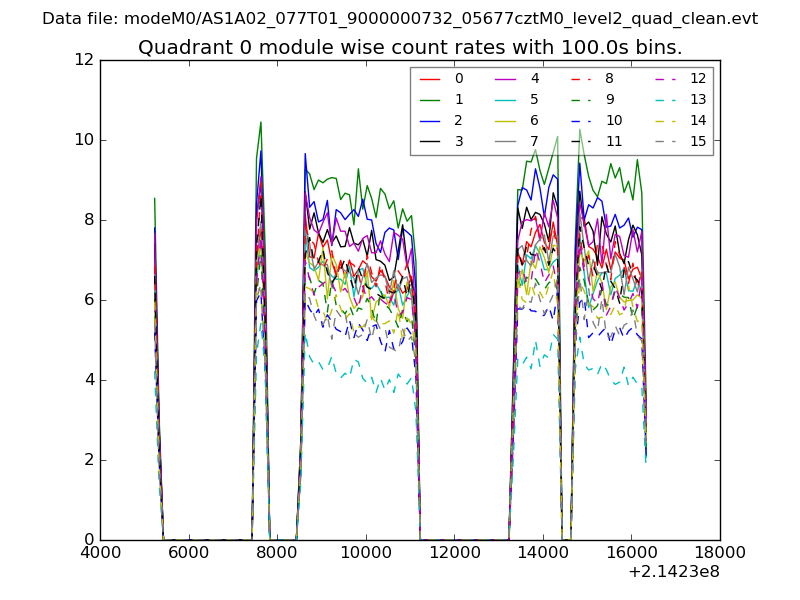 |
 |
| Module-wise count rates for Quadrant B Data is divided into 100 sec bins |
 |
 |
| Module-wise count rates for Quadrant C Data is divided into 100 sec bins |
 |
 |
| Module-wise count rates for Quadrant D Data is divided into 100 sec bins |
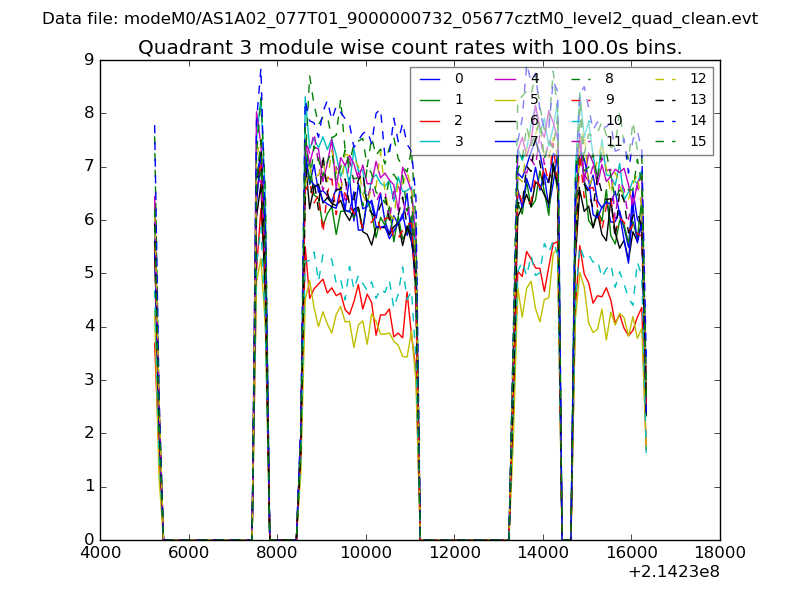 |
 |
| Parameter | Plot |
|---|---|
| CZT HV Monitor | 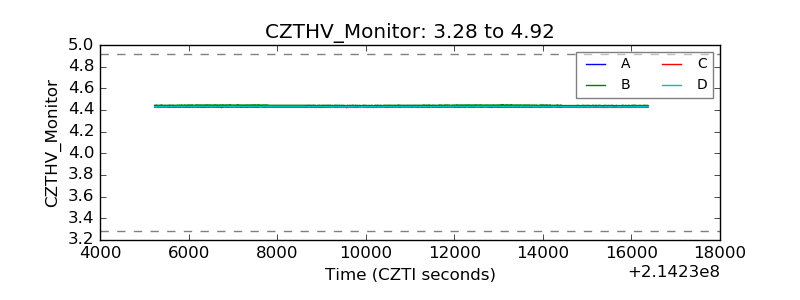 |
| D_VDD | 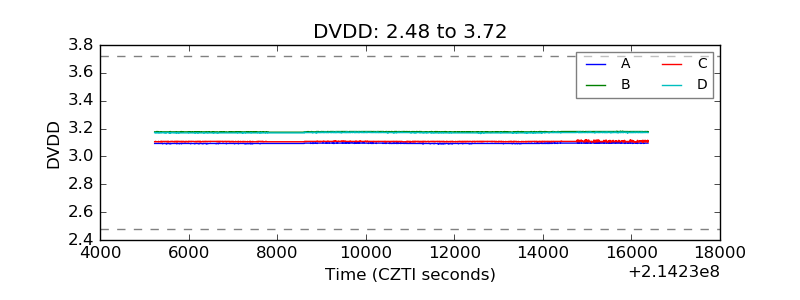 |
| Temperature 1 | 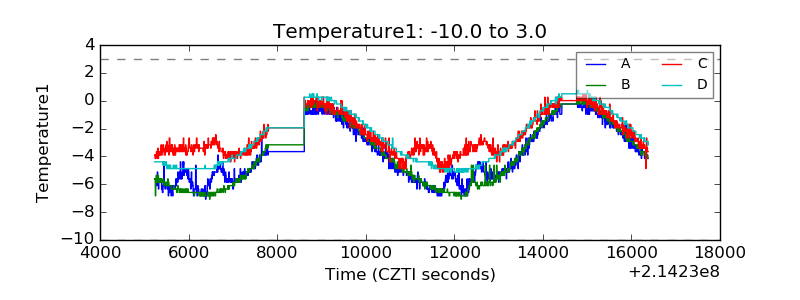 |
| Veto HV Monitor | 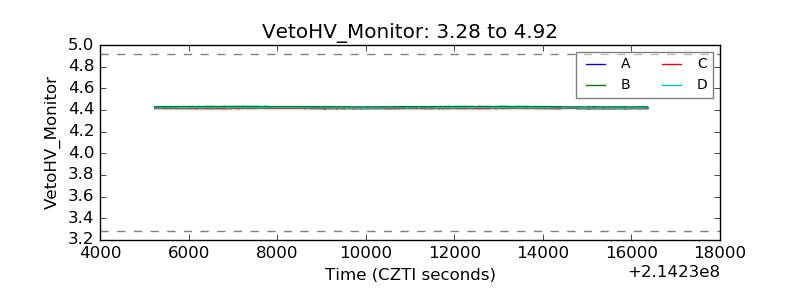 |
| Veto LLD | 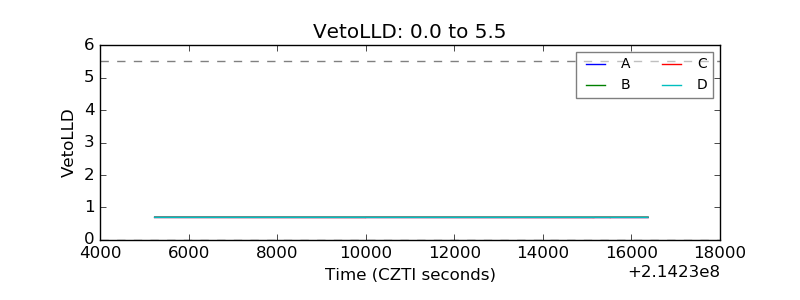 |
| Alpha Counter | 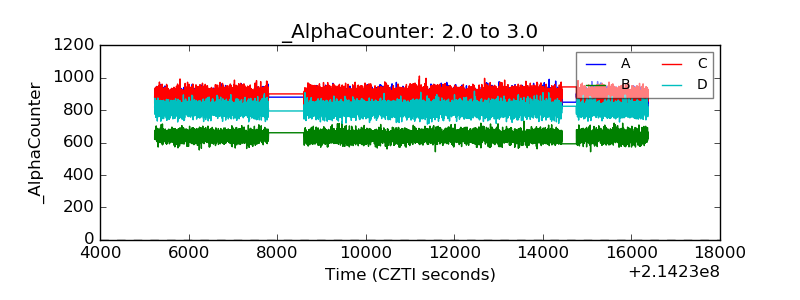 |
| _CPM_Rate | 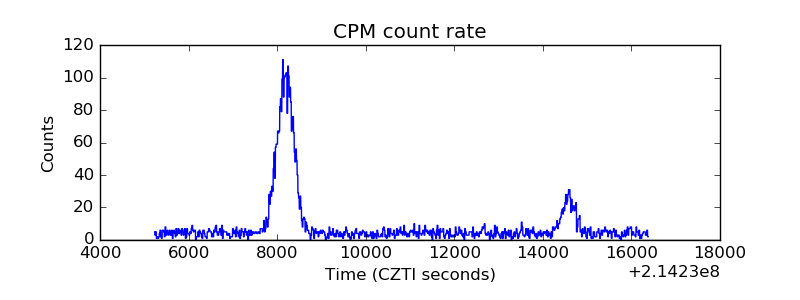 |
| CZT Counter | 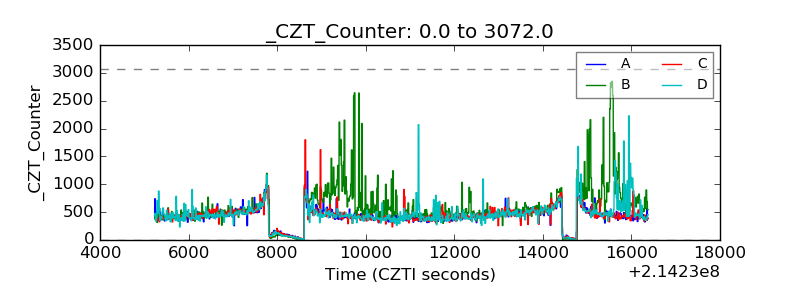 |
| +2.5 Volts monitor |  |
| +5 Volts monitor | 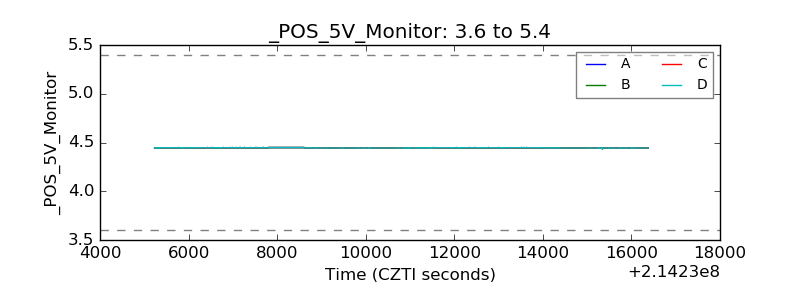 |
| _ROLL_ROT | 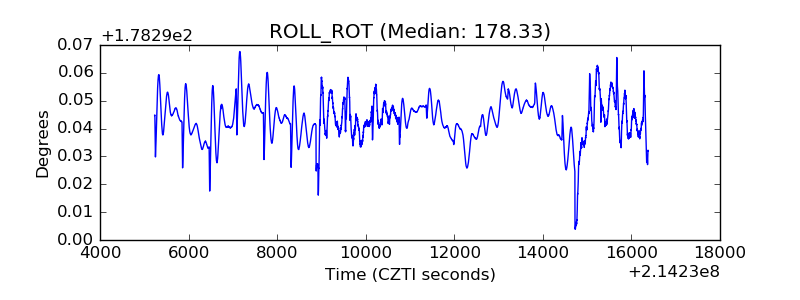 |
| _Roll_DEC | 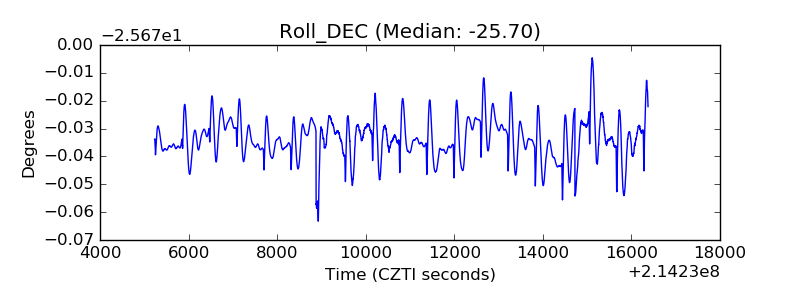 |
| _Roll_RA | 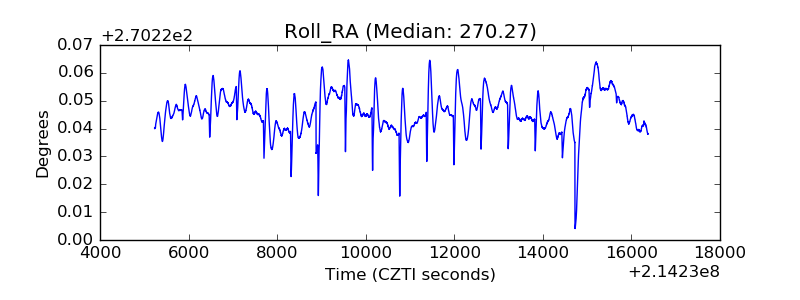 |
| Veto Counter | 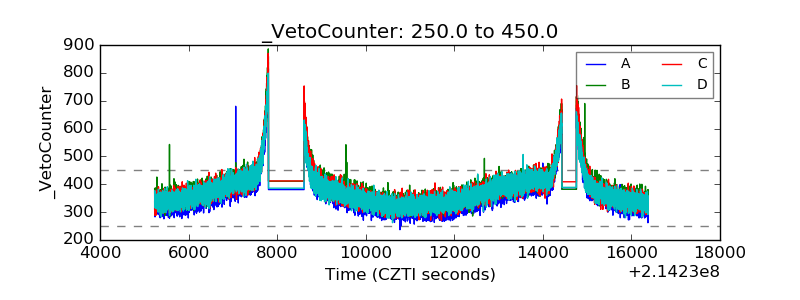 |