| Param | Original file | Final file |
|---|---|---|
| Filename | modeM0/AS1A02_077T01_9000000732_05678cztM0_level2.evt | modeM0/AS1A02_077T01_9000000732_05678cztM0_level2_quad_clean.evt |
| Size (bytes) | 515,580,480 | 86,034,240 |
| Size | 491.7 MB | 82.0 MB |
| Events in quadrant A | 3,326,185 | 534,152 |
| Events in quadrant B | 4,807,586 | 521,862 |
| Events in quadrant C | 3,253,635 | 535,062 |
| Events in quadrant D | 3,737,154 | 511,835 |
| Mode M0 | |||
|---|---|---|---|
| Quadrant | BADHDUFLAG | Total packets | Discarded packets |
| A | 0 | 15089 | 11 |
| B | 0 | 19303 | 37 |
| C | 0 | 14938 | 17 |
| D | 0 | 16392 | 7 |
| Mode SS | |||
|---|---|---|---|
| Quadrant | BADHDUFLAG | Total packets | Discarded packets |
| A | 0 | 144 | 0 |
| B | 0 | 144 | 0 |
| C | 0 | 144 | 0 |
| D | 0 | 144 | 0 |
| Quadrant | Total seconds | Saturated seconds | Saturation percentage |
|---|---|---|---|
| A | 7217 | 68 | 0.942220% |
| B | 7210 | 296 | 4.105409% |
| C | 7215 | 26 | 0.360360% |
| D | 7219 | 65 | 0.900402% |
Noise dominated data is calculated using 1-second bins in cleaned event files. If a bin has >2000 counts, and if more than 50% of those come from <1% of pixels, then it is considered to be noise-dominated and hence unusable.
| Quadrant | # 1 sec bins | Bins with >0 counts | Bins with >2000 counts | High rate bins dominated by noise | Noise dominated (total time) | Noise dominated (detector-on time) | Marked lightcurve |
|---|---|---|---|---|---|---|---|
| A | 7222 | 7222 | 7 | 7 | 0.10% | 0.10% | 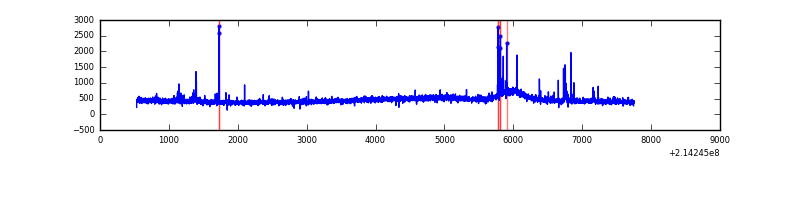 |
| B | 7222 | 7222 | 97 | 97 | 1.34% | 1.34% | 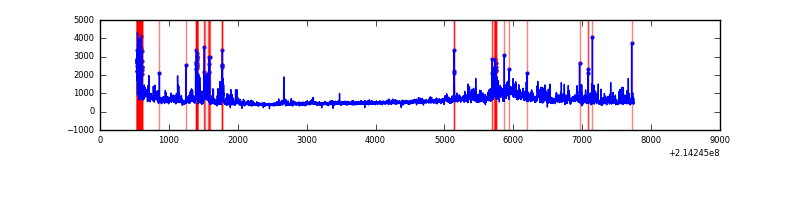 |
| C | 7222 | 7222 | 4 | 4 | 0.06% | 0.06% | 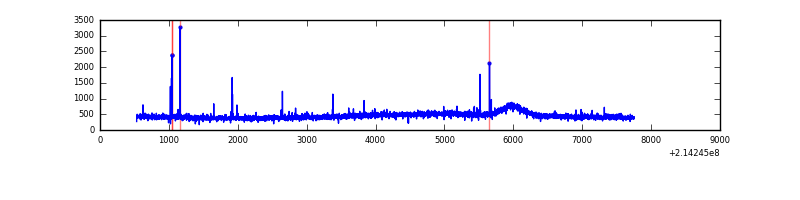 |
| D | 7222 | 7222 | 31 | 31 | 0.43% | 0.43% | 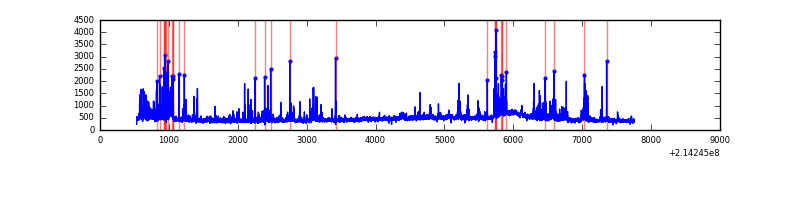 |
Top three noisy pixels from each quadrant. If the there are fewer than three noisy pixels in the level2.evt file, extra rows are filled as -1
| Pixel properties | Quadrant properties | ||||||
|---|---|---|---|---|---|---|---|
| Quadrant | DetID | PixID | Counts | Sigma | Mean | Median | Sigma |
| A | 0 | 50 | 61774 | 349.01 | 836 | 815 | 174.7 |
| A | 4 | 2 | 26682 | 148.1 | 836 | 815 | 174.7 |
| A | 12 | 194 | 8324 | 42.99 | 836 | 815 | 174.7 |
| B | 15 | 204 | 747362 | 4601.08 | 835 | 812 | 162.3 |
| B | 5 | 172 | 388576 | 2389.83 | 835 | 812 | 162.3 |
| B | 0 | 219 | 144858 | 887.77 | 835 | 812 | 162.3 |
| C | 1 | 16 | 60043 | 313.97 | 809 | 814 | 188.6 |
| C | 8 | 128 | 11681 | 57.61 | 809 | 814 | 188.6 |
| C | 8 | 112 | 8390 | 40.16 | 809 | 814 | 188.6 |
| D | 2 | 136 | 231302 | 1146.28 | 807 | 781 | 201.1 |
| D | 11 | 192 | 106735 | 526.86 | 807 | 781 | 201.1 |
| D | 2 | 152 | 93875 | 462.92 | 807 | 781 | 201.1 |
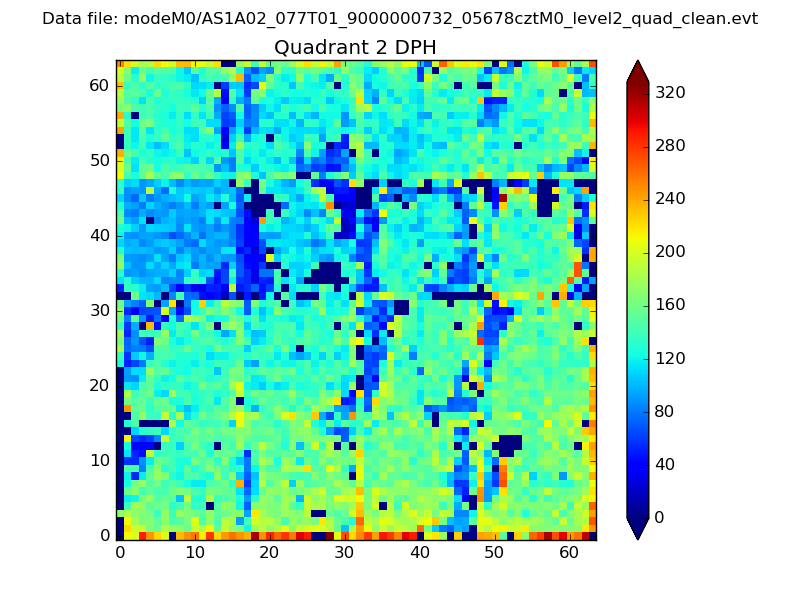
Histogram calculated using DETX and DETY for each event in the final _common_clean file
| Quadrant A | 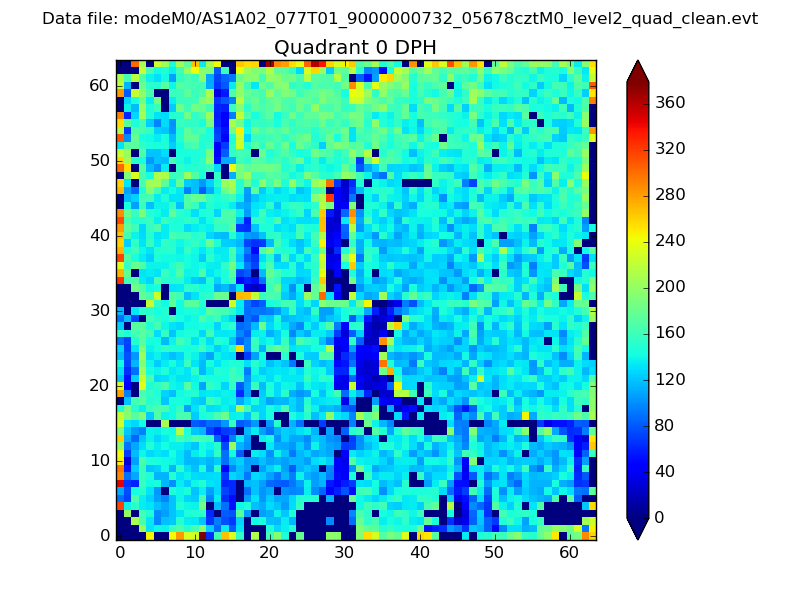 |
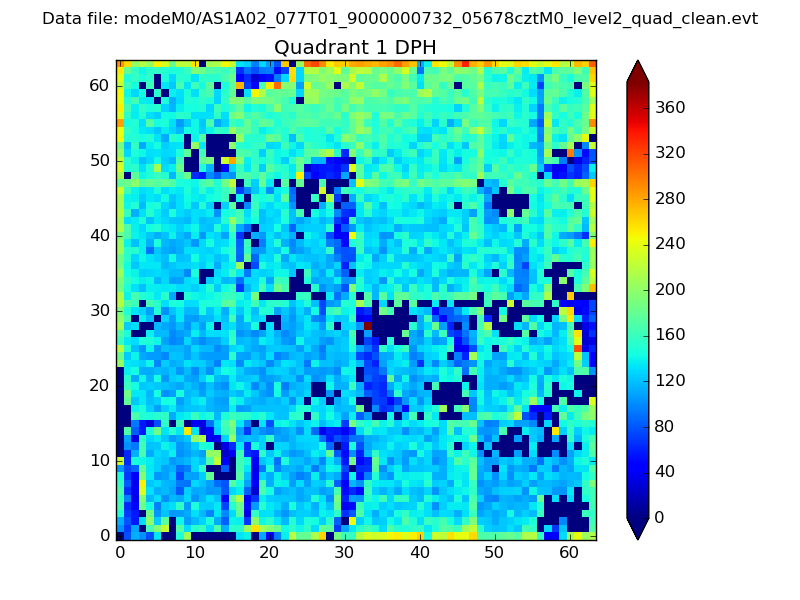 |
Quadrant B |
|---|---|---|---|
| Quadrant D | 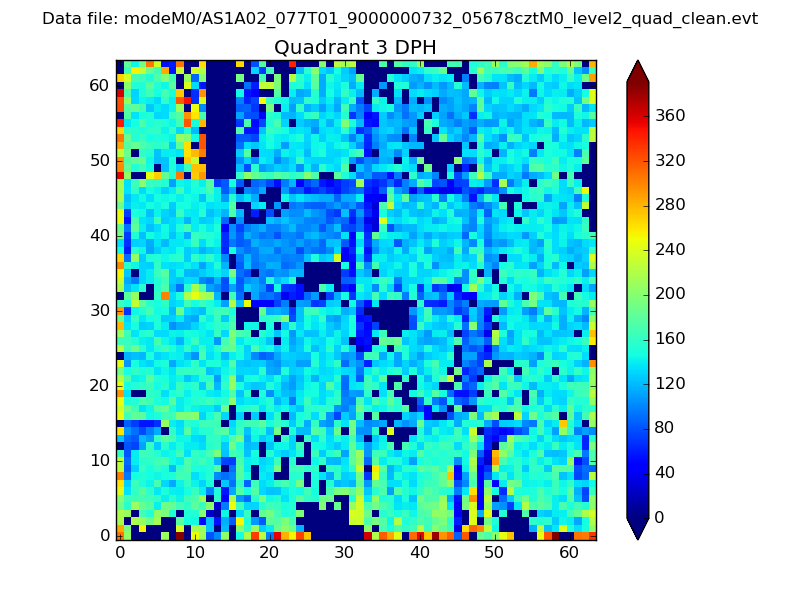 |
 |
Quadrant C |
| Plot type | Count rate plots | Images |
|---|---|---|
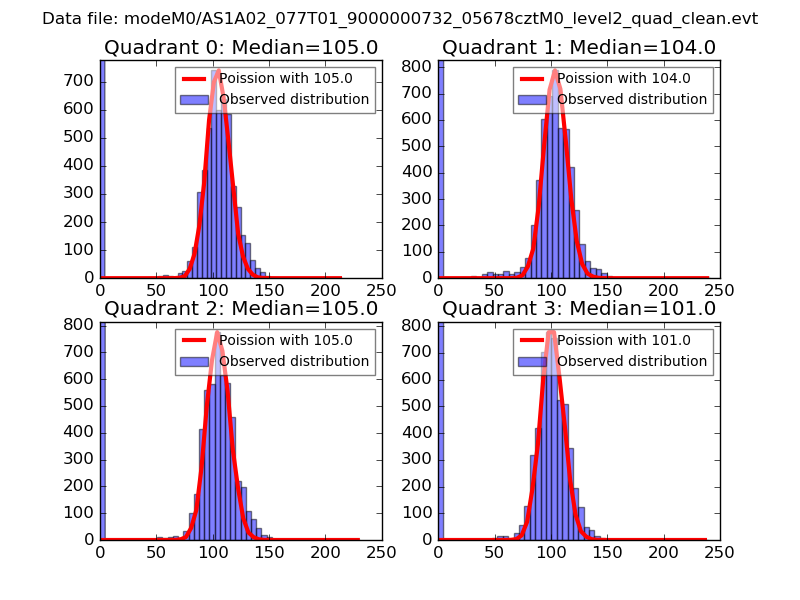
| Comparison with Poisson distribution Blue bars denote a histogram of data divided into 1 sec bins. Red curve is a Poisson curve with rate = median count rate of data. |
 |
 |
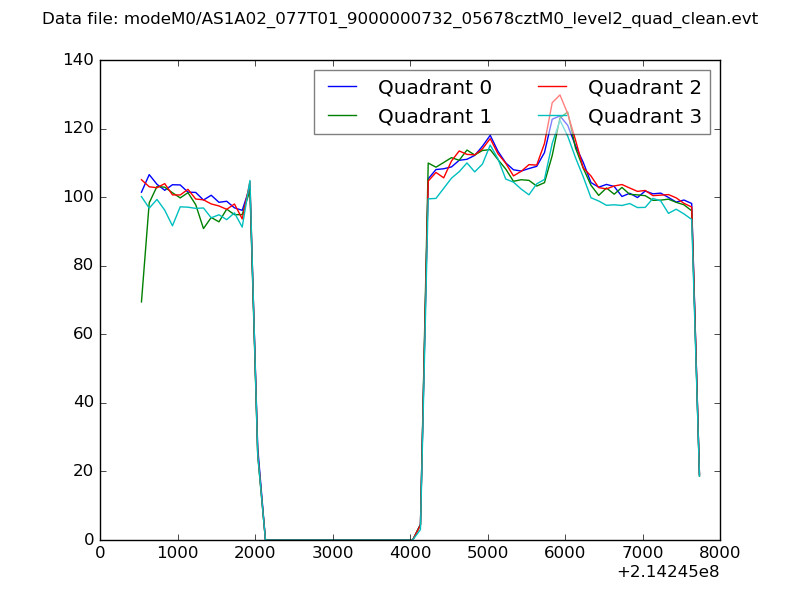
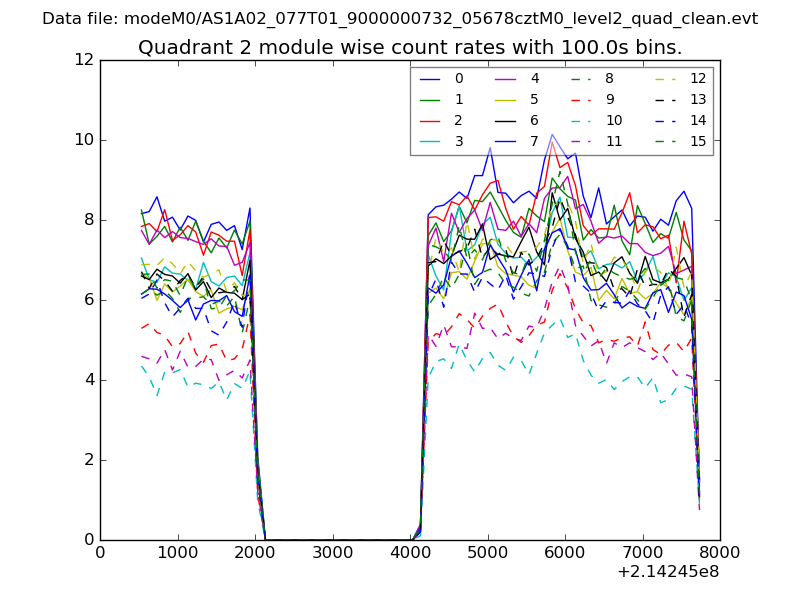
| Quadrant-wise count rates Data is divided into 100 sec bins |
 |
|
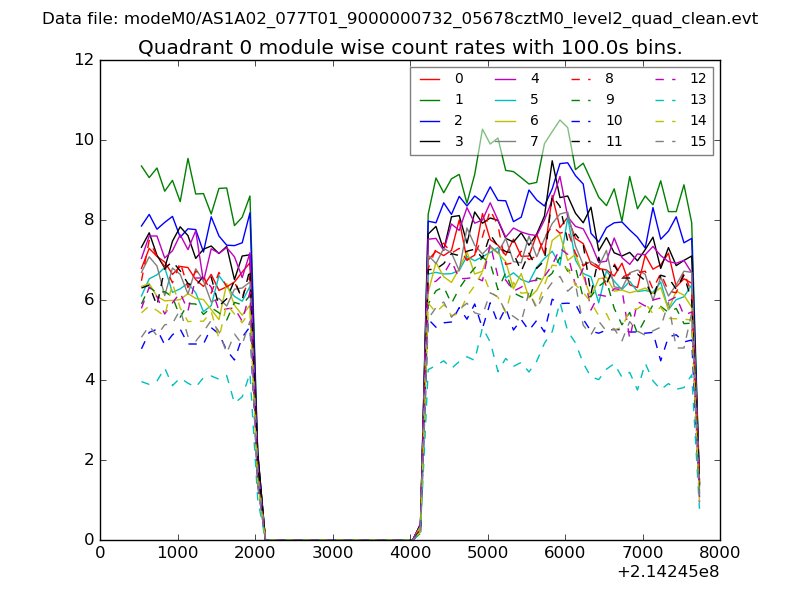
| Module-wise count rates for Quadrant A Data is divided into 100 sec bins |
 |
 |
| Module-wise count rates for Quadrant B Data is divided into 100 sec bins |
 |
 |
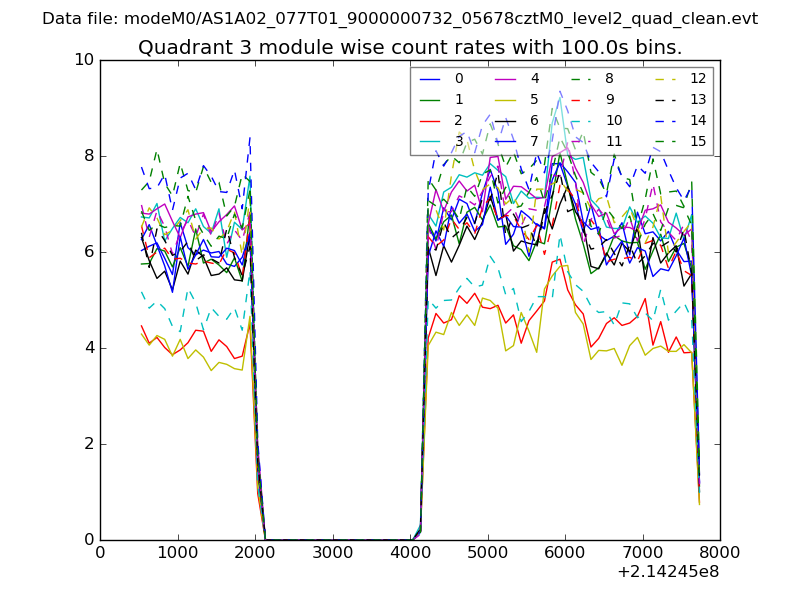
| Module-wise count rates for Quadrant C Data is divided into 100 sec bins |
 |
 |
| Module-wise count rates for Quadrant D Data is divided into 100 sec bins |
 |
 |
| Parameter | Plot |
|---|---|
| CZT HV Monitor |  |
| D_VDD | 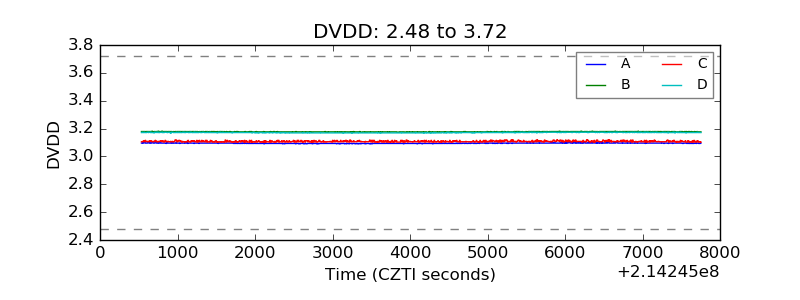 |
| Temperature 1 | 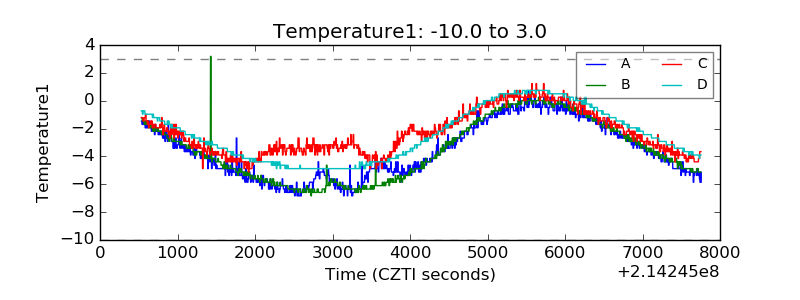 |
| Veto HV Monitor | 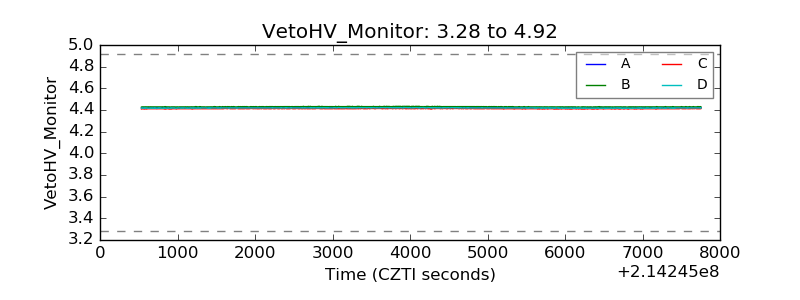 |
| Veto LLD | 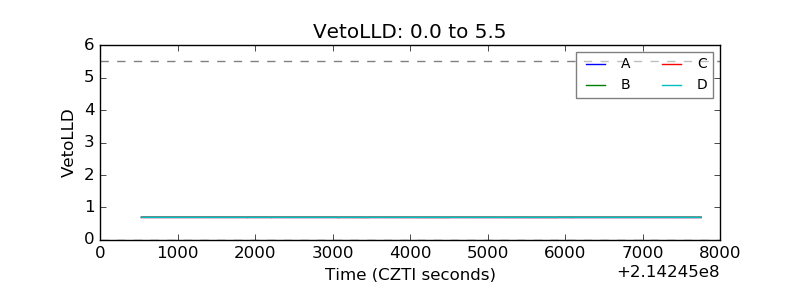 |
| Alpha Counter | 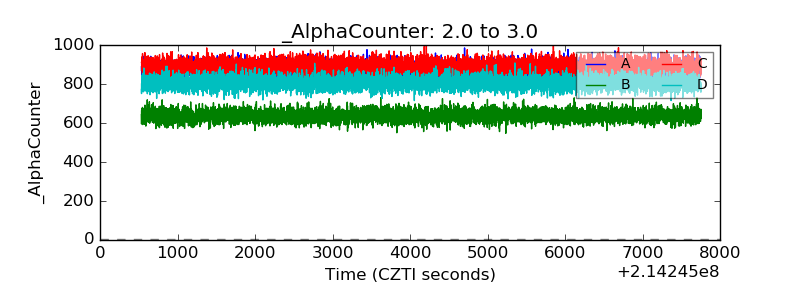 |
| _CPM_Rate | 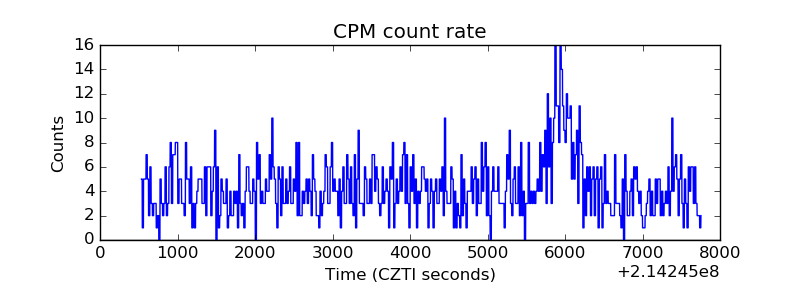 |
| CZT Counter | 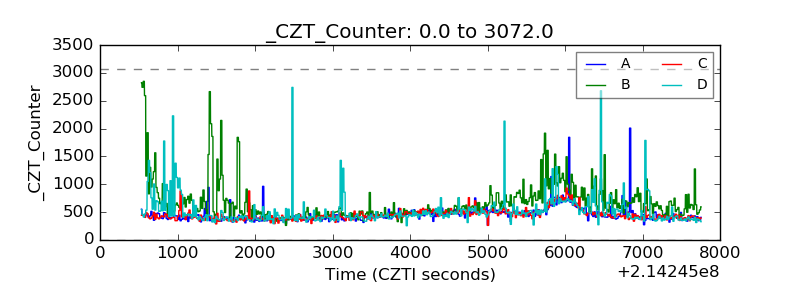 |
| +2.5 Volts monitor |  |
| +5 Volts monitor |  |
| _ROLL_ROT | 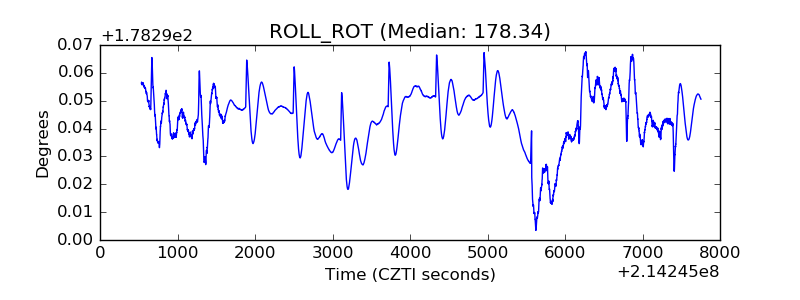 |
| _Roll_DEC | 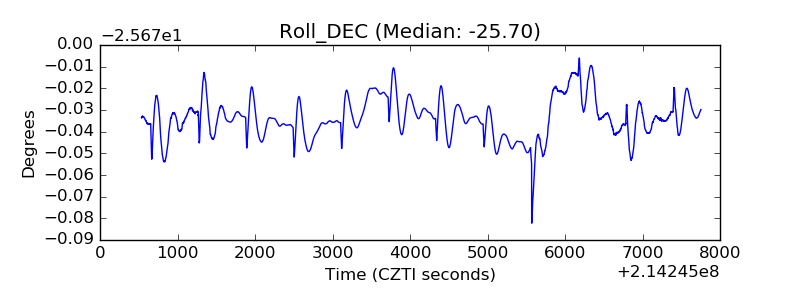 |
| _Roll_RA | 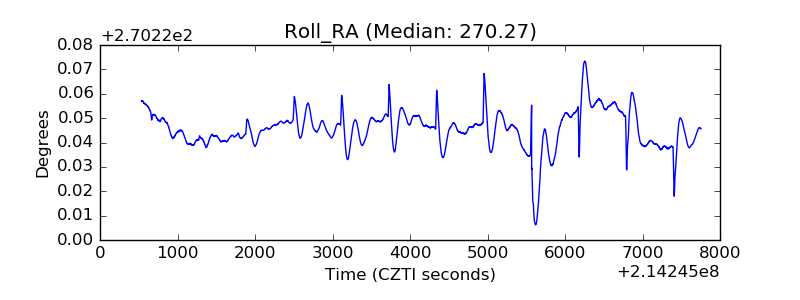 |
| Veto Counter |  |