| Param | Original file | Final file |
|---|---|---|
| Filename | modeM0/AS1A02_077T01_9000000732_05682cztM0_level2.evt | modeM0/AS1A02_077T01_9000000732_05682cztM0_level2_quad_clean.evt |
| Size (bytes) | 652,219,200 | 98,395,200 |
| Size | 622.0 MB | 93.8 MB |
| Events in quadrant A | 4,356,063 | 604,021 |
| Events in quadrant B | 5,393,198 | 572,451 |
| Events in quadrant C | 4,349,471 | 603,853 |
| Events in quadrant D | 5,021,441 | 554,073 |
| Mode M0 | |||
|---|---|---|---|
| Quadrant | BADHDUFLAG | Total packets | Discarded packets |
| A | 0 | 28269 | 8564 |
| B | 0 | 33354 | 11072 |
| C | 0 | 28276 | 8613 |
| D | 0 | 34079 | 12525 |
| Mode SS | |||
|---|---|---|---|
| Quadrant | BADHDUFLAG | Total packets | Discarded packets |
| A | 0 | 275 | 72 |
| B | 0 | 276 | 88 |
| C | 0 | 274 | 74 |
| D | 0 | 275 | 80 |
| Mode M9 | |||
|---|---|---|---|
| Quadrant | BADHDUFLAG | Total packets | Discarded packets |
| A | 0 | 8 | 2 |
| B | 0 | 8 | 1 |
| C | 0 | 8 | 1 |
| D | 0 | 8 | 0 |
| Quadrant | Total seconds | Saturated seconds | Saturation percentage |
|---|---|---|---|
| A | 9409 | 92 | 0.977787% |
| B | 9139 | 213 | 2.330671% |
| C | 9395 | 73 | 0.777009% |
| D | 9048 | 130 | 1.436782% |
Noise dominated data is calculated using 1-second bins in cleaned event files. If a bin has >2000 counts, and if more than 50% of those come from <1% of pixels, then it is considered to be noise-dominated and hence unusable.
| Quadrant | # 1 sec bins | Bins with >0 counts | Bins with >2000 counts | High rate bins dominated by noise | Noise dominated (total time) | Noise dominated (detector-on time) | Marked lightcurve |
|---|---|---|---|---|---|---|---|
| A | 14312 | 11204 | 17 | 17 | 0.12% | 0.15% | 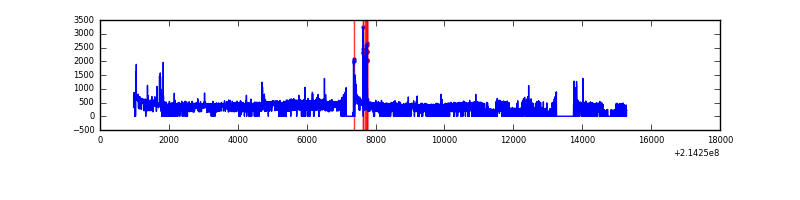 |
| B | 14306 | 10997 | 50 | 50 | 0.35% | 0.45% | 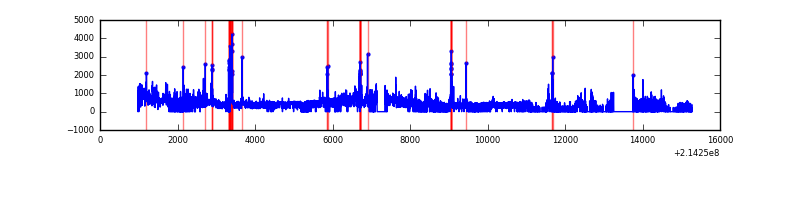 |
| C | 14308 | 11213 | 16 | 16 | 0.11% | 0.14% | 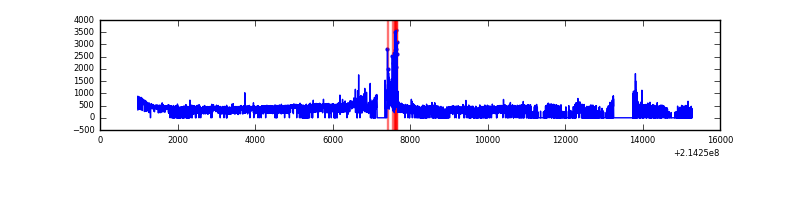 |
| D | 14304 | 10897 | 64 | 64 | 0.45% | 0.59% | 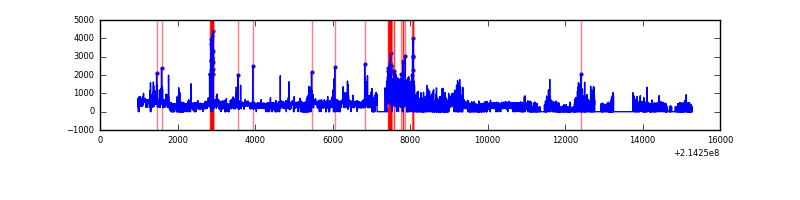 |
Top three noisy pixels from each quadrant. If the there are fewer than three noisy pixels in the level2.evt file, extra rows are filled as -1
| Pixel properties | Quadrant properties | ||||||
|---|---|---|---|---|---|---|---|
| Quadrant | DetID | PixID | Counts | Sigma | Mean | Median | Sigma |
| A | 0 | 50 | 145423 | 642.18 | 1081 | 1055 | 224.8 |
| A | 15 | 174 | 26673 | 113.95 | 1081 | 1055 | 224.8 |
| A | 0 | 226 | 10796 | 43.33 | 1081 | 1055 | 224.8 |
| B | 15 | 204 | 474367 | 2285.65 | 1060 | 1033 | 207.1 |
| B | 5 | 172 | 295120 | 1420.09 | 1060 | 1033 | 207.1 |
| B | 0 | 219 | 164183 | 787.82 | 1060 | 1033 | 207.1 |
| C | 5 | 250 | 108707 | 441.53 | 1046 | 1051 | 243.8 |
| C | 1 | 16 | 88304 | 357.85 | 1046 | 1051 | 243.8 |
| C | 3 | 9 | 28307 | 111.79 | 1046 | 1051 | 243.8 |
| D | 12 | 110 | 628095 | 2509.13 | 1005 | 972 | 249.9 |
| D | 2 | 152 | 210542 | 838.49 | 1005 | 972 | 249.9 |
| D | 11 | 192 | 106990 | 424.18 | 1005 | 972 | 249.9 |
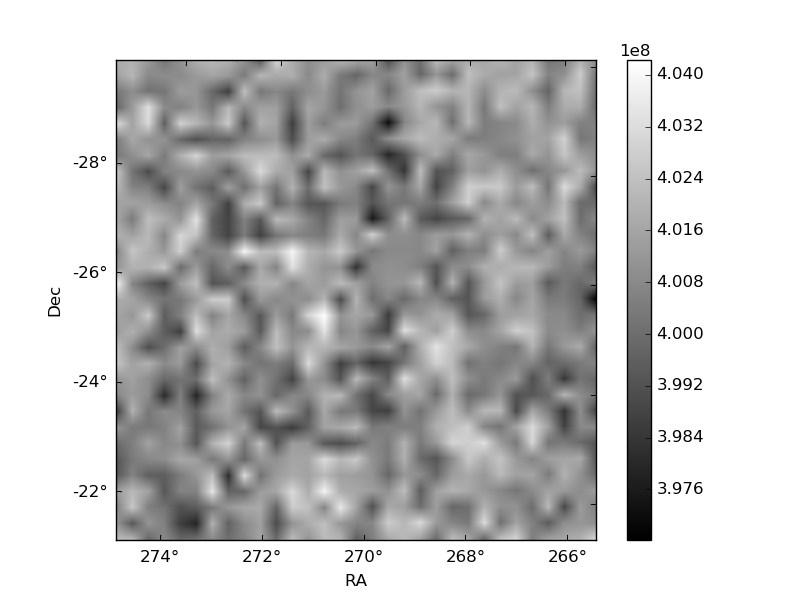
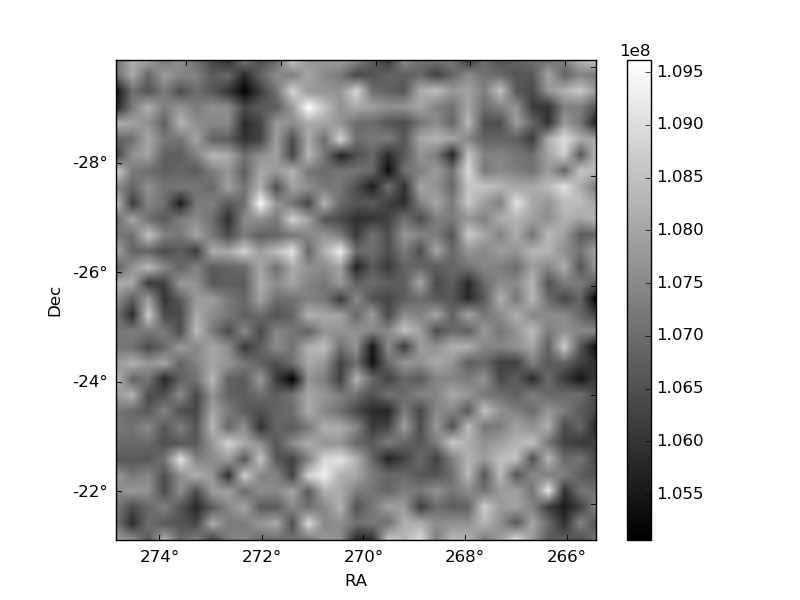
Histogram calculated using DETX and DETY for each event in the final _common_clean file
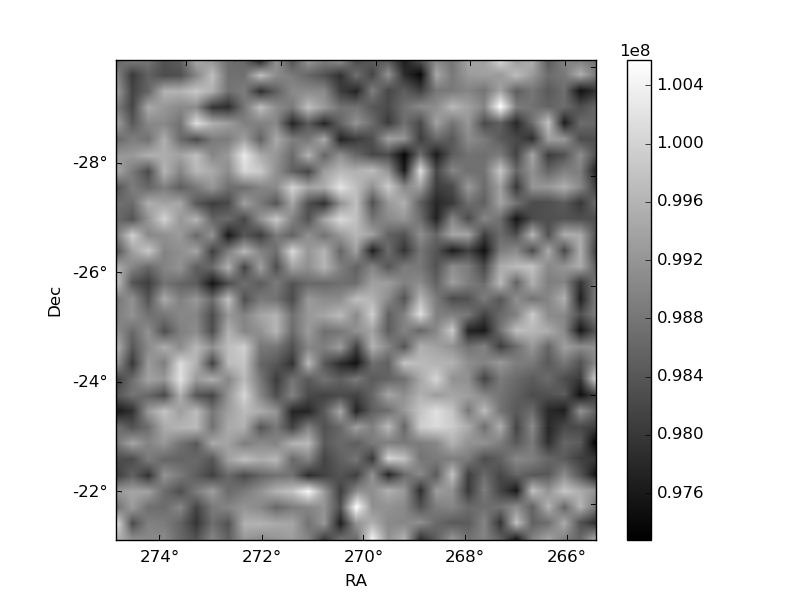
| Quadrant A | 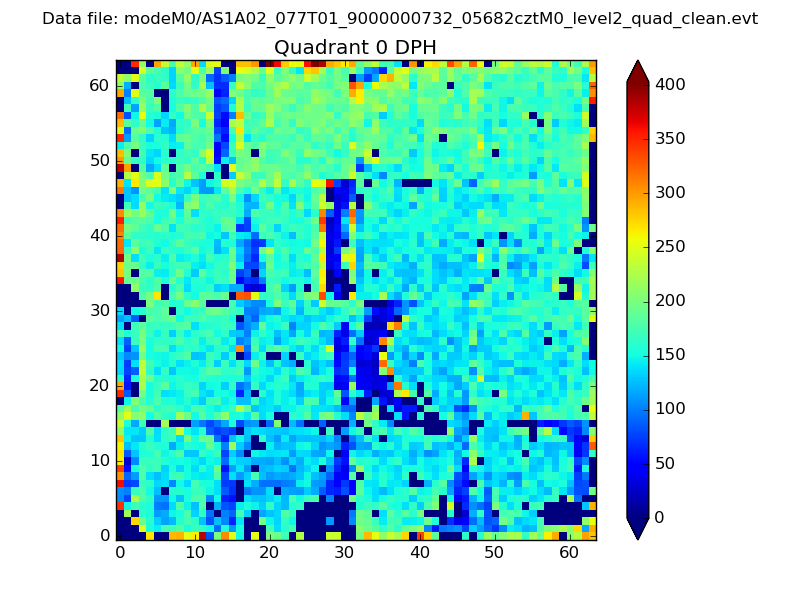 |
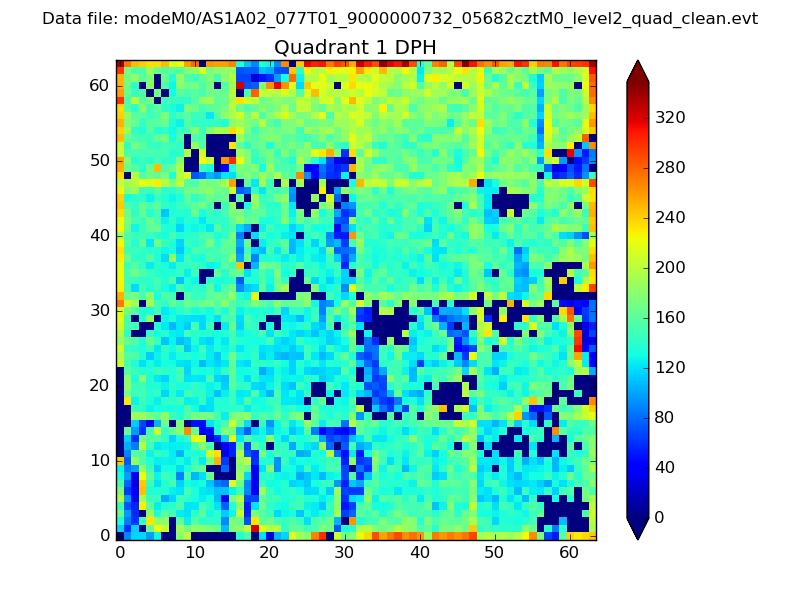 |
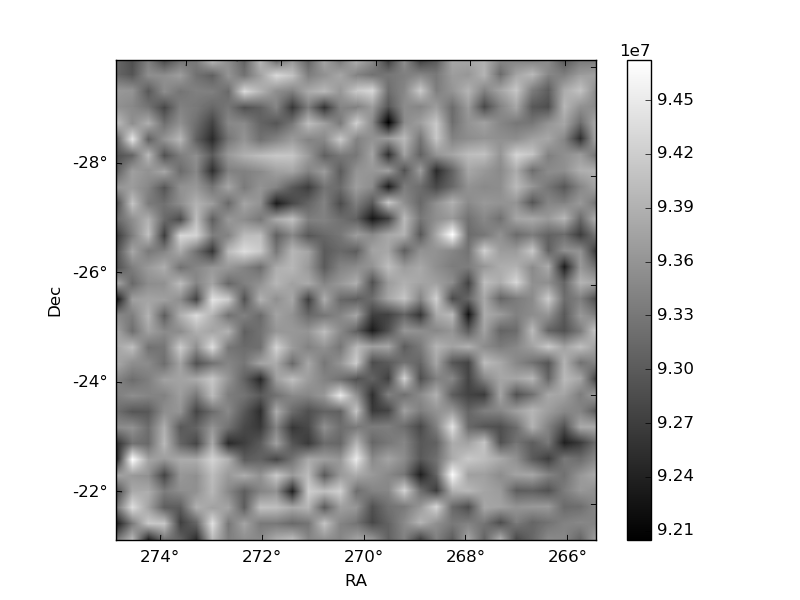
Quadrant B |
|---|---|---|---|
| Quadrant D | 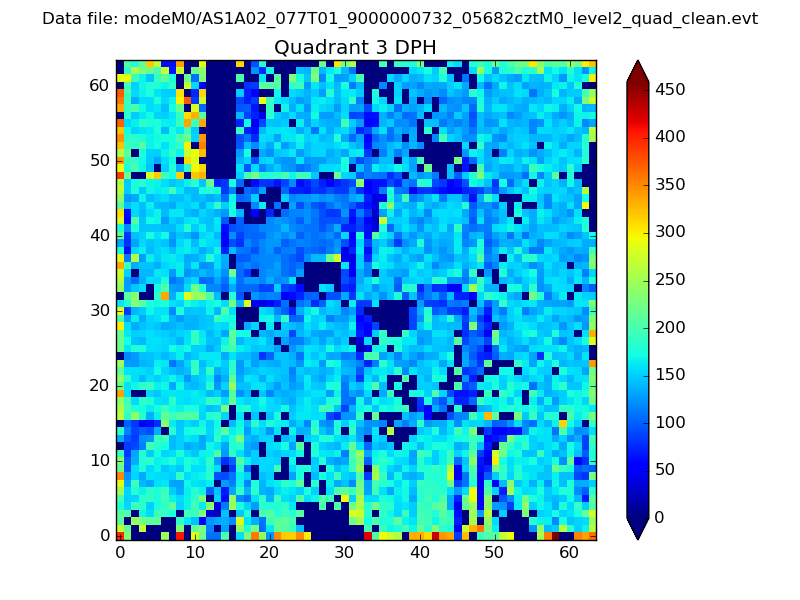 |
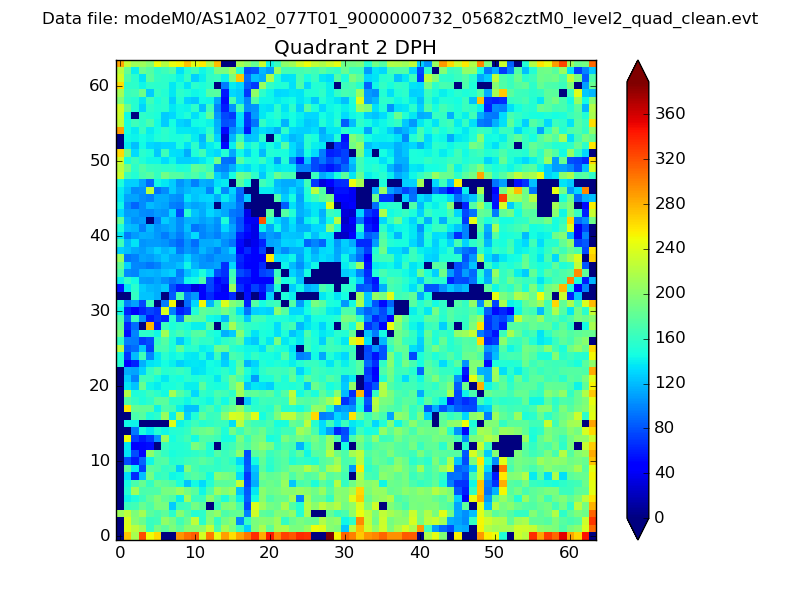 |
Quadrant C |
| Plot type | Count rate plots | Images |
|---|---|---|
| Comparison with Poisson distribution Blue bars denote a histogram of data divided into 1 sec bins. Red curve is a Poisson curve with rate = median count rate of data. |
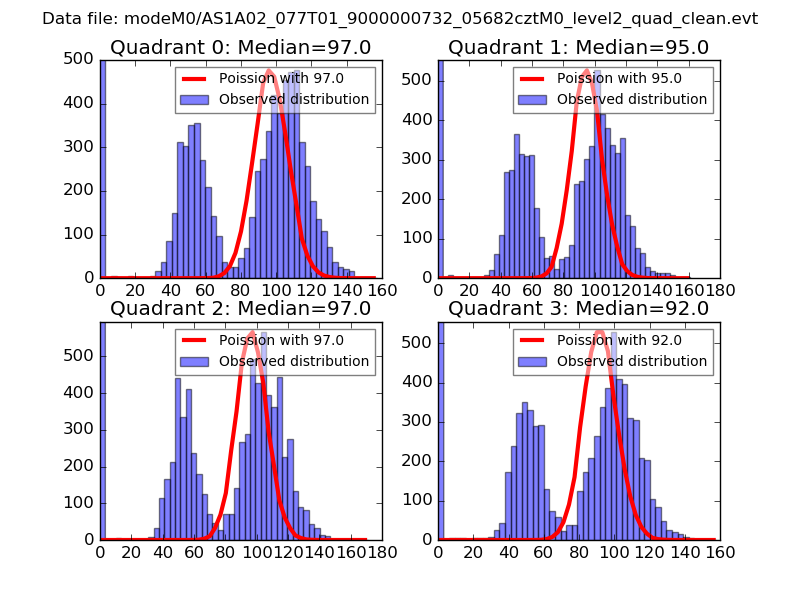 |
 |
| Quadrant-wise count rates Data is divided into 100 sec bins |
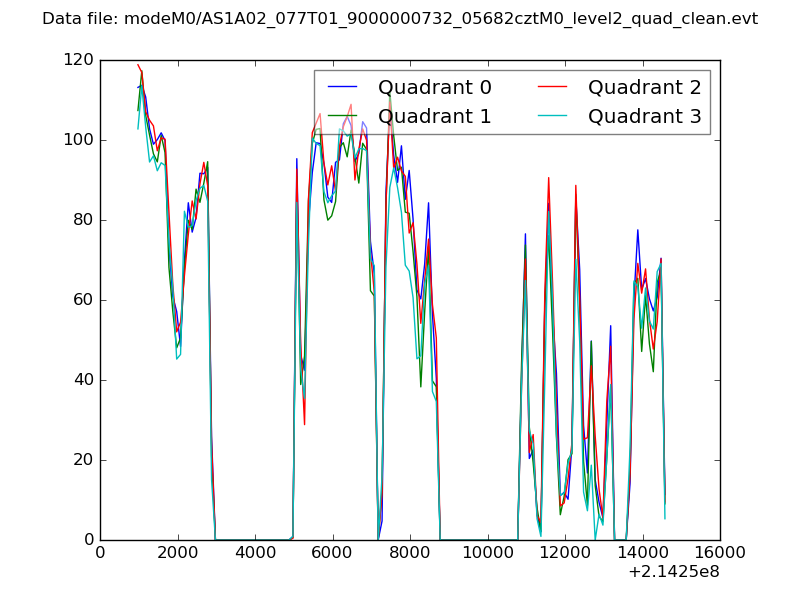 |
|
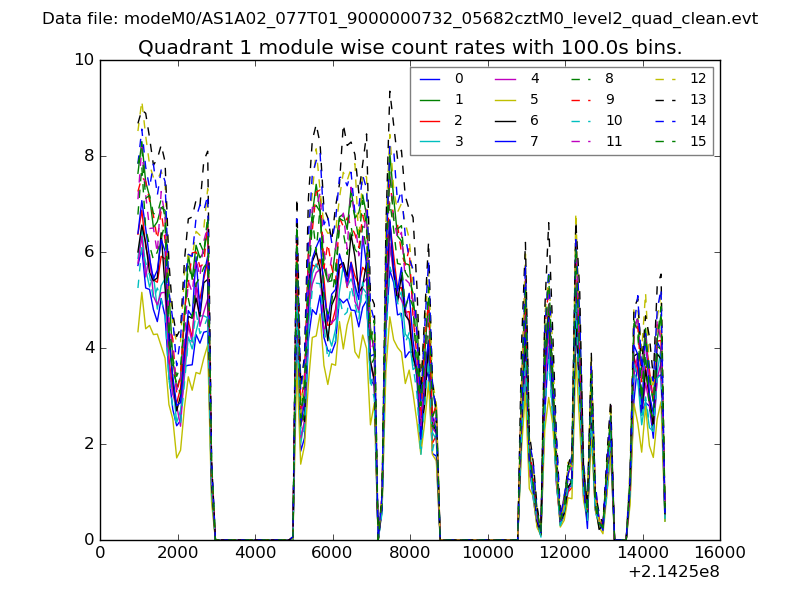
| Module-wise count rates for Quadrant A Data is divided into 100 sec bins |
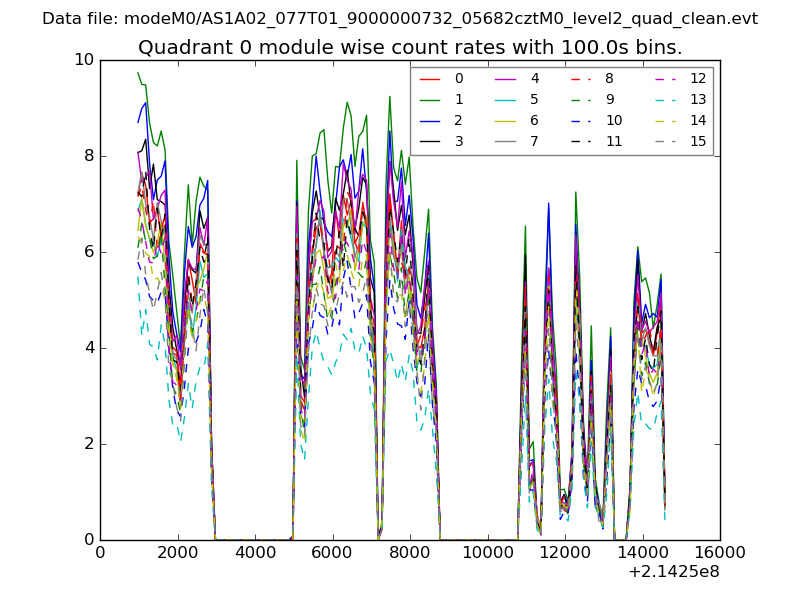 |
 |
| Module-wise count rates for Quadrant B Data is divided into 100 sec bins |
 |
 |
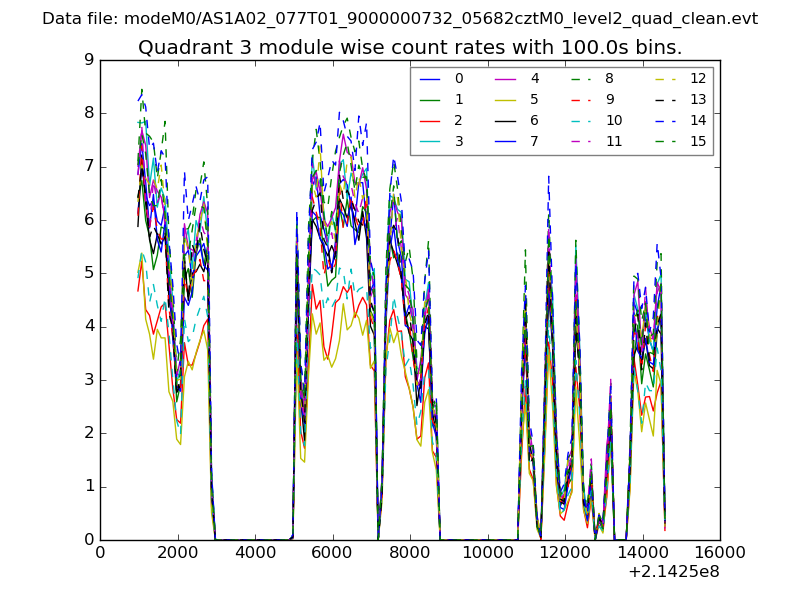
| Module-wise count rates for Quadrant C Data is divided into 100 sec bins |
 |
 |
| Module-wise count rates for Quadrant D Data is divided into 100 sec bins |
 |
 |
| Parameter | Plot |
|---|---|
| CZT HV Monitor | 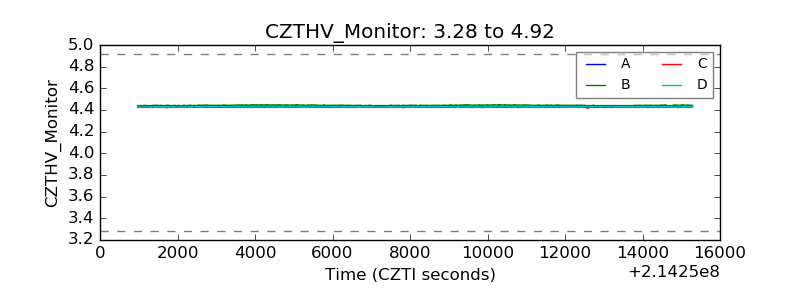 |
| D_VDD | 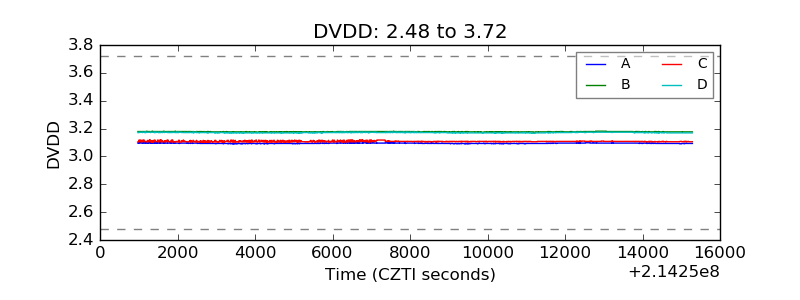 |
| Temperature 1 | 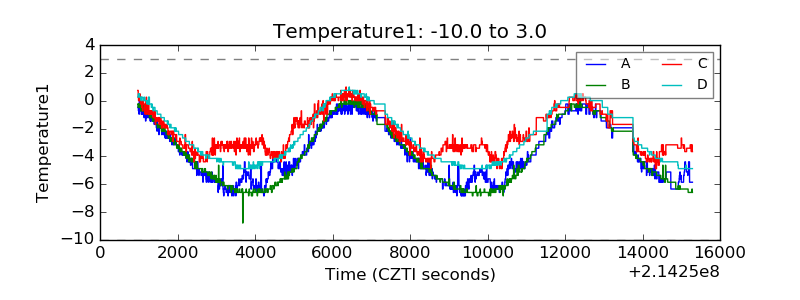 |
| Veto HV Monitor | 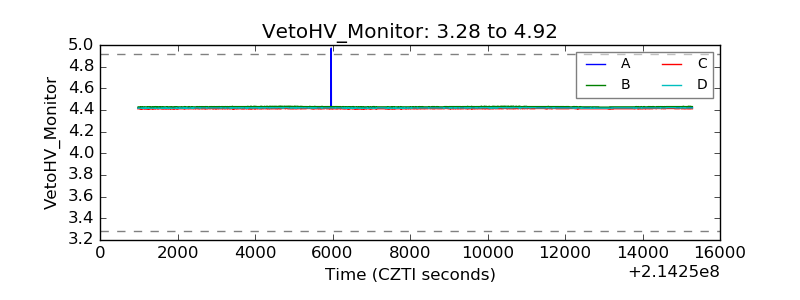 |
| Veto LLD | 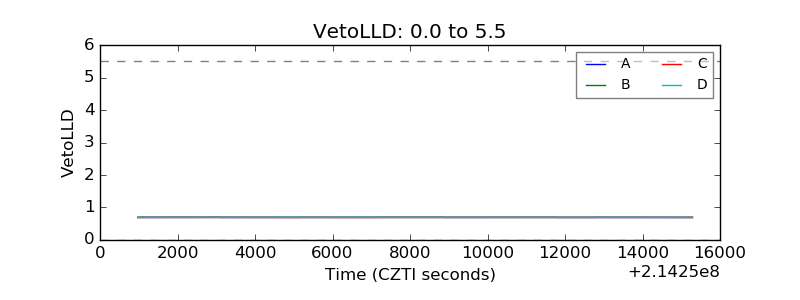 |
| Alpha Counter | 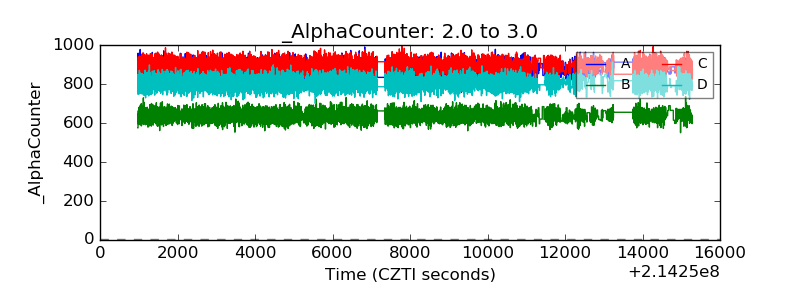 |
| _CPM_Rate | 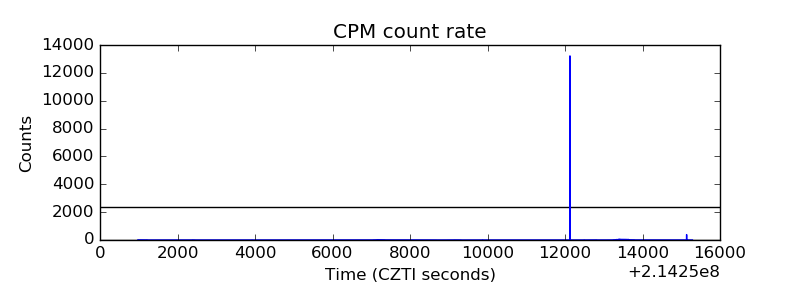 |
| CZT Counter | 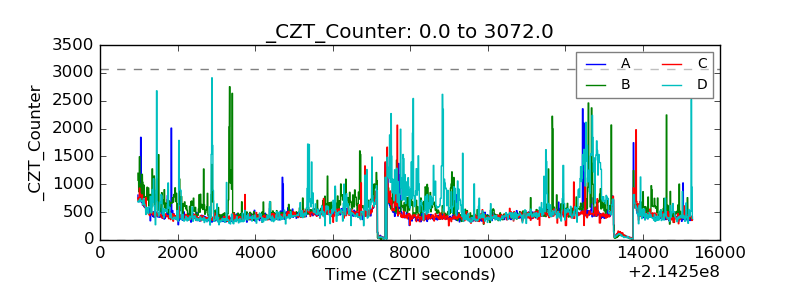 |
| +2.5 Volts monitor |  |
| +5 Volts monitor | 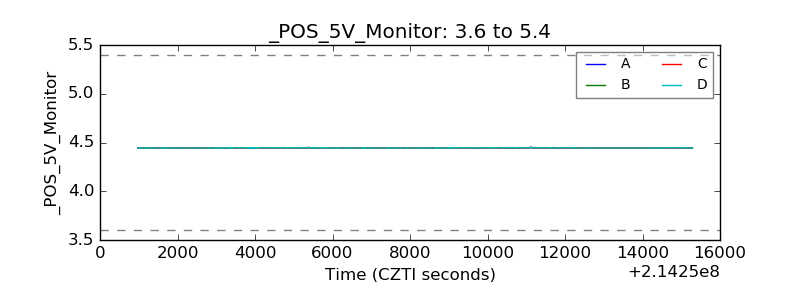 |
| _ROLL_ROT | 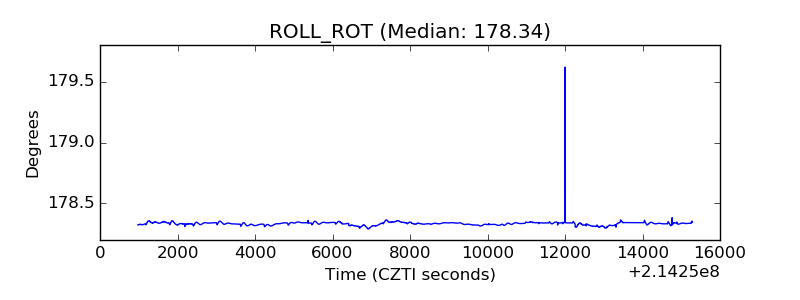 |
| _Roll_DEC | 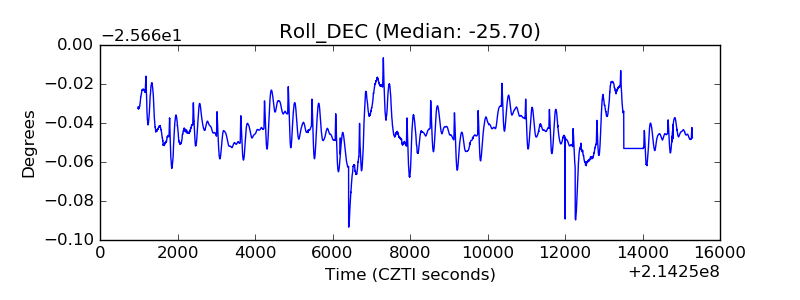 |
| _Roll_RA | 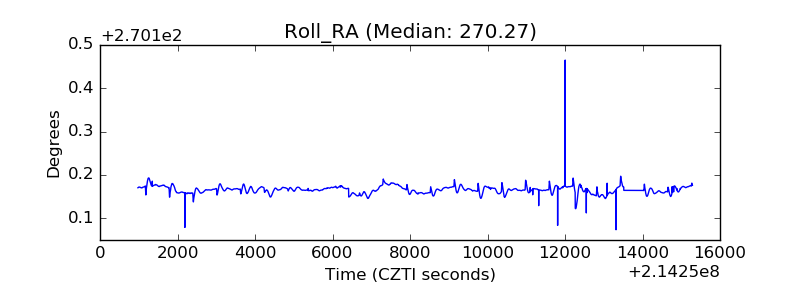 |
| Veto Counter | 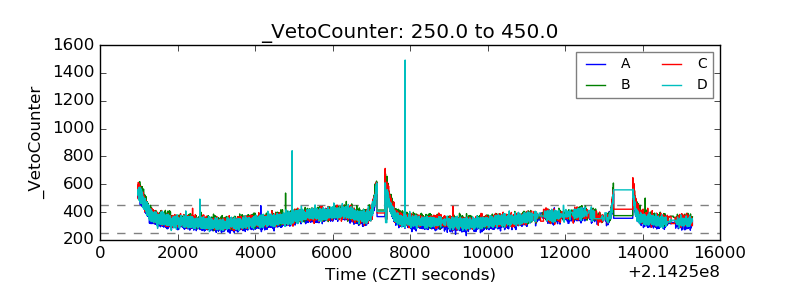 |