| Param | Original file | Final file |
|---|---|---|
| Filename | modeM0/AS1G06_115T01_9000000734cztM0_level2.fits | modeM0/AS1G06_115T01_9000000734cztM0_level2_quad_clean.evt |
| Size (bytes) | 715,515,840 | 774,181,440 |
| Size | 682.4 MB | 738.3 MB |
| Events in quadrant A | 4,307,927 | 4,701,833 |
| Events in quadrant B | 4,148,974 | 4,671,712 |
| Events in quadrant C | 4,242,750 | 4,559,231 |
| Events in quadrant D | 3,640,458 | 4,186,194 |
| Mode M0 | |||
|---|---|---|---|
| Quadrant | BADHDUFLAG | Total packets | Discarded packets |
| A | 0 | 159434 | 0 |
| B | 0 | 171821 | 0 |
| C | 0 | 161861 | 0 |
| D | 0 | 176878 | 0 |
| Mode M9 | |||
|---|---|---|---|
| Quadrant | BADHDUFLAG | Total packets | Discarded packets |
| A | 0 | 112 | 0 |
| B | 0 | 112 | 0 |
| C | 0 | 112 | 0 |
| D | 0 | 112 | 0 |
| Mode SS | |||
|---|---|---|---|
| Quadrant | BADHDUFLAG | Total packets | Discarded packets |
| A | 0 | 1583 | 0 |
| B | 0 | 1588 | 0 |
| C | 0 | 1582 | 0 |
| D | 0 | 1588 | 0 |
| Quadrant | Total seconds | Saturated seconds | Saturation percentage |
|---|---|---|---|
| A | 77699 | 758 | 0.975560% |
| B | 77664 | 1463 | 1.883756% |
| C | 77700 | 612 | 0.787645% |
| D | 77715 | 1626 | 2.092260% |
Noise dominated data is calculated using 1-second bins in cleaned event files. If a bin has >2000 counts, and if more than 50% of those come from <1% of pixels, then it is considered to be noise-dominated and hence unusable.
| Quadrant | # 1 sec bins | Bins with >0 counts | Bins with >2000 counts | High rate bins dominated by noise | Noise dominated (total time) | Noise dominated (detector-on time) | Marked lightcurve |
|---|---|---|---|---|---|---|---|
| A | 89472 | 78097 | 0 | 0 | 0.00% | 0.00% |  |
| B | 89472 | 78071 | 0 | 0 | 0.00% | 0.00% |  |
| C | 89472 | 78094 | 0 | 0 | 0.00% | 0.00% |  |
| D | 89472 | 78098 | 0 | 0 | 0.00% | 0.00% |  |
Top three noisy pixels from each quadrant. If the there are fewer than three noisy pixels in the level2.evt file, extra rows are filled as -1
| Pixel properties | Quadrant properties | ||||||
|---|---|---|---|---|---|---|---|
| Quadrant | DetID | PixID | Counts | Sigma | Mean | Median | Sigma |
| A | 0 | 29 | 4181 | 10.96 | 1120 | 1046 | 286.1 |
| A | 7 | 110 | 3725 | 9.36 | 1120 | 1046 | 286.1 |
| A | 0 | 30 | 3322 | 7.96 | 1120 | 1046 | 286.1 |
| B | 2 | 9 | 3543 | 11.55 | 1094 | 1042 | 216.5 |
| B | 12 | 226 | 2977 | 8.94 | 1094 | 1042 | 216.5 |
| B | 14 | 254 | 2835 | 8.28 | 1094 | 1042 | 216.5 |
| C | 1 | 81 | 3052 | 6.82 | 1119 | 1036 | 295.6 |
| C | 1 | 80 | 3051 | 6.82 | 1119 | 1036 | 295.6 |
| C | 12 | 241 | 3050 | 6.81 | 1119 | 1036 | 295.6 |
| D | 6 | 231 | 2805 | 6.73 | 1040 | 948 | 276.0 |
| D | 3 | 14 | 2746 | 6.51 | 1040 | 948 | 276.0 |
| D | 3 | 31 | 2621 | 6.06 | 1040 | 948 | 276.0 |
Histogram calculated using DETX and DETY for each event in the final _common_clean file
| Quadrant A | 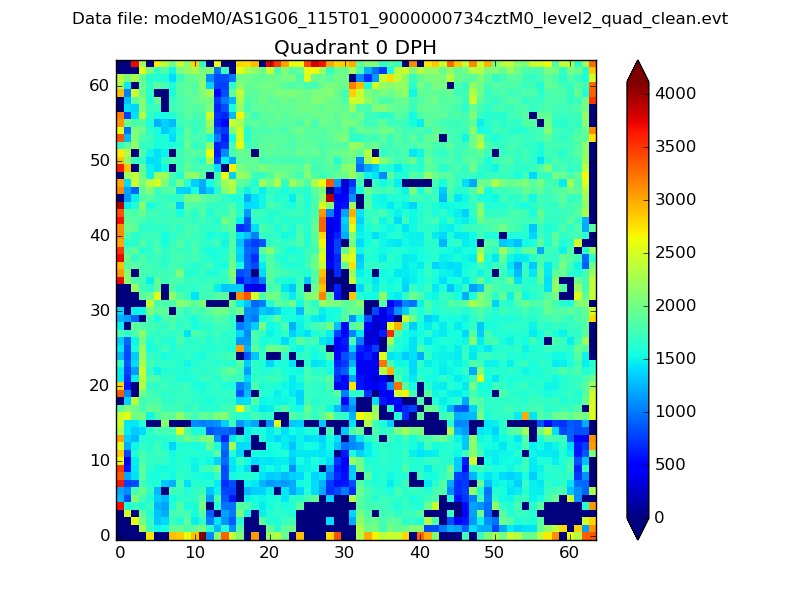 |
 |
Quadrant B |
|---|---|---|---|
| Quadrant D | 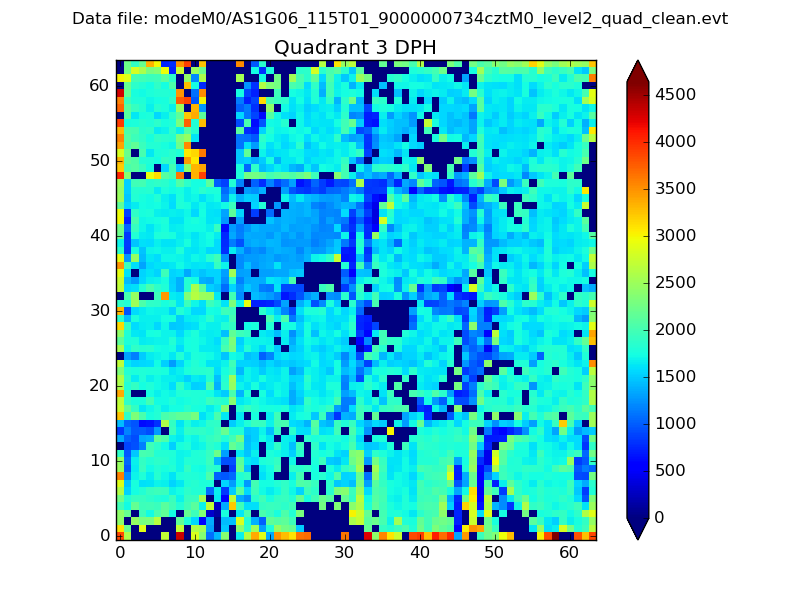 |
 |
Quadrant C |
| Plot type | Count rate plots | Images |
|---|---|---|
| Comparison with Poisson distribution Blue bars denote a histogram of data divided into 1 sec bins. Red curve is a Poisson curve with rate = median count rate of data. |
 |
 |
| Quadrant-wise count rates Data is divided into 100 sec bins |
 |
|
| Module-wise count rates for Quadrant A Data is divided into 100 sec bins |
 |
 |
| Module-wise count rates for Quadrant B Data is divided into 100 sec bins |
 |
 |
| Module-wise count rates for Quadrant C Data is divided into 100 sec bins |
 |
 |
| Module-wise count rates for Quadrant D Data is divided into 100 sec bins |
 |
 |
| Parameter | Plot |
|---|---|
| CZT HV Monitor |  |
| D_VDD | 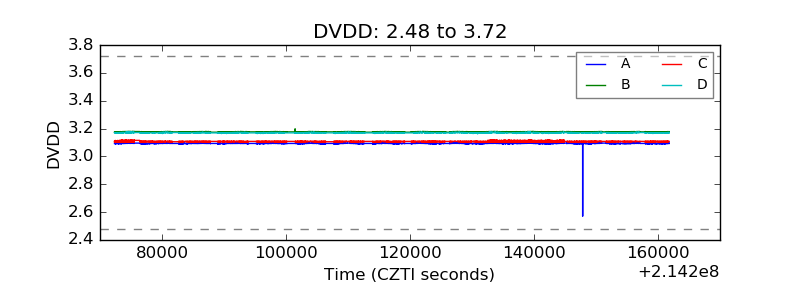 |
| Temperature 1 |  |
| Veto HV Monitor |  |
| Veto LLD |  |
| Alpha Counter |  |
| _CPM_Rate |  |
| CZT Counter |  |
| +2.5 Volts monitor |  |
| +5 Volts monitor |  |
| _ROLL_ROT |  |
| _Roll_DEC |  |
| _Roll_RA |  |
| Veto Counter |  |