| Param | Original file | Final file |
|---|---|---|
| Filename | modeM0/AS1G06_115T01_9000000734_05683cztM0_level2.evt | modeM0/AS1G06_115T01_9000000734_05683cztM0_level2_quad_clean.evt |
| Size (bytes) | 624,274,560 | 102,821,760 |
| Size | 595.4 MB | 98.1 MB |
| Events in quadrant A | 4,218,103 | 617,779 |
| Events in quadrant B | 4,949,466 | 613,191 |
| Events in quadrant C | 4,531,772 | 621,082 |
| Events in quadrant D | 4,560,393 | 601,636 |
| Mode M0 | |||
|---|---|---|---|
| Quadrant | BADHDUFLAG | Total packets | Discarded packets |
| A | 0 | 20233 | 974 |
| B | 0 | 22098 | 1125 |
| C | 0 | 20838 | 970 |
| D | 0 | 21210 | 1014 |
| Mode M9 | |||
|---|---|---|---|
| Quadrant | BADHDUFLAG | Total packets | Discarded packets |
| A | 0 | 18 | 0 |
| B | 0 | 18 | 0 |
| C | 0 | 18 | 0 |
| D | 0 | 18 | 0 |
| Mode SS | |||
|---|---|---|---|
| Quadrant | BADHDUFLAG | Total packets | Discarded packets |
| A | 0 | 202 | 7 |
| B | 0 | 204 | 4 |
| C | 0 | 204 | 10 |
| D | 0 | 204 | 4 |
| Quadrant | Total seconds | Saturated seconds | Saturation percentage |
|---|---|---|---|
| A | 9503 | 64 | 0.673472% |
| B | 9472 | 138 | 1.456926% |
| C | 9507 | 73 | 0.767855% |
| D | 9523 | 83 | 0.871574% |
Noise dominated data is calculated using 1-second bins in cleaned event files. If a bin has >2000 counts, and if more than 50% of those come from <1% of pixels, then it is considered to be noise-dominated and hence unusable.
| Quadrant | # 1 sec bins | Bins with >0 counts | Bins with >2000 counts | High rate bins dominated by noise | Noise dominated (total time) | Noise dominated (detector-on time) | Marked lightcurve |
|---|---|---|---|---|---|---|---|
| A | 11786 | 9902 | 0 | 0 | 0.00% | 0.00% | 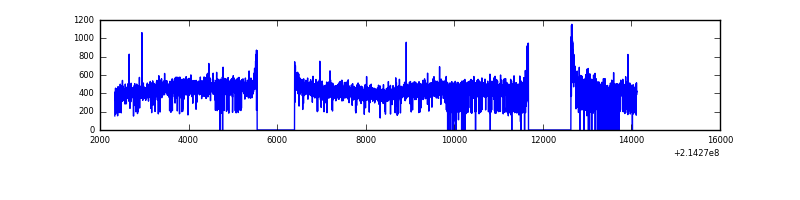 |
| B | 11786 | 9887 | 30 | 30 | 0.25% | 0.30% | 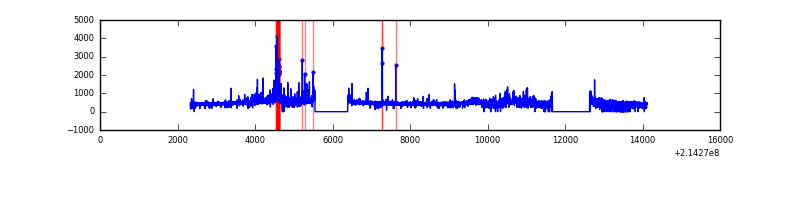 |
| C | 11786 | 9896 | 0 | 0 | 0.00% | 0.00% | 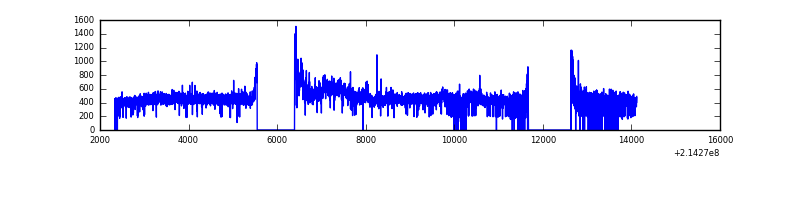 |
| D | 11786 | 9907 | 19 | 19 | 0.16% | 0.19% | 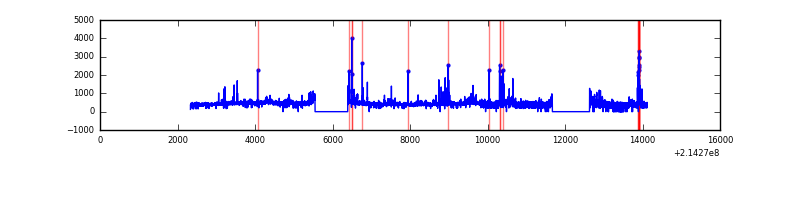 |
Top three noisy pixels from each quadrant. If the there are fewer than three noisy pixels in the level2.evt file, extra rows are filled as -1
| Pixel properties | Quadrant properties | ||||||
|---|---|---|---|---|---|---|---|
| Quadrant | DetID | PixID | Counts | Sigma | Mean | Median | Sigma |
| A | 13 | 6 | 12780 | 52.38 | 1093 | 1066 | 223.6 |
| A | 12 | 194 | 10567 | 42.49 | 1093 | 1066 | 223.6 |
| A | 0 | 226 | 10278 | 41.2 | 1093 | 1066 | 223.6 |
| B | 15 | 204 | 301086 | 1428.29 | 1097 | 1071 | 210.1 |
| B | 4 | 81 | 211441 | 1001.52 | 1097 | 1071 | 210.1 |
| B | 0 | 214 | 57676 | 269.48 | 1097 | 1071 | 210.1 |
| C | 1 | 16 | 355374 | 1435.51 | 1066 | 1069 | 246.8 |
| C | 13 | 61 | 8794 | 31.3 | 1066 | 1069 | 246.8 |
| C | 8 | 128 | 7057 | 24.26 | 1066 | 1069 | 246.8 |
| D | 8 | 195 | 117690 | 445.72 | 1067 | 1031 | 261.7 |
| D | 2 | 152 | 98131 | 370.99 | 1067 | 1031 | 261.7 |
| D | 12 | 233 | 95396 | 360.54 | 1067 | 1031 | 261.7 |
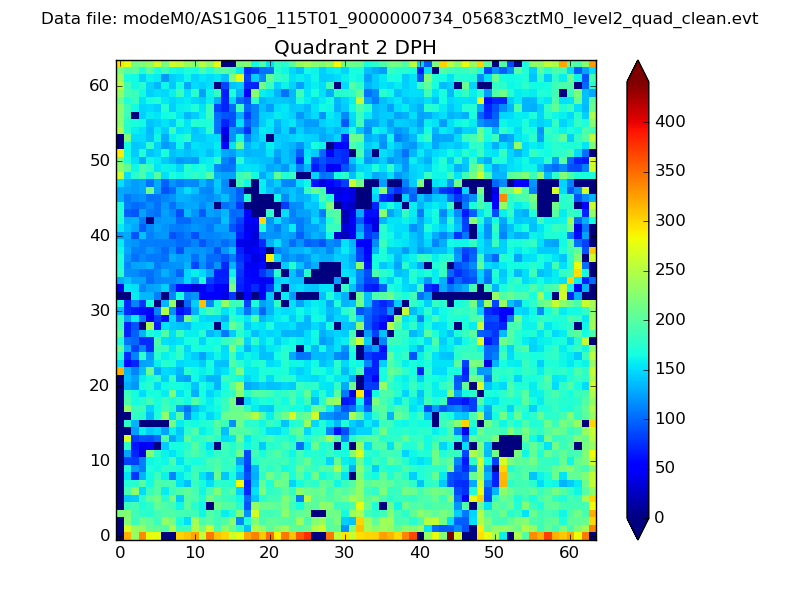
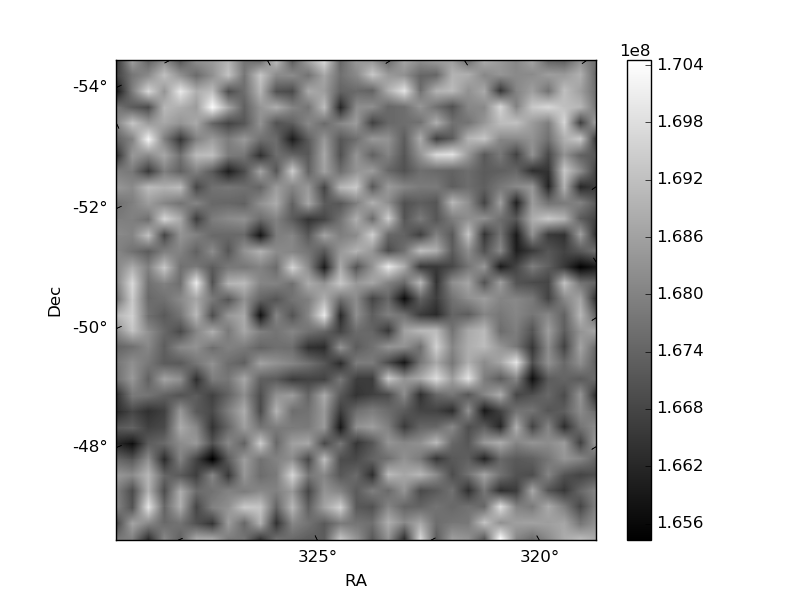
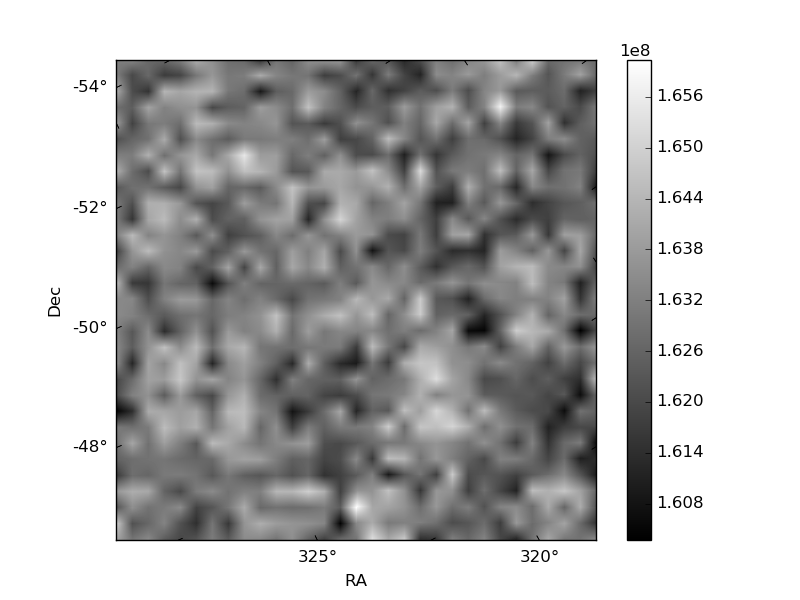
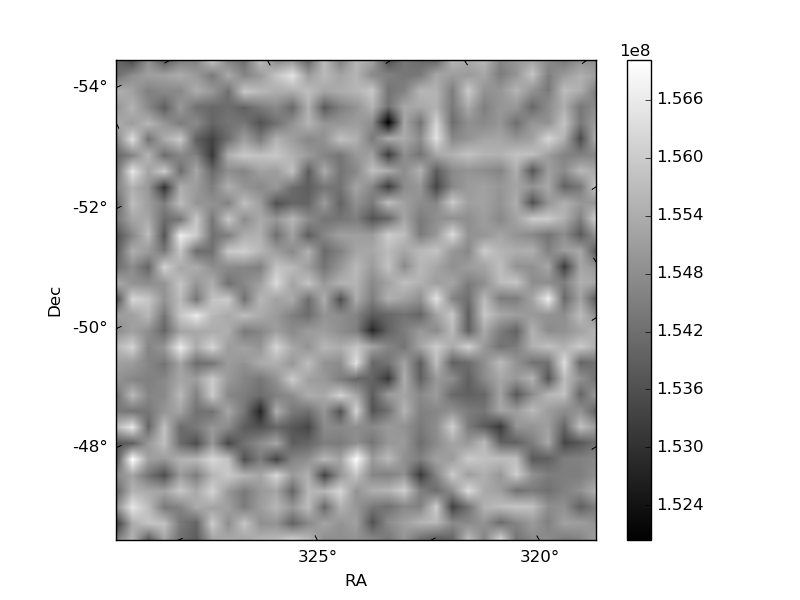
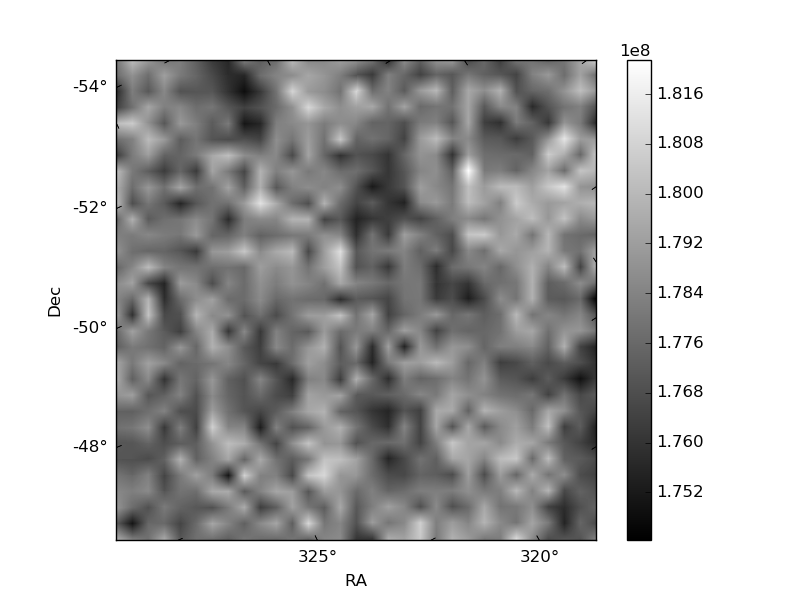
Histogram calculated using DETX and DETY for each event in the final _common_clean file
| Quadrant A | 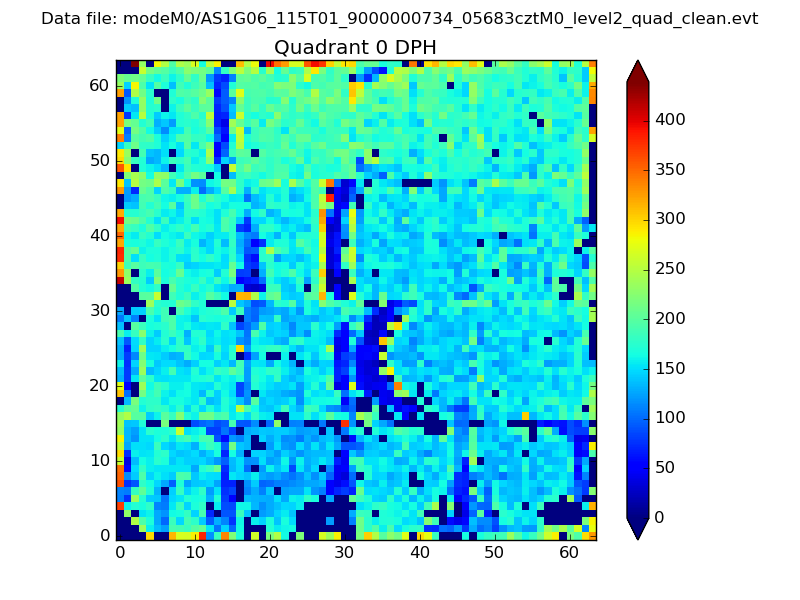 |
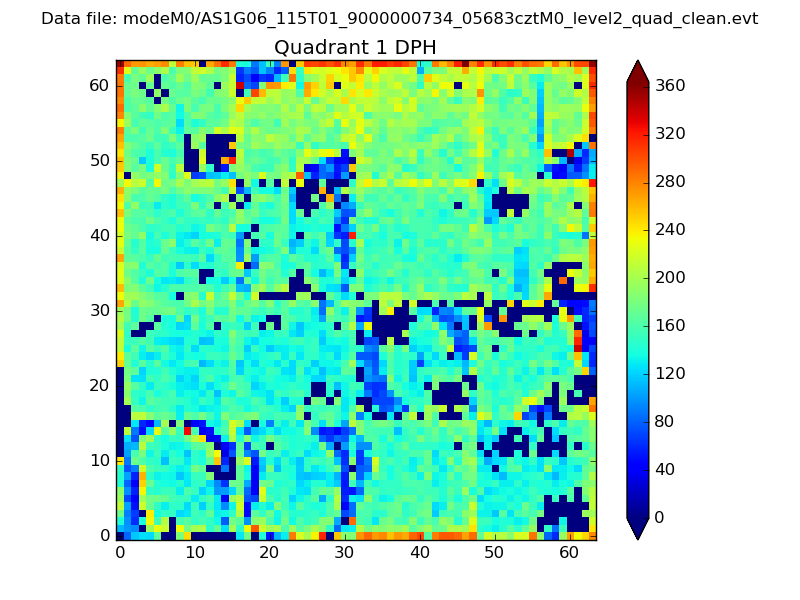 |
Quadrant B |
|---|---|---|---|
| Quadrant D | 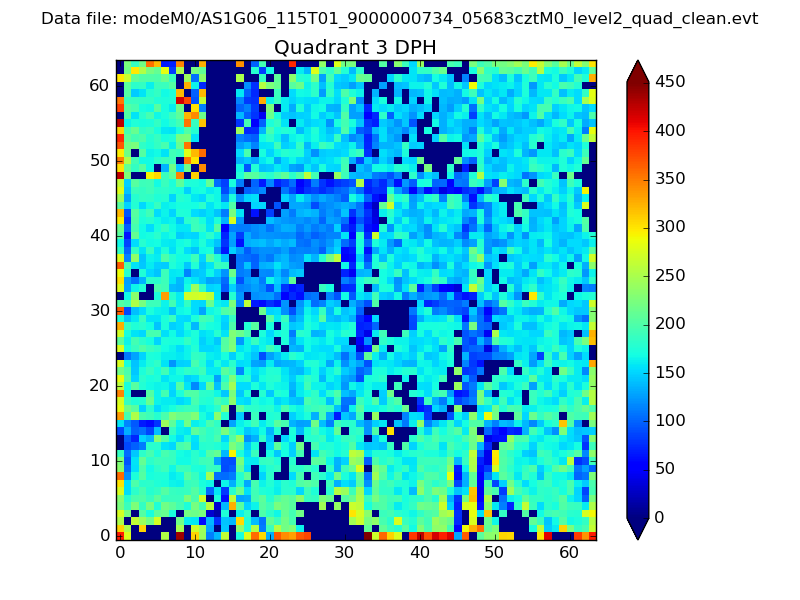 |
 |
Quadrant C |
| Plot type | Count rate plots | Images |
|---|---|---|
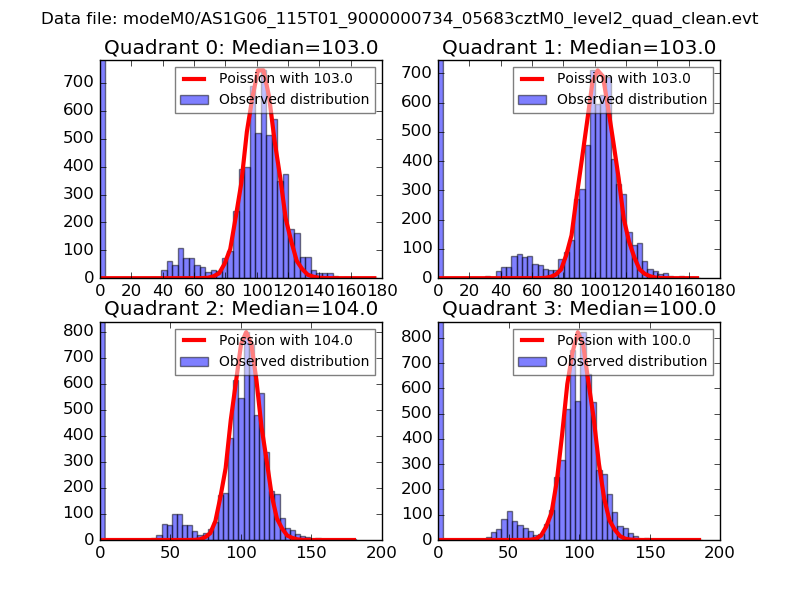
| Comparison with Poisson distribution Blue bars denote a histogram of data divided into 1 sec bins. Red curve is a Poisson curve with rate = median count rate of data. |
 |
 |
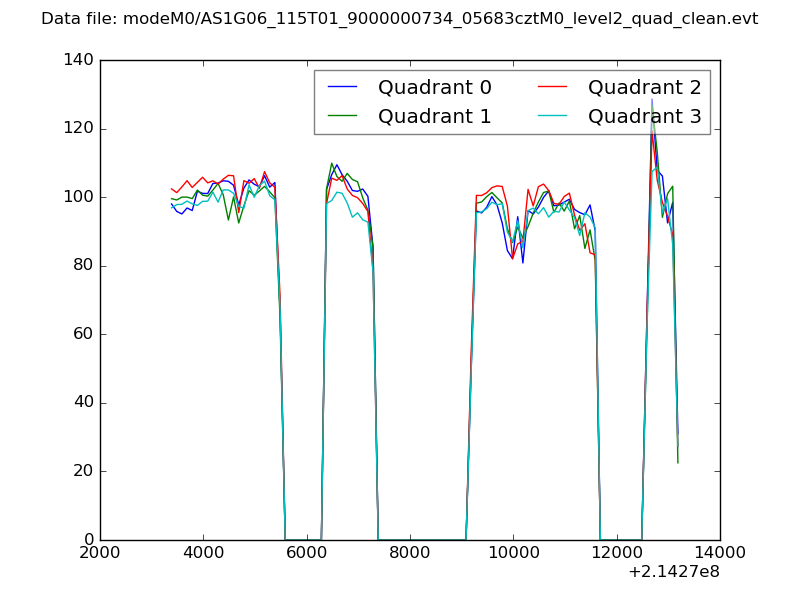
| Quadrant-wise count rates Data is divided into 100 sec bins |
 |
|
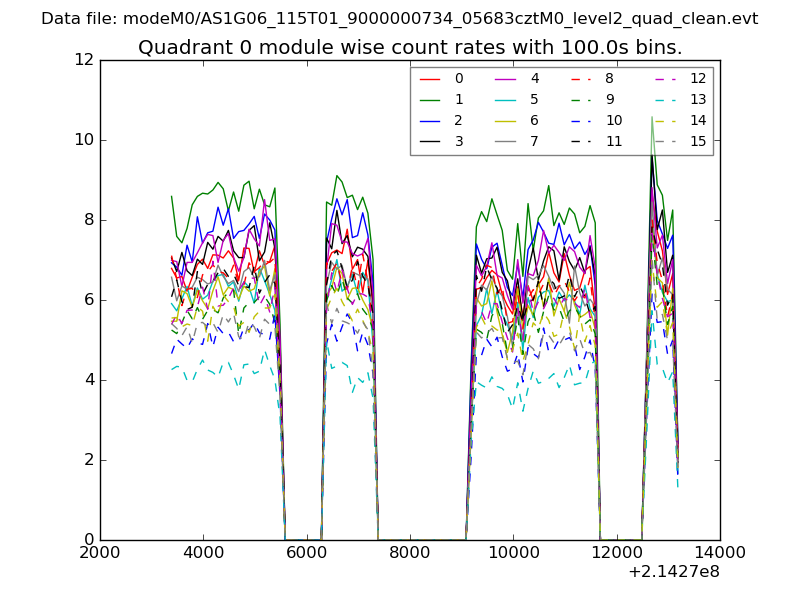
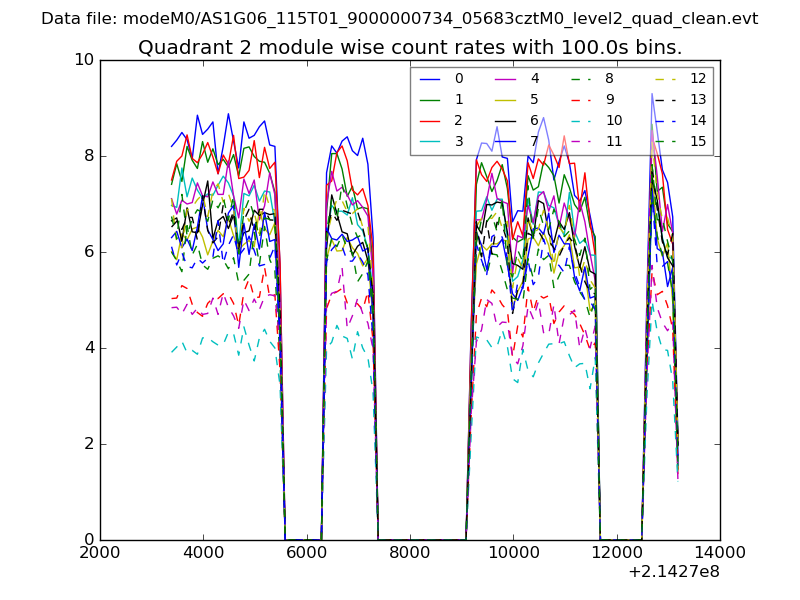
| Module-wise count rates for Quadrant A Data is divided into 100 sec bins |
 |
 |
| Module-wise count rates for Quadrant B Data is divided into 100 sec bins |
 |
 |
| Module-wise count rates for Quadrant C Data is divided into 100 sec bins |
 |
 |
| Module-wise count rates for Quadrant D Data is divided into 100 sec bins |
 |
 |
| Parameter | Plot |
|---|---|
| CZT HV Monitor | 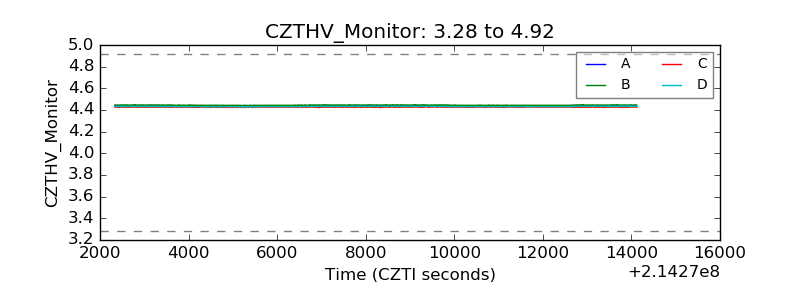 |
| D_VDD | 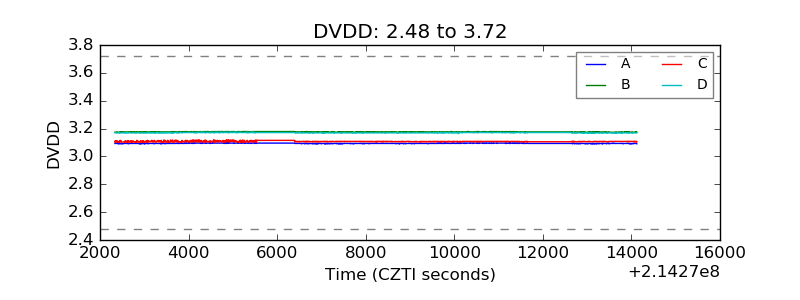 |
| Temperature 1 |  |
| Veto HV Monitor | 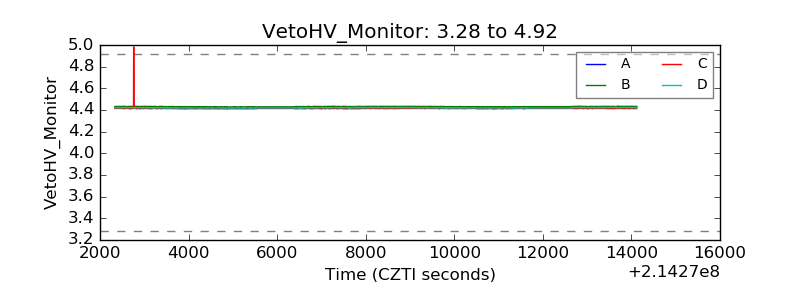 |
| Veto LLD | 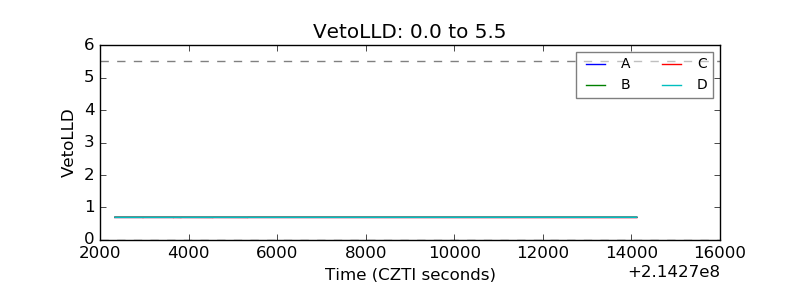 |
| Alpha Counter | 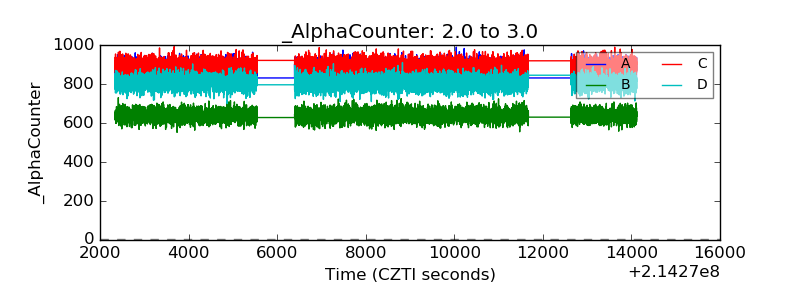 |
| _CPM_Rate | 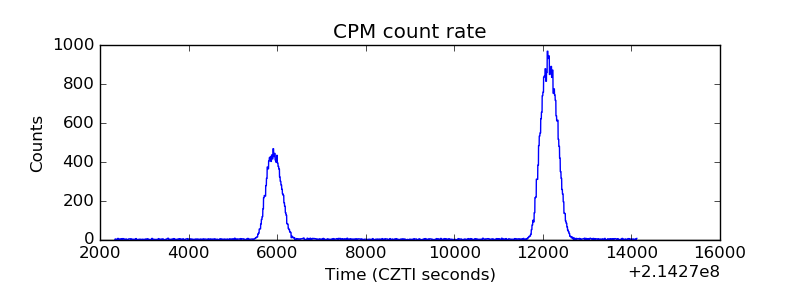 |
| CZT Counter | 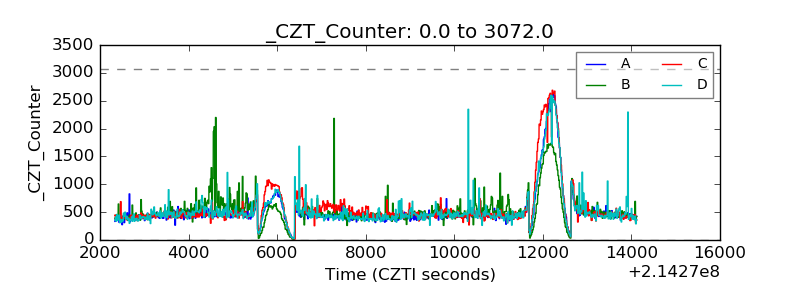 |
| +2.5 Volts monitor |  |
| +5 Volts monitor |  |
| _ROLL_ROT |  |
| _Roll_DEC | 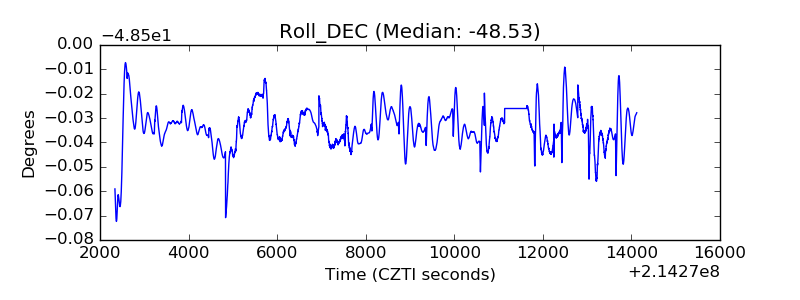 |
| _Roll_RA | 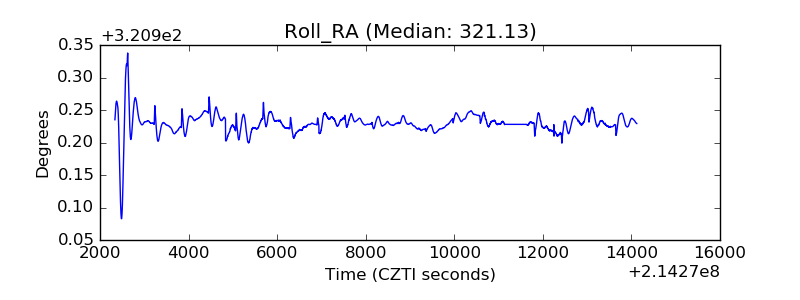 |
| Veto Counter |  |