| Param | Original file | Final file |
|---|---|---|
| Filename | modeM0/AS1G06_115T01_9000000734_05686cztM0_level2.evt | modeM0/AS1G06_115T01_9000000734_05686cztM0_level2_quad_clean.evt |
| Size (bytes) | 440,758,080 | 60,278,400 |
| Size | 420.3 MB | 57.5 MB |
| Events in quadrant A | 3,037,376 | 344,342 |
| Events in quadrant B | 3,402,340 | 346,675 |
| Events in quadrant C | 3,168,614 | 354,241 |
| Events in quadrant D | 3,310,688 | 338,729 |
| Mode M0 | |||
|---|---|---|---|
| Quadrant | BADHDUFLAG | Total packets | Discarded packets |
| A | 0 | 13138 | 12 |
| B | 0 | 13956 | 15 |
| C | 0 | 13633 | 18 |
| D | 0 | 13944 | 14 |
| Mode M9 | |||
|---|---|---|---|
| Quadrant | BADHDUFLAG | Total packets | Discarded packets |
| A | 0 | 16 | 0 |
| B | 0 | 16 | 0 |
| C | 0 | 16 | 0 |
| D | 0 | 17 | 0 |
| Mode SS | |||
|---|---|---|---|
| Quadrant | BADHDUFLAG | Total packets | Discarded packets |
| A | 0 | 128 | 0 |
| B | 0 | 128 | 0 |
| C | 0 | 128 | 0 |
| D | 0 | 128 | 0 |
| Quadrant | Total seconds | Saturated seconds | Saturation percentage |
|---|---|---|---|
| A | 6318 | 92 | 1.456157% |
| B | 6317 | 99 | 1.567200% |
| C | 6315 | 83 | 1.314331% |
| D | 6317 | 87 | 1.377236% |
Noise dominated data is calculated using 1-second bins in cleaned event files. If a bin has >2000 counts, and if more than 50% of those come from <1% of pixels, then it is considered to be noise-dominated and hence unusable.
| Quadrant | # 1 sec bins | Bins with >0 counts | Bins with >2000 counts | High rate bins dominated by noise | Noise dominated (total time) | Noise dominated (detector-on time) | Marked lightcurve |
|---|---|---|---|---|---|---|---|
| A | 7503 | 6324 | 0 | 0 | 0.00% | 0.00% | 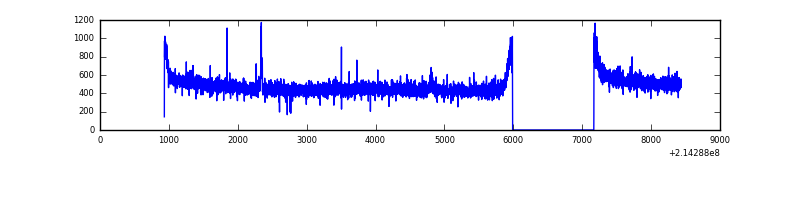 |
| B | 7503 | 6324 | 4 | 4 | 0.05% | 0.06% | 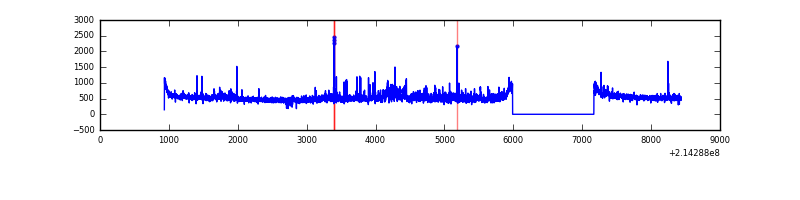 |
| C | 7503 | 6324 | 0 | 0 | 0.00% | 0.00% | 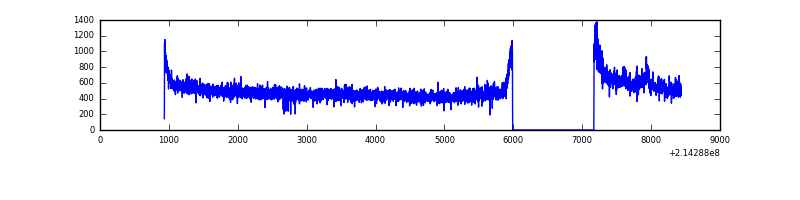 |
| D | 7503 | 6324 | 18 | 18 | 0.24% | 0.28% | 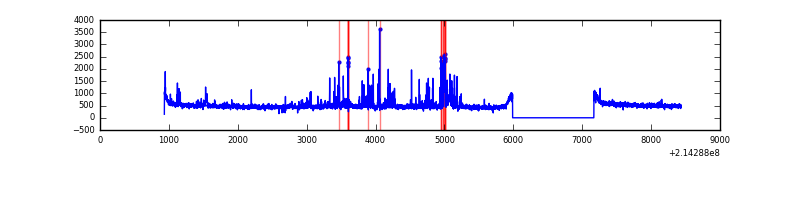 |
Top three noisy pixels from each quadrant. If the there are fewer than three noisy pixels in the level2.evt file, extra rows are filled as -1
| Pixel properties | Quadrant properties | ||||||
|---|---|---|---|---|---|---|---|
| Quadrant | DetID | PixID | Counts | Sigma | Mean | Median | Sigma |
| A | 15 | 174 | 11012 | 64.7 | 782 | 766 | 158.4 |
| A | 0 | 50 | 8185 | 46.85 | 782 | 766 | 158.4 |
| A | 12 | 194 | 7703 | 43.81 | 782 | 766 | 158.4 |
| B | 15 | 204 | 221322 | 1478.81 | 791 | 774 | 149.1 |
| B | 11 | 51 | 63718 | 422.05 | 791 | 774 | 149.1 |
| B | 4 | 81 | 35926 | 235.7 | 791 | 774 | 149.1 |
| C | 1 | 16 | 163478 | 927.86 | 770 | 773 | 175.4 |
| C | 13 | 61 | 6340 | 31.75 | 770 | 773 | 175.4 |
| C | 3 | 9 | 2126 | 7.72 | 770 | 773 | 175.4 |
| D | 9 | 102 | 149066 | 796.56 | 768 | 745 | 186.2 |
| D | 2 | 152 | 87661 | 466.79 | 768 | 745 | 186.2 |
| D | 2 | 14 | 57717 | 305.97 | 768 | 745 | 186.2 |
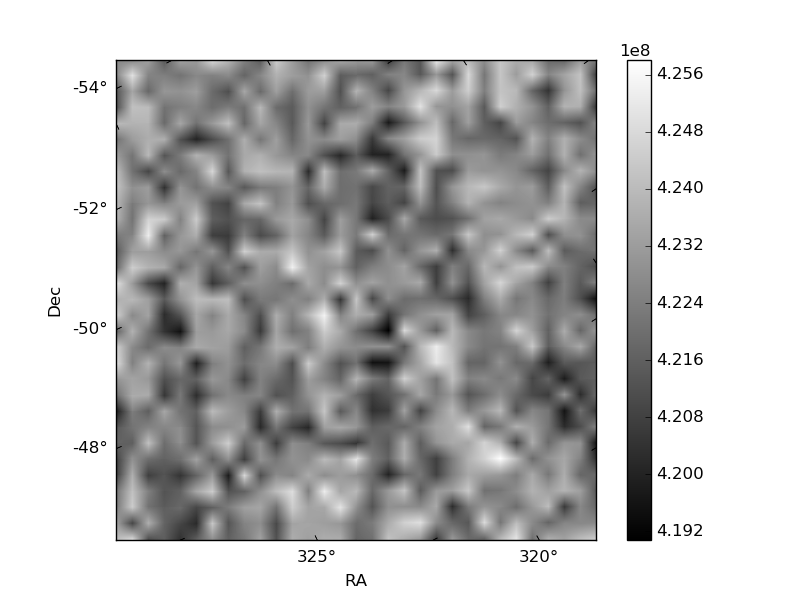
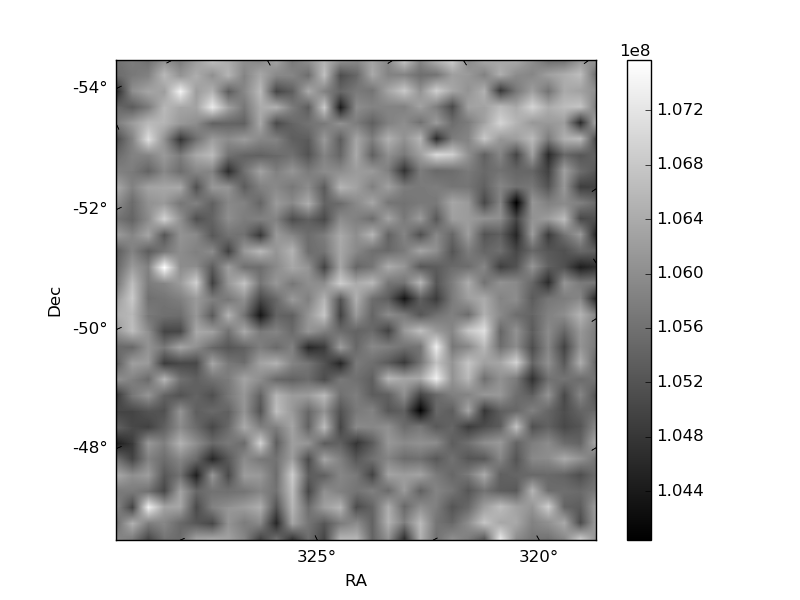
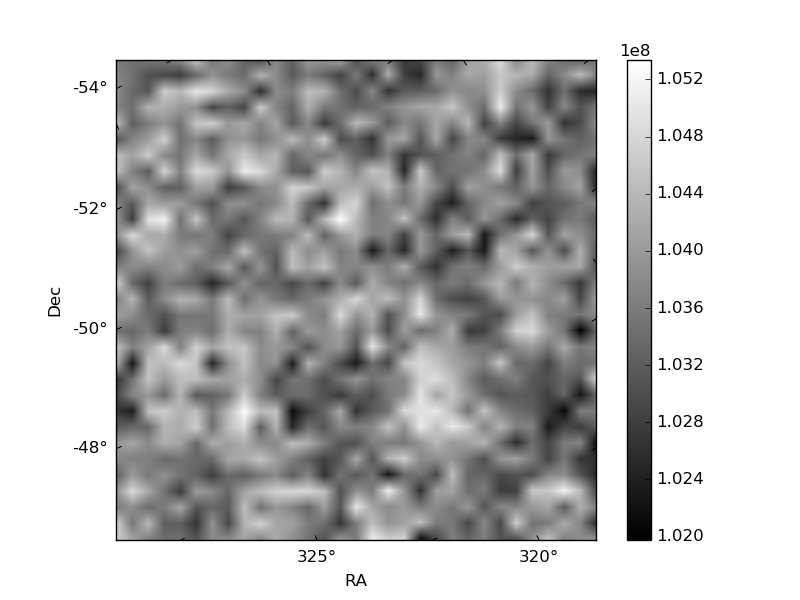
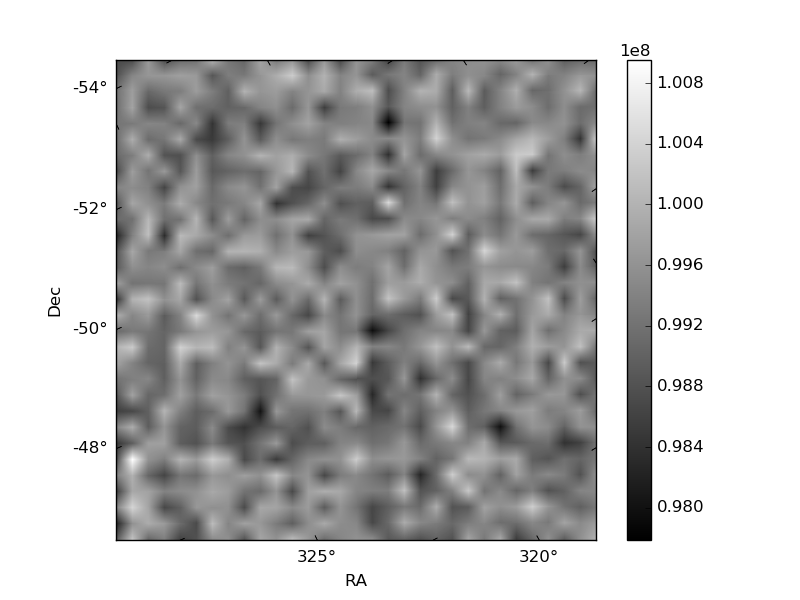
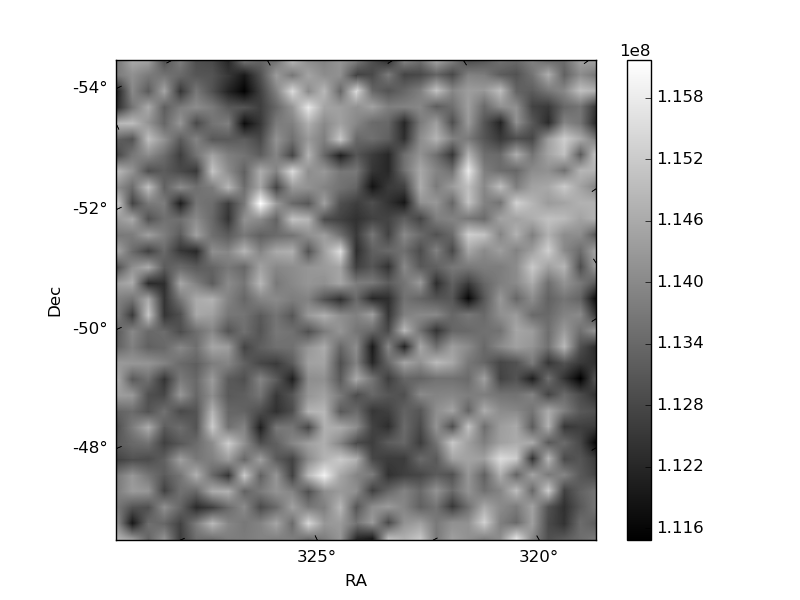
Histogram calculated using DETX and DETY for each event in the final _common_clean file
| Quadrant A | 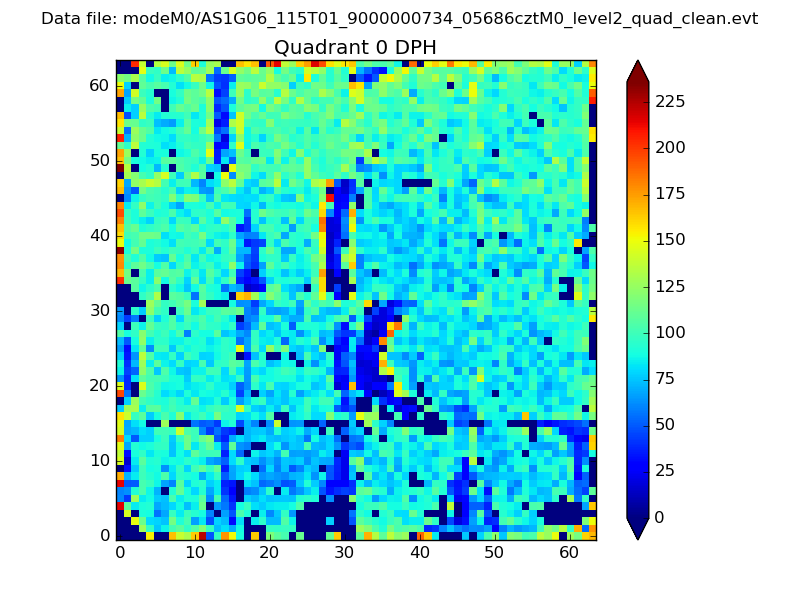 |
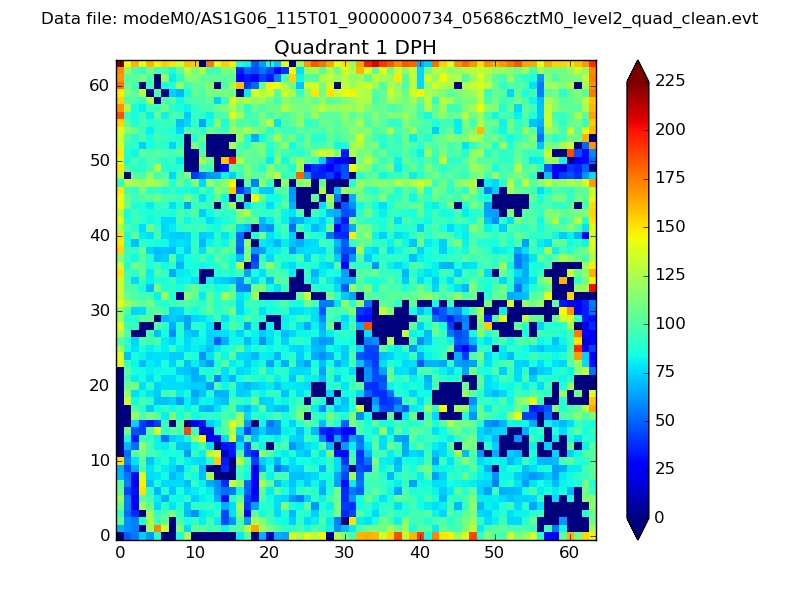 |
Quadrant B |
|---|---|---|---|
| Quadrant D | 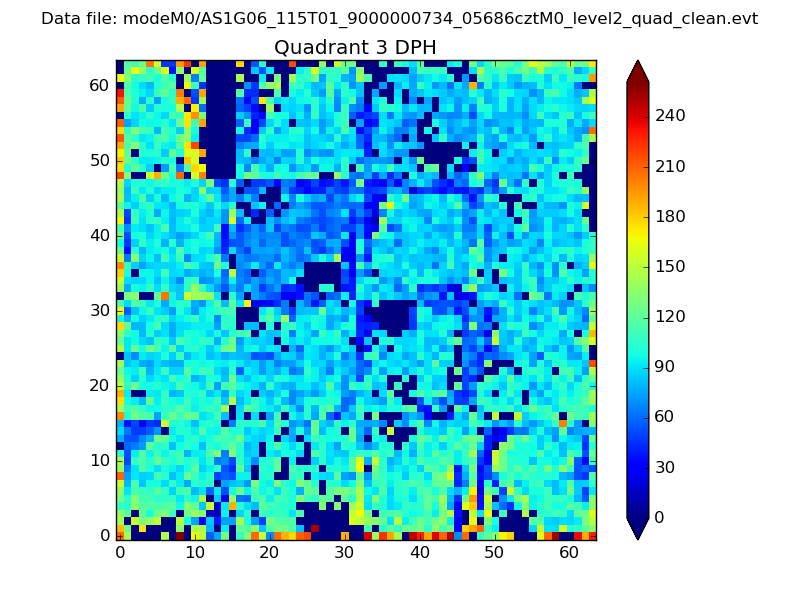 |
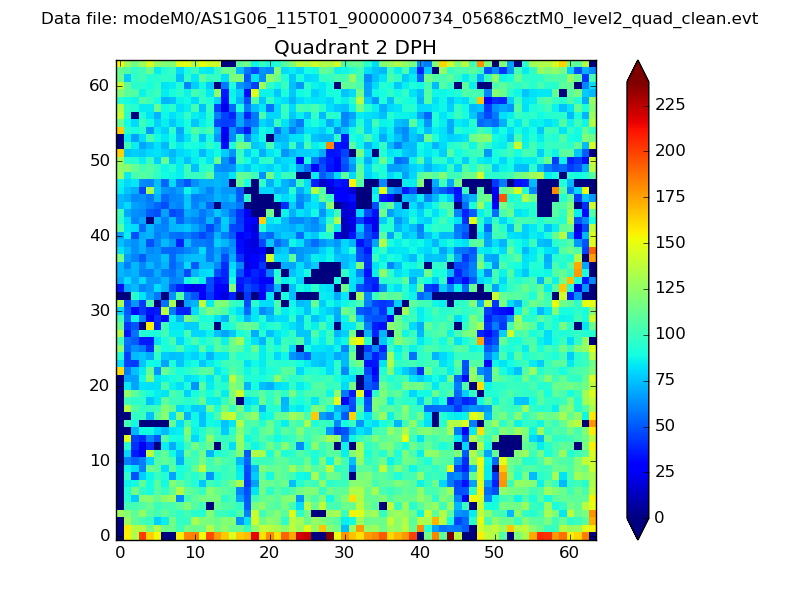 |
Quadrant C |
| Plot type | Count rate plots | Images |
|---|---|---|
| Comparison with Poisson distribution Blue bars denote a histogram of data divided into 1 sec bins. Red curve is a Poisson curve with rate = median count rate of data. |
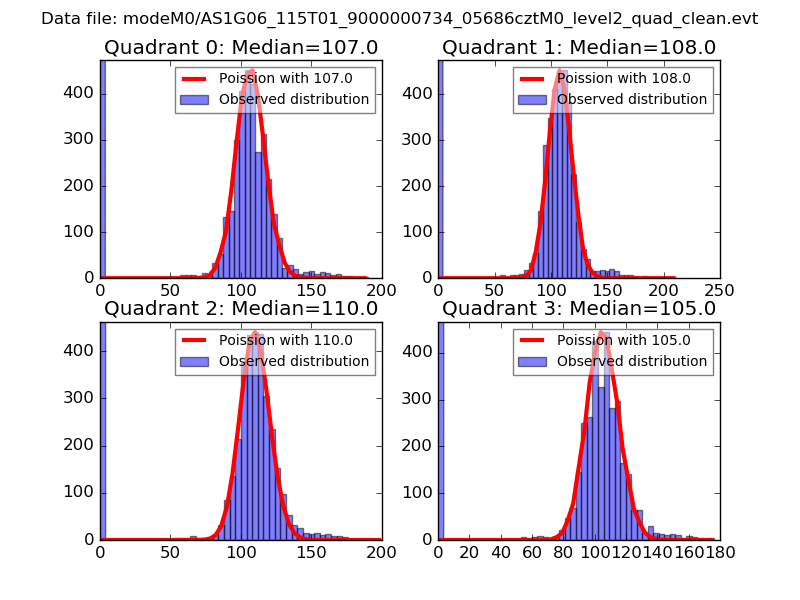 |
 |
| Quadrant-wise count rates Data is divided into 100 sec bins |
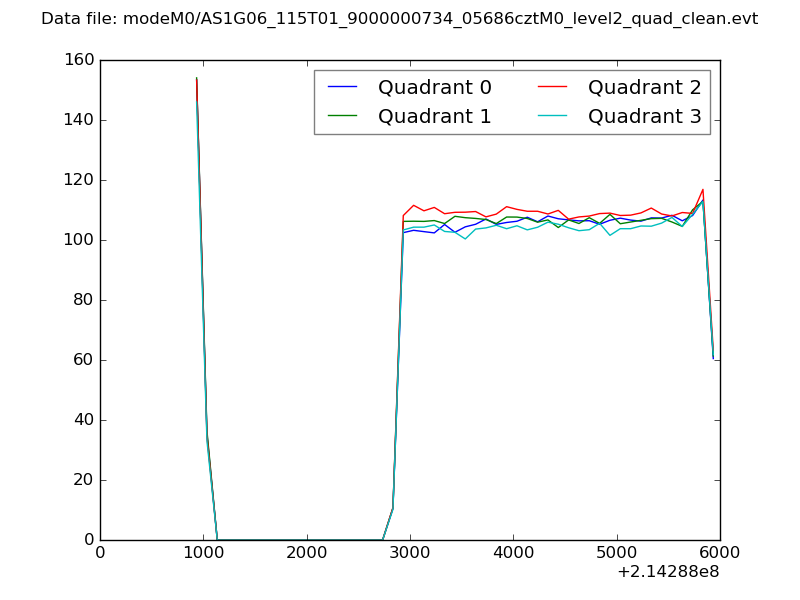 |
|
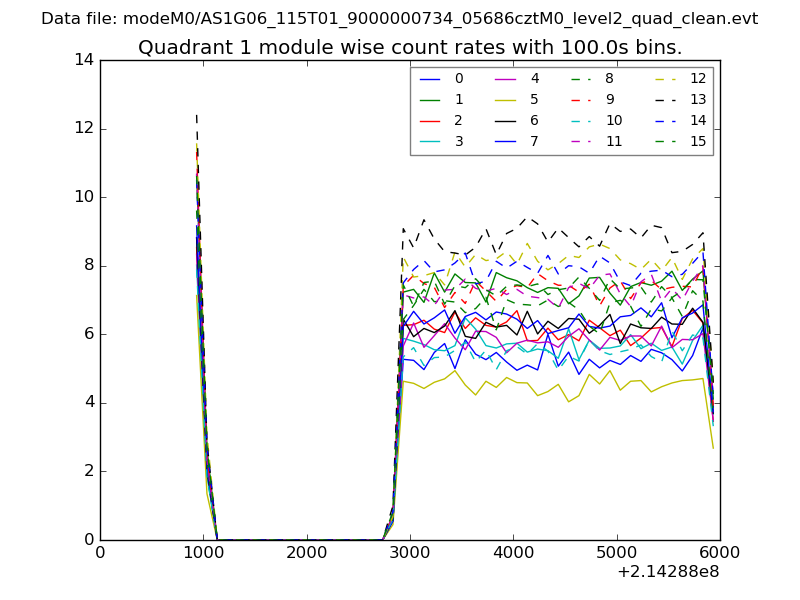
| Module-wise count rates for Quadrant A Data is divided into 100 sec bins |
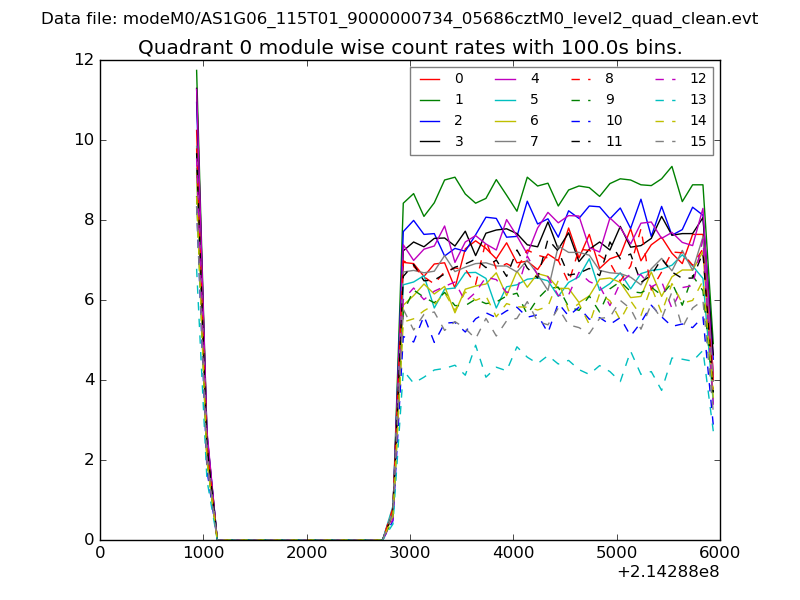 |
 |
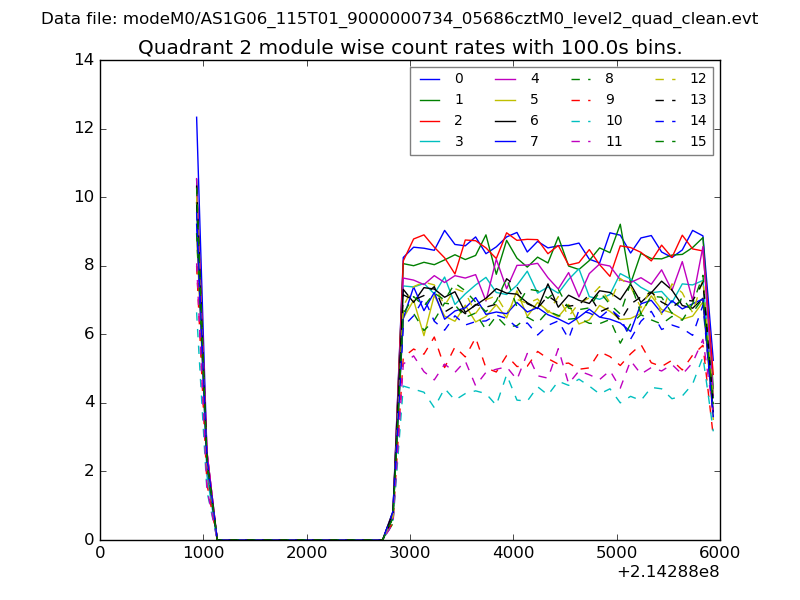
| Module-wise count rates for Quadrant B Data is divided into 100 sec bins |
 |
 |
| Module-wise count rates for Quadrant C Data is divided into 100 sec bins |
 |
 |
| Module-wise count rates for Quadrant D Data is divided into 100 sec bins |
 |
 |
| Parameter | Plot |
|---|---|
| CZT HV Monitor | 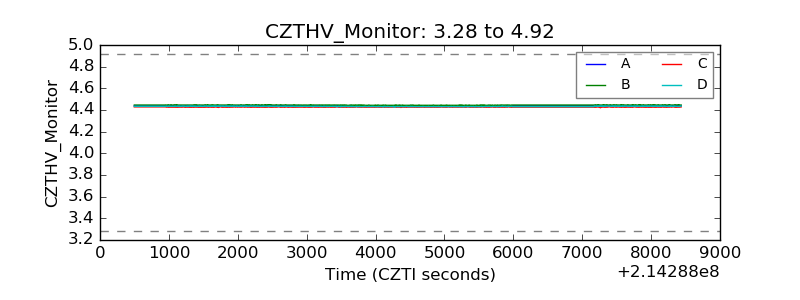 |
| D_VDD | 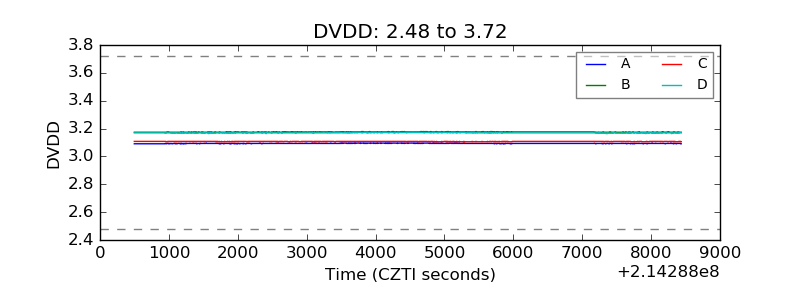 |
| Temperature 1 |  |
| Veto HV Monitor | 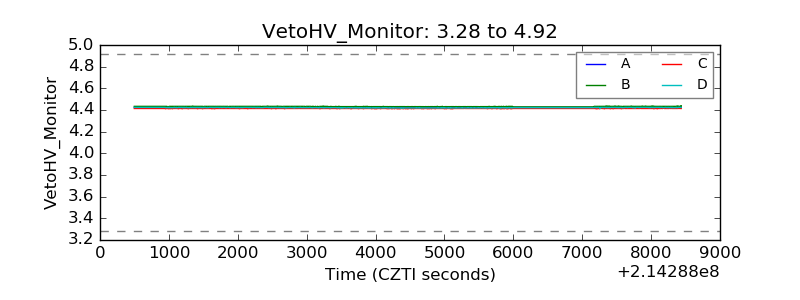 |
| Veto LLD | 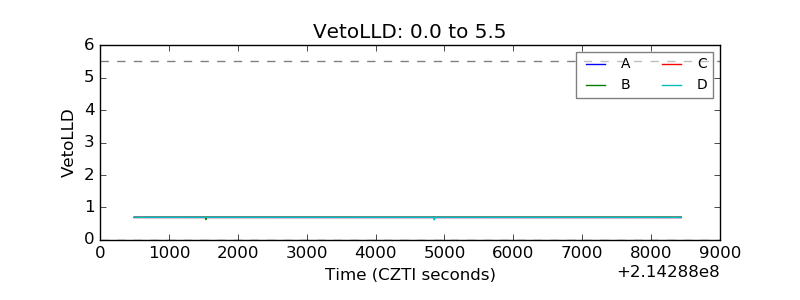 |
| Alpha Counter | 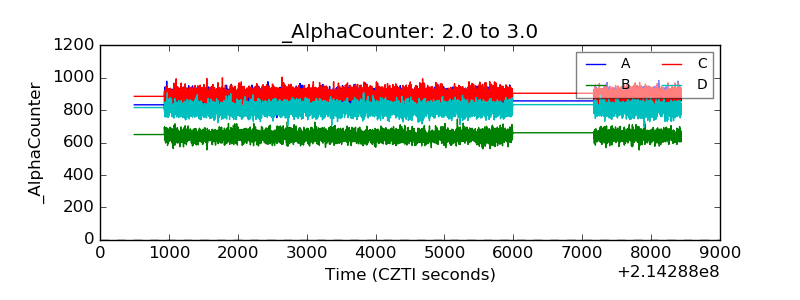 |
| _CPM_Rate | 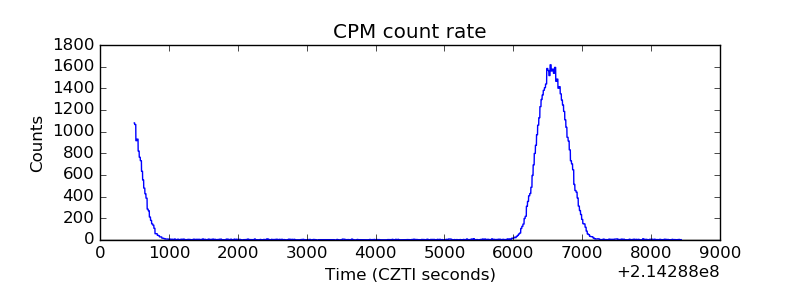 |
| CZT Counter | 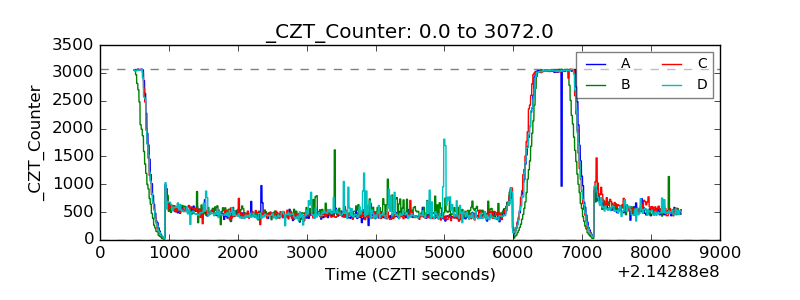 |
| +2.5 Volts monitor |  |
| +5 Volts monitor |  |
| _ROLL_ROT | 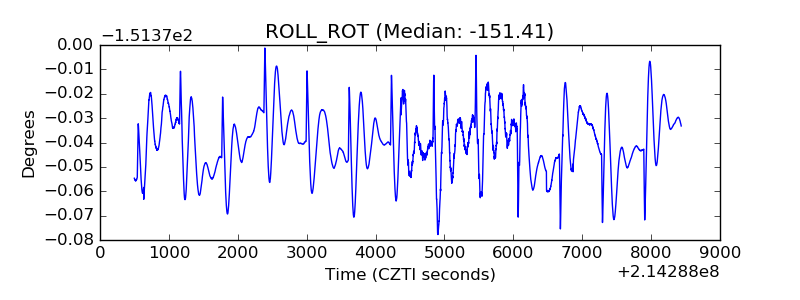 |
| _Roll_DEC |  |
| _Roll_RA | 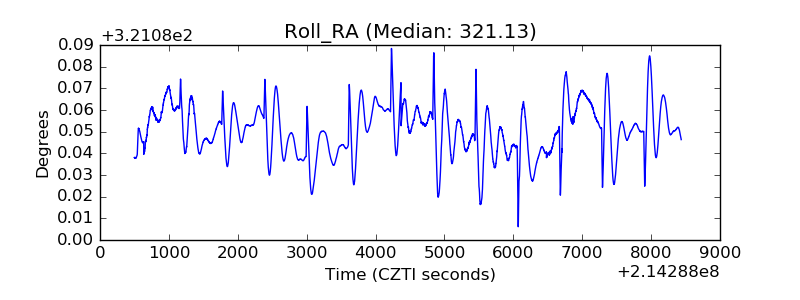 |
| Veto Counter | 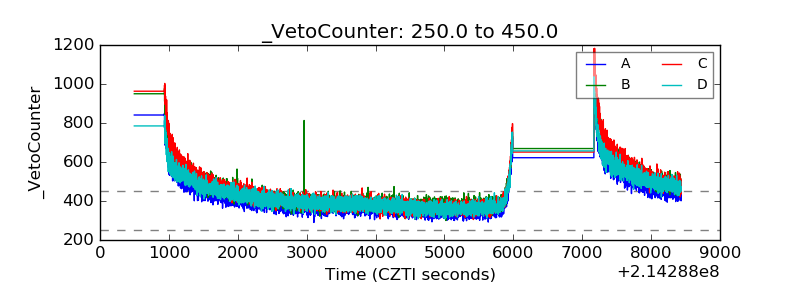 |