| Param | Original file | Final file |
|---|---|---|
| Filename | modeM0/AS1G06_115T01_9000000734_05688cztM0_level2.evt | modeM0/AS1G06_115T01_9000000734_05688cztM0_level2_quad_clean.evt |
| Size (bytes) | 441,671,040 | 80,470,080 |
| Size | 421.2 MB | 76.7 MB |
| Events in quadrant A | 3,144,611 | 497,950 |
| Events in quadrant B | 3,425,261 | 503,561 |
| Events in quadrant C | 3,157,949 | 506,007 |
| Events in quadrant D | 3,217,936 | 487,668 |
| Mode M0 | |||
|---|---|---|---|
| Quadrant | BADHDUFLAG | Total packets | Discarded packets |
| A | 0 | 13290 | 5 |
| B | 0 | 14003 | 2 |
| C | 0 | 13482 | 4 |
| D | 0 | 13669 | 2 |
| Mode M9 | |||
|---|---|---|---|
| Quadrant | BADHDUFLAG | Total packets | Discarded packets |
| A | 0 | 17 | 0 |
| B | 0 | 17 | 0 |
| C | 0 | 17 | 0 |
| D | 0 | 18 | 0 |
| Mode SS | |||
|---|---|---|---|
| Quadrant | BADHDUFLAG | Total packets | Discarded packets |
| A | 0 | 130 | 0 |
| B | 0 | 130 | 0 |
| C | 0 | 130 | 0 |
| D | 0 | 130 | 0 |
| Quadrant | Total seconds | Saturated seconds | Saturation percentage |
|---|---|---|---|
| A | 6324 | 111 | 1.755218% |
| B | 6325 | 134 | 2.118577% |
| C | 6324 | 95 | 1.502214% |
| D | 6325 | 103 | 1.628458% |
Noise dominated data is calculated using 1-second bins in cleaned event files. If a bin has >2000 counts, and if more than 50% of those come from <1% of pixels, then it is considered to be noise-dominated and hence unusable.
| Quadrant | # 1 sec bins | Bins with >0 counts | Bins with >2000 counts | High rate bins dominated by noise | Noise dominated (total time) | Noise dominated (detector-on time) | Marked lightcurve |
|---|---|---|---|---|---|---|---|
| A | 7575 | 6326 | 0 | 0 | 0.00% | 0.00% | 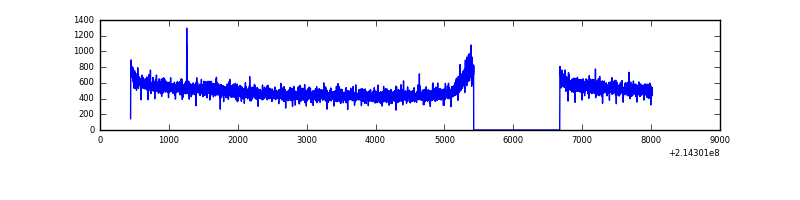 |
| B | 7575 | 6326 | 17 | 17 | 0.22% | 0.27% | 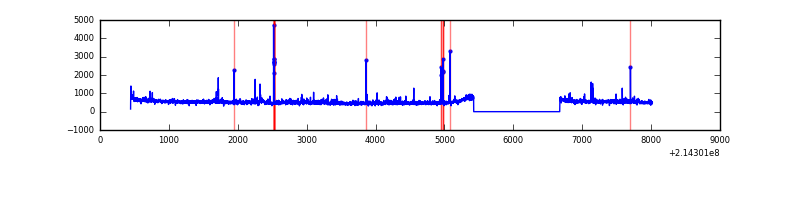 |
| C | 7575 | 6325 | 0 | 0 | 0.00% | 0.00% | 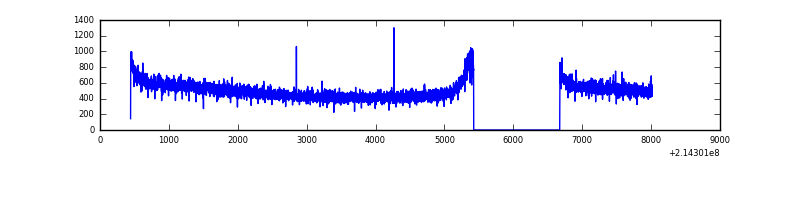 |
| D | 7575 | 6326 | 11 | 11 | 0.15% | 0.17% | 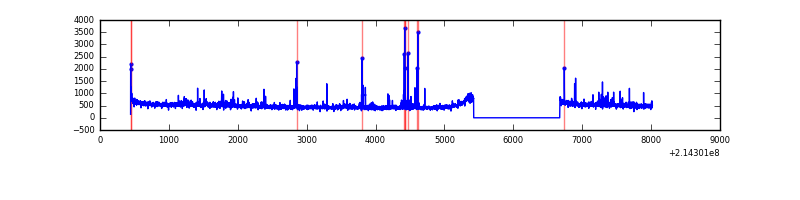 |
Top three noisy pixels from each quadrant. If the there are fewer than three noisy pixels in the level2.evt file, extra rows are filled as -1
| Pixel properties | Quadrant properties | ||||||
|---|---|---|---|---|---|---|---|
| Quadrant | DetID | PixID | Counts | Sigma | Mean | Median | Sigma |
| A | 13 | 6 | 8234 | 45.68 | 812 | 794 | 162.9 |
| A | 12 | 194 | 8188 | 45.4 | 812 | 794 | 162.9 |
| A | 0 | 226 | 7960 | 44.0 | 812 | 794 | 162.9 |
| B | 11 | 51 | 94013 | 612.14 | 813 | 797 | 152.3 |
| B | 15 | 204 | 51137 | 330.58 | 813 | 797 | 152.3 |
| B | 0 | 214 | 30763 | 196.78 | 813 | 797 | 152.3 |
| C | 1 | 16 | 78723 | 437.6 | 787 | 792 | 178.1 |
| C | 13 | 61 | 6337 | 31.14 | 787 | 792 | 178.1 |
| C | 12 | 4 | 3669 | 16.15 | 787 | 792 | 178.1 |
| D | 2 | 152 | 101620 | 527.04 | 792 | 769 | 191.4 |
| D | 2 | 14 | 38049 | 194.82 | 792 | 769 | 191.4 |
| D | 2 | 136 | 27399 | 139.17 | 792 | 769 | 191.4 |
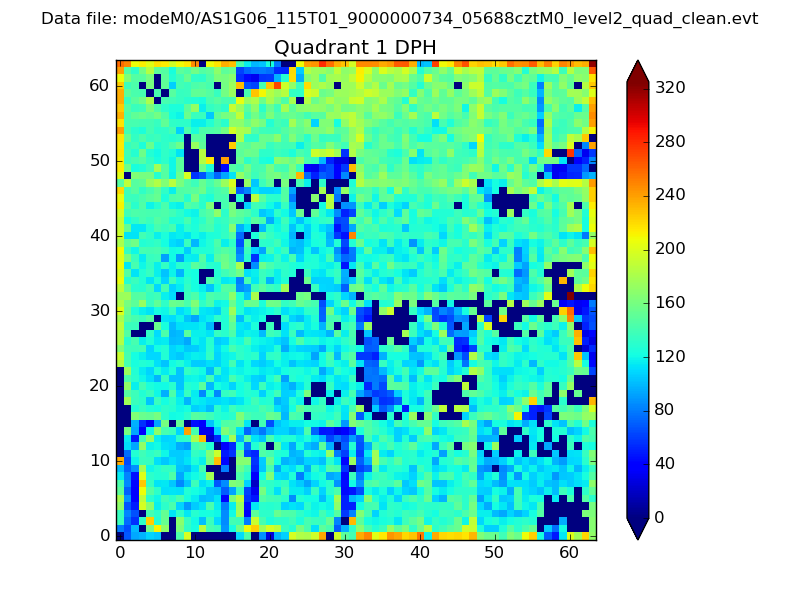
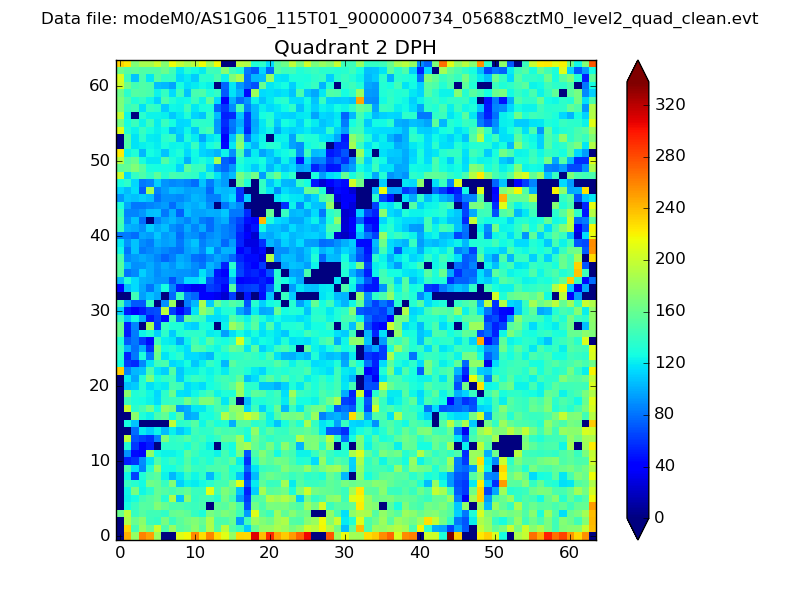
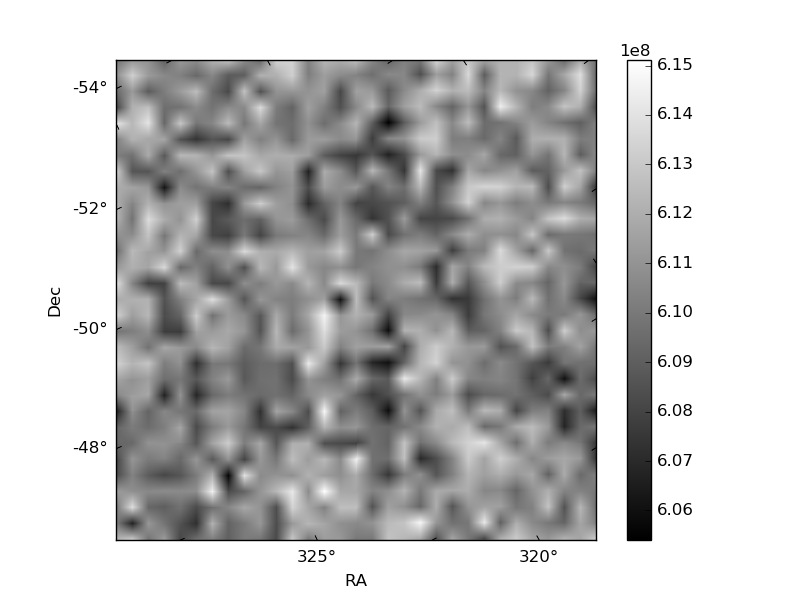
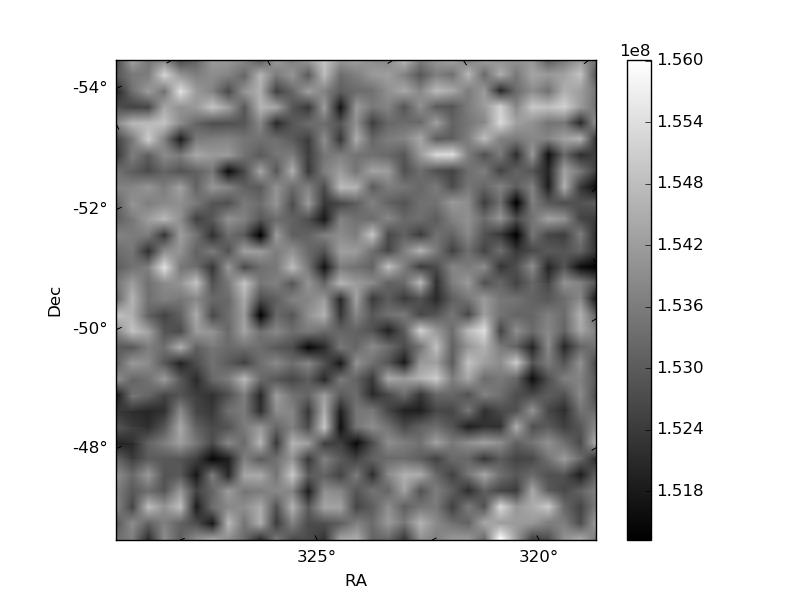
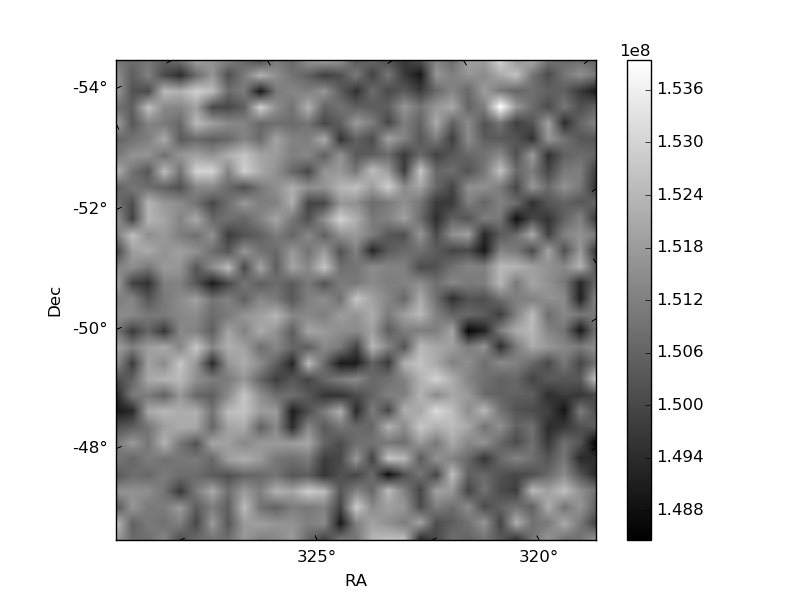
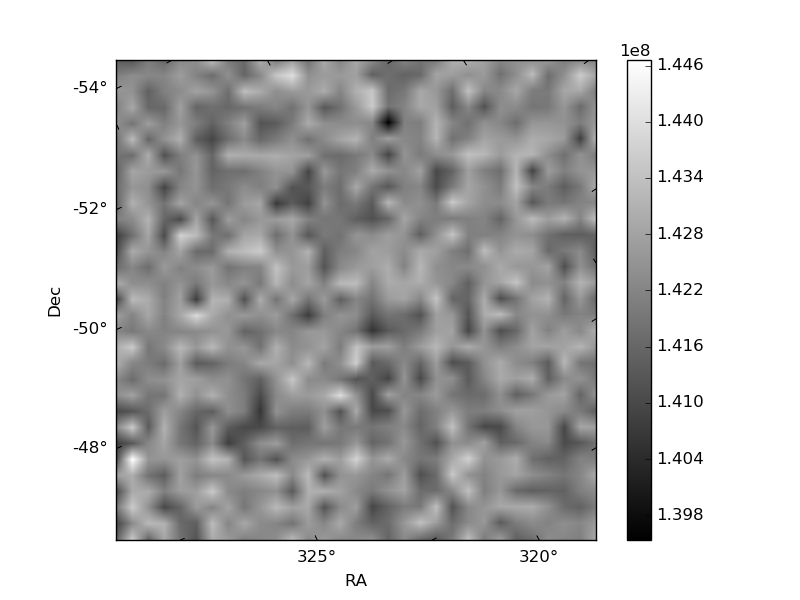
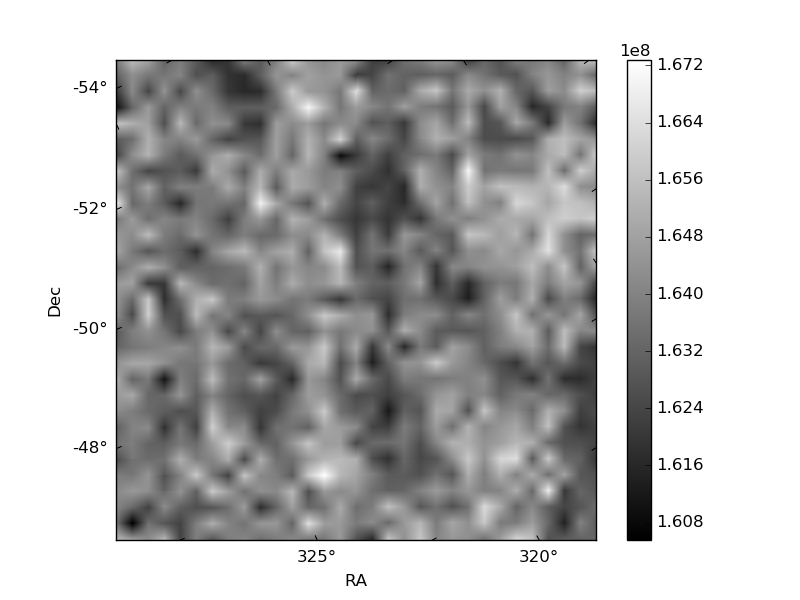
Histogram calculated using DETX and DETY for each event in the final _common_clean file
| Quadrant A |  |
 |
Quadrant B |
|---|---|---|---|
| Quadrant D | 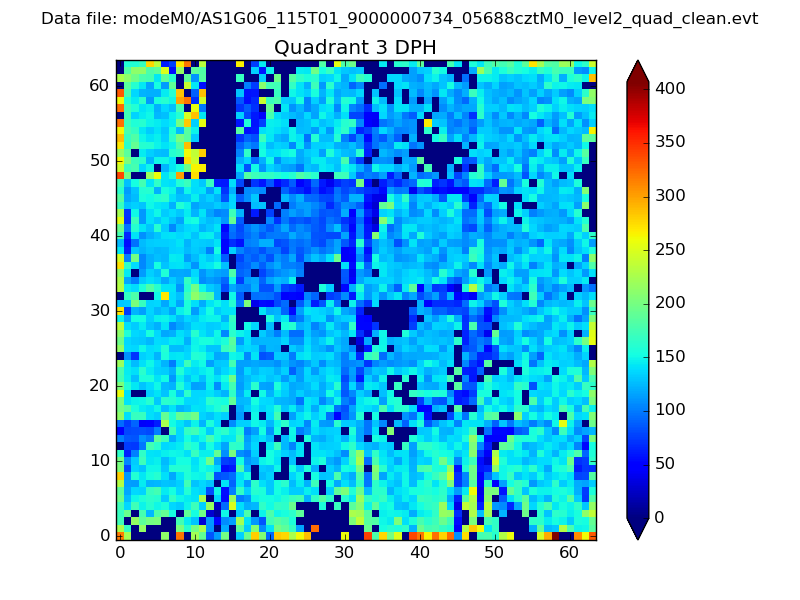 |
 |
Quadrant C |
| Plot type | Count rate plots | Images |
|---|---|---|
| Comparison with Poisson distribution Blue bars denote a histogram of data divided into 1 sec bins. Red curve is a Poisson curve with rate = median count rate of data. |
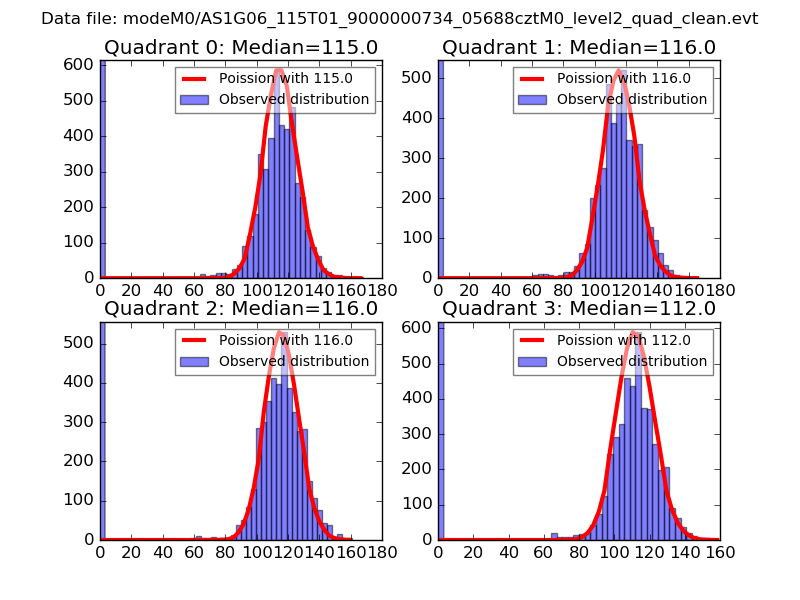 |
 |
| Quadrant-wise count rates Data is divided into 100 sec bins |
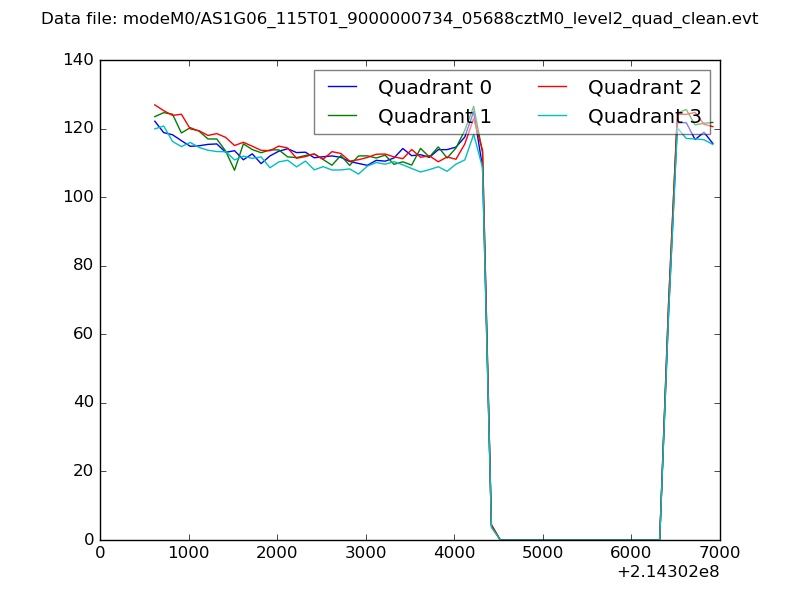 |
|
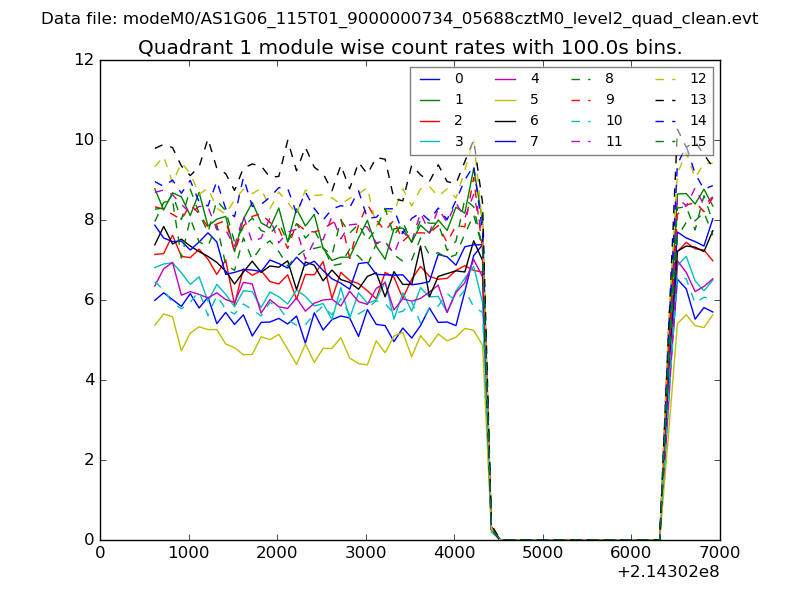
| Module-wise count rates for Quadrant A Data is divided into 100 sec bins |
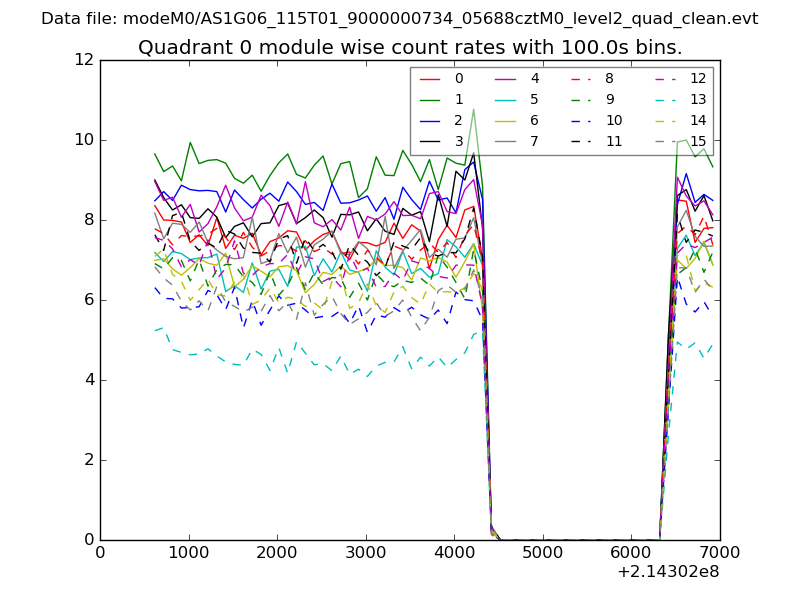 |
 |
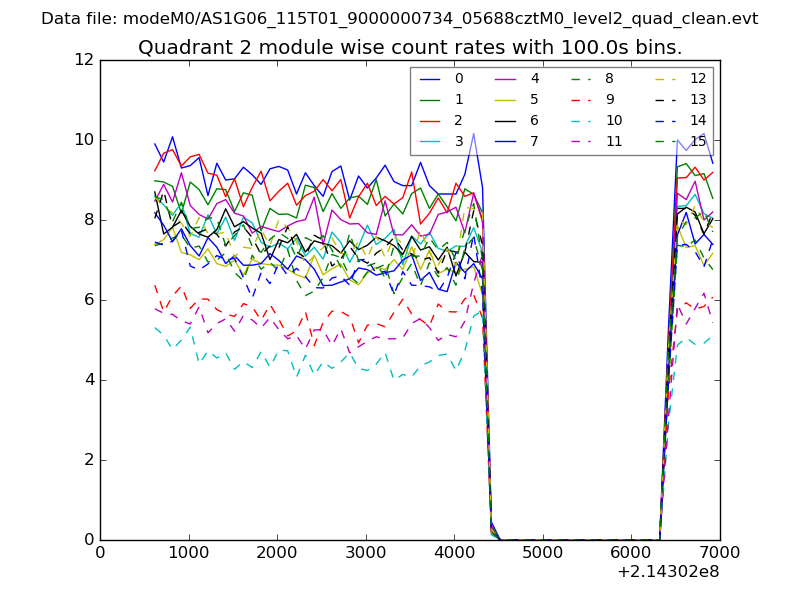
| Module-wise count rates for Quadrant B Data is divided into 100 sec bins |
 |
 |
| Module-wise count rates for Quadrant C Data is divided into 100 sec bins |
 |
 |
| Module-wise count rates for Quadrant D Data is divided into 100 sec bins |
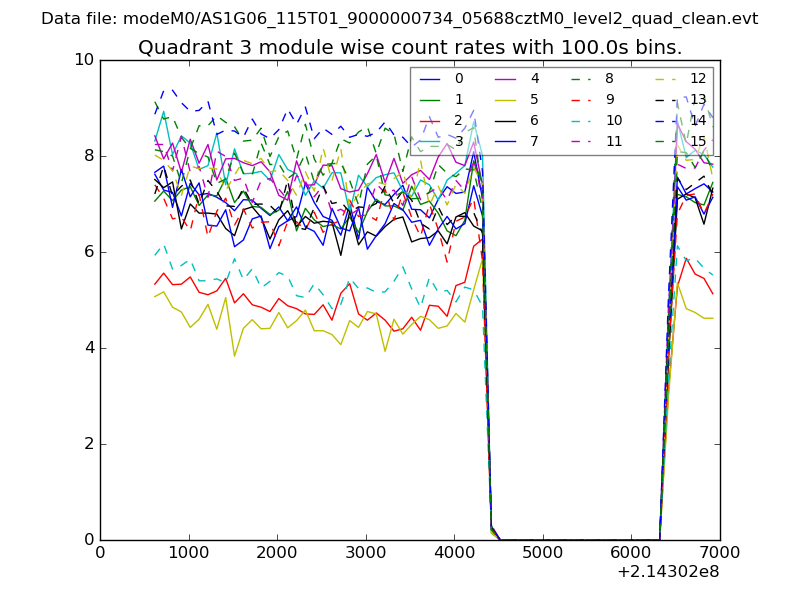 |
 |
| Parameter | Plot |
|---|---|
| CZT HV Monitor | 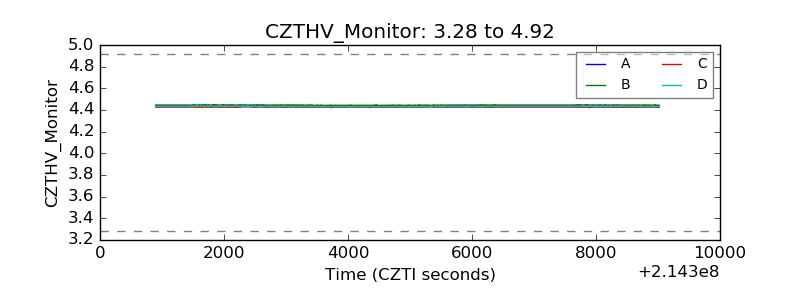 |
| D_VDD | 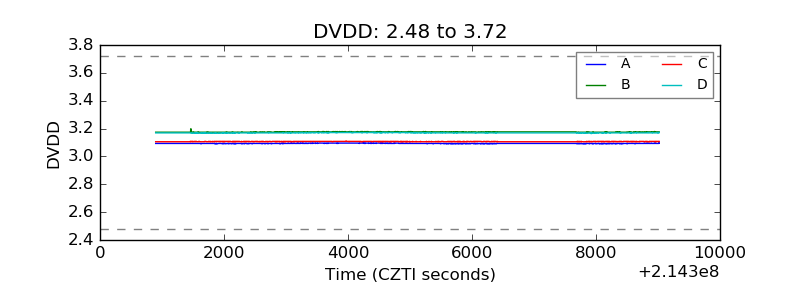 |
| Temperature 1 | 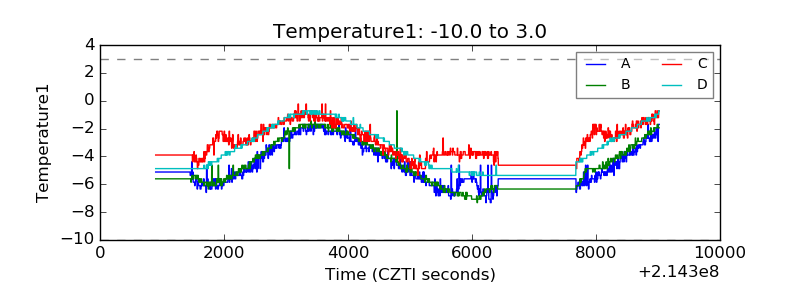 |
| Veto HV Monitor | 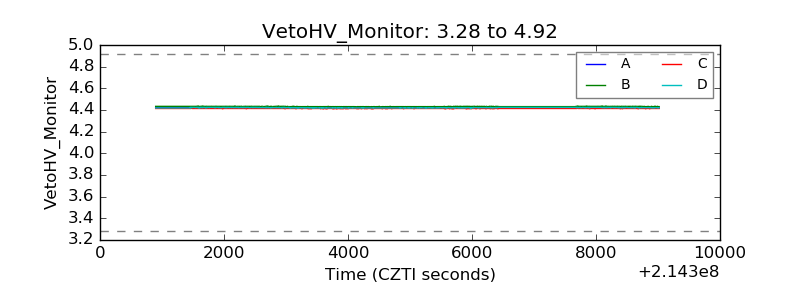 |
| Veto LLD | 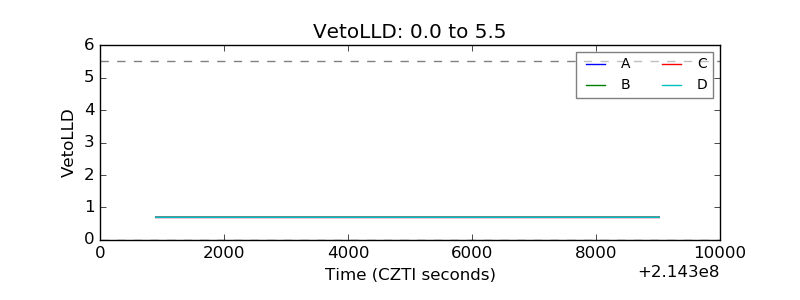 |
| Alpha Counter | 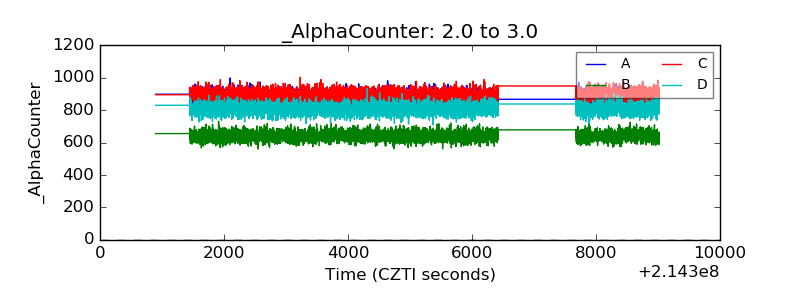 |
| _CPM_Rate | 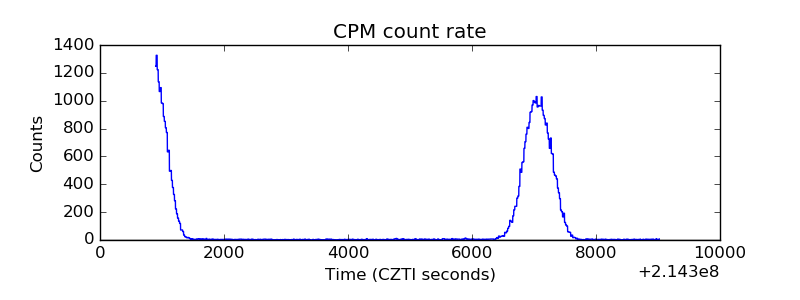 |
| CZT Counter | 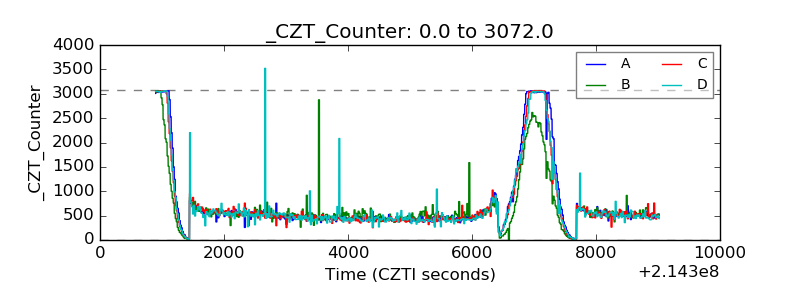 |
| +2.5 Volts monitor | 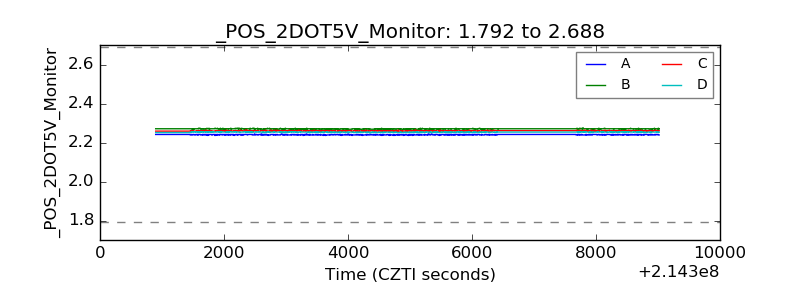 |
| +5 Volts monitor |  |
| _ROLL_ROT | 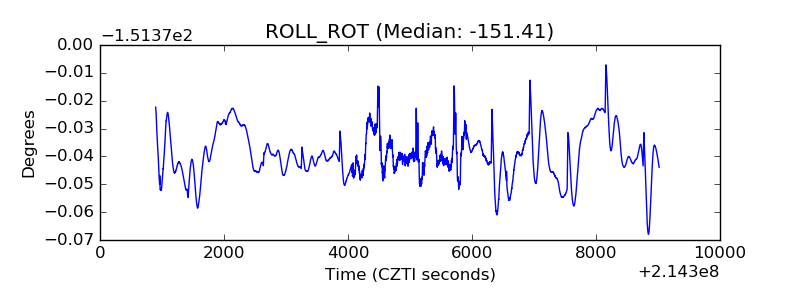 |
| _Roll_DEC | 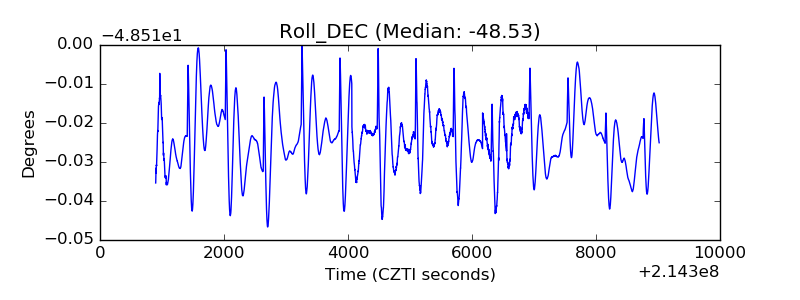 |
| _Roll_RA | 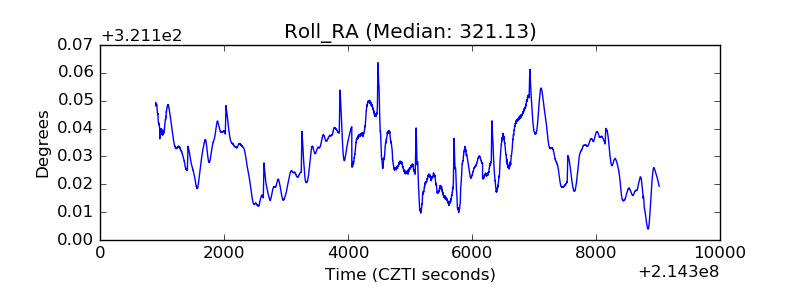 |
| Veto Counter | 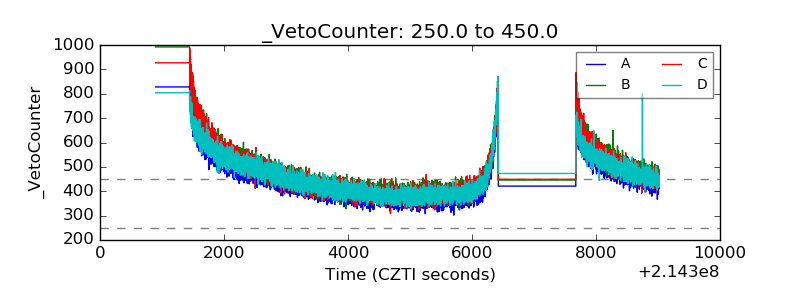 |