| Param | Original file | Final file |
|---|---|---|
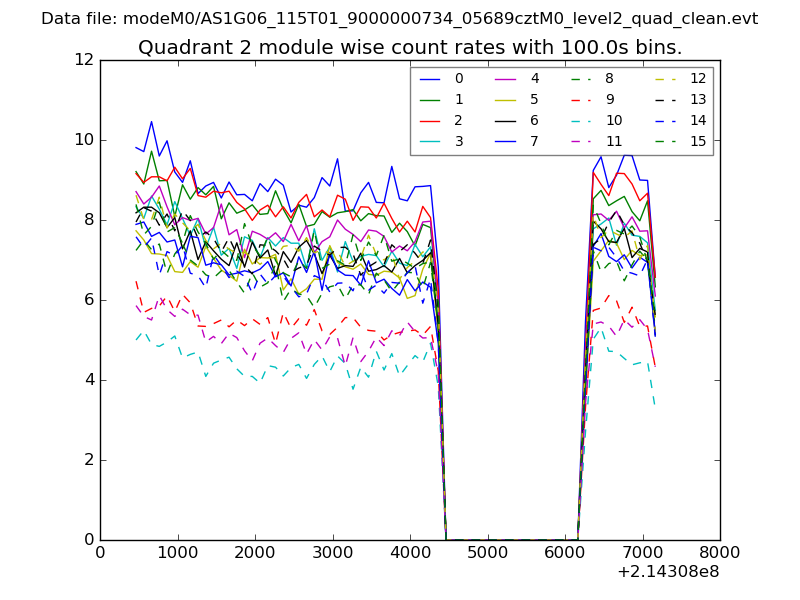
| Filename | modeM0/AS1G06_115T01_9000000734_05689cztM0_level2.evt | modeM0/AS1G06_115T01_9000000734_05689cztM0_level2_quad_clean.evt |
| Size (bytes) | 446,261,760 | 87,174,720 |
| Size | 425.6 MB | 83.1 MB |
| Events in quadrant A | 3,095,834 | 550,608 |
| Events in quadrant B | 3,467,683 | 554,487 |
| Events in quadrant C | 3,250,500 | 553,832 |
| Events in quadrant D | 3,267,126 | 535,753 |
| Mode M0 | |||
|---|---|---|---|
| Quadrant | BADHDUFLAG | Total packets | Discarded packets |
| A | 0 | 13354 | 8 |
| B | 0 | 14370 | 8 |
| C | 0 | 13722 | 9 |
| D | 0 | 13920 | 4 |
| Mode M9 | |||
|---|---|---|---|
| Quadrant | BADHDUFLAG | Total packets | Discarded packets |
| A | 0 | 12 | 0 |
| B | 0 | 12 | 0 |
| C | 0 | 12 | 0 |
| D | 0 | 13 | 0 |
| Mode SS | |||
|---|---|---|---|
| Quadrant | BADHDUFLAG | Total packets | Discarded packets |
| A | 0 | 130 | 0 |
| B | 0 | 130 | 0 |
| C | 0 | 130 | 0 |
| D | 0 | 130 | 0 |
| Quadrant | Total seconds | Saturated seconds | Saturation percentage |
|---|---|---|---|
| A | 6380 | 123 | 1.927900% |
| B | 6380 | 166 | 2.601881% |
| C | 6380 | 97 | 1.520376% |
| D | 6382 | 142 | 2.225008% |
Noise dominated data is calculated using 1-second bins in cleaned event files. If a bin has >2000 counts, and if more than 50% of those come from <1% of pixels, then it is considered to be noise-dominated and hence unusable.
| Quadrant | # 1 sec bins | Bins with >0 counts | Bins with >2000 counts | High rate bins dominated by noise | Noise dominated (total time) | Noise dominated (detector-on time) | Marked lightcurve |
|---|---|---|---|---|---|---|---|
| A | 7568 | 6382 | 4 | 4 | 0.05% | 0.06% | 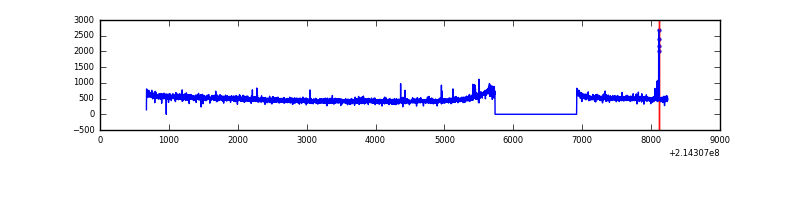 |
| B | 7568 | 6384 | 13 | 13 | 0.17% | 0.20% | 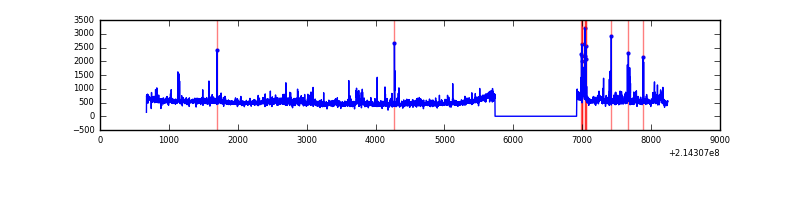 |
| C | 7568 | 6384 | 0 | 0 | 0.00% | 0.00% | 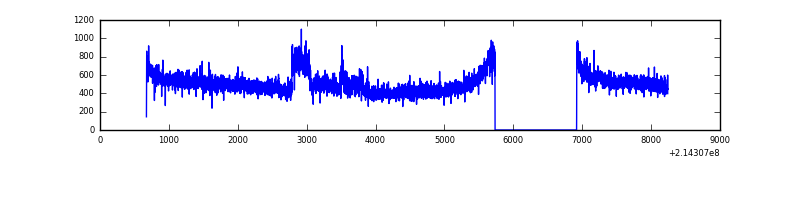 |
| D | 7568 | 6384 | 20 | 20 | 0.26% | 0.31% | 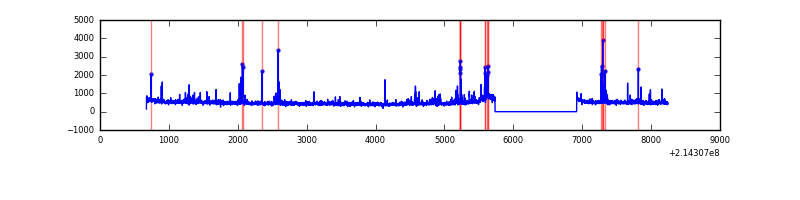 |
Top three noisy pixels from each quadrant. If the there are fewer than three noisy pixels in the level2.evt file, extra rows are filled as -1
| Pixel properties | Quadrant properties | ||||||
|---|---|---|---|---|---|---|---|
| Quadrant | DetID | PixID | Counts | Sigma | Mean | Median | Sigma |
| A | 0 | 50 | 16392 | 97.75 | 794 | 776 | 159.8 |
| A | 15 | 174 | 9326 | 53.52 | 794 | 776 | 159.8 |
| A | 12 | 194 | 7918 | 44.71 | 794 | 776 | 159.8 |
| B | 11 | 51 | 115652 | 763.23 | 796 | 778 | 150.5 |
| B | 4 | 81 | 114381 | 754.79 | 796 | 778 | 150.5 |
| B | 15 | 204 | 65930 | 432.88 | 796 | 778 | 150.5 |
| C | 1 | 16 | 257090 | 1473.28 | 765 | 768 | 174.0 |
| C | 13 | 61 | 6320 | 31.91 | 765 | 768 | 174.0 |
| C | 12 | 4 | 2819 | 11.79 | 765 | 768 | 174.0 |
| D | 2 | 152 | 148257 | 790.65 | 772 | 749 | 186.6 |
| D | 8 | 195 | 66623 | 353.09 | 772 | 749 | 186.6 |
| D | 2 | 136 | 59765 | 316.33 | 772 | 749 | 186.6 |
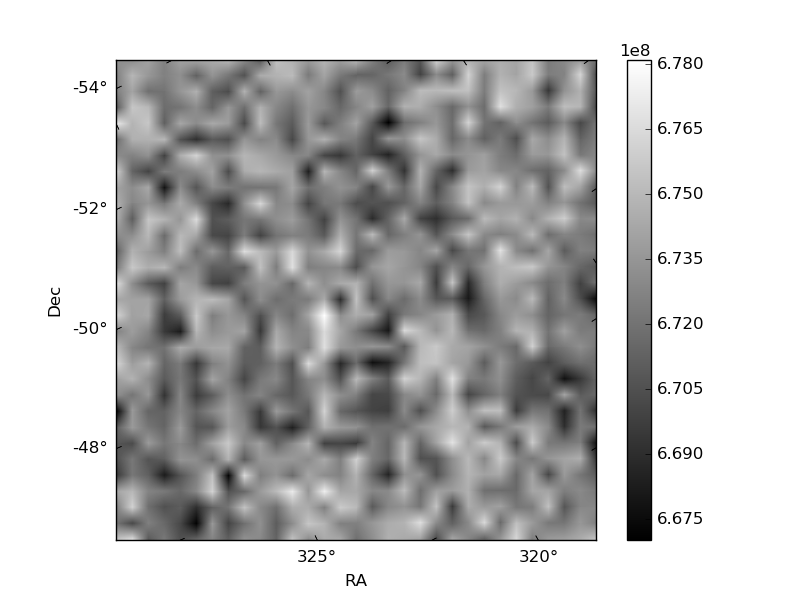
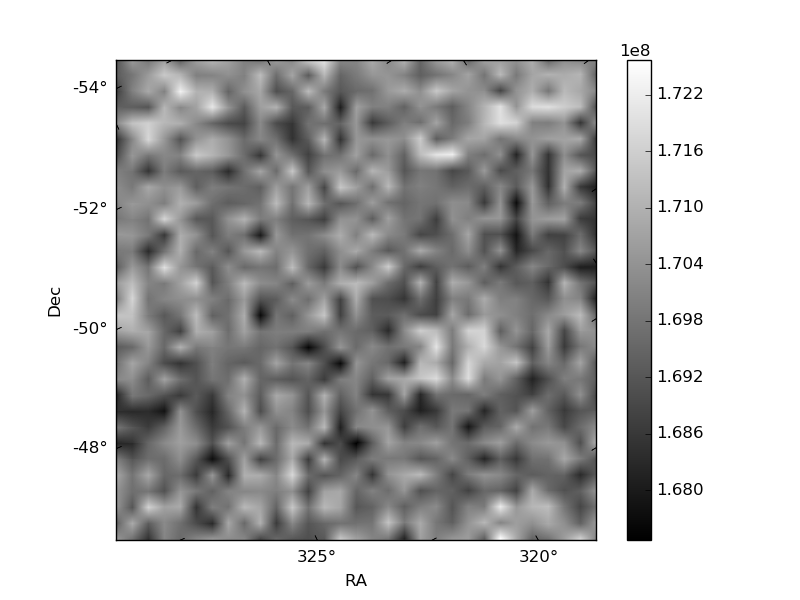
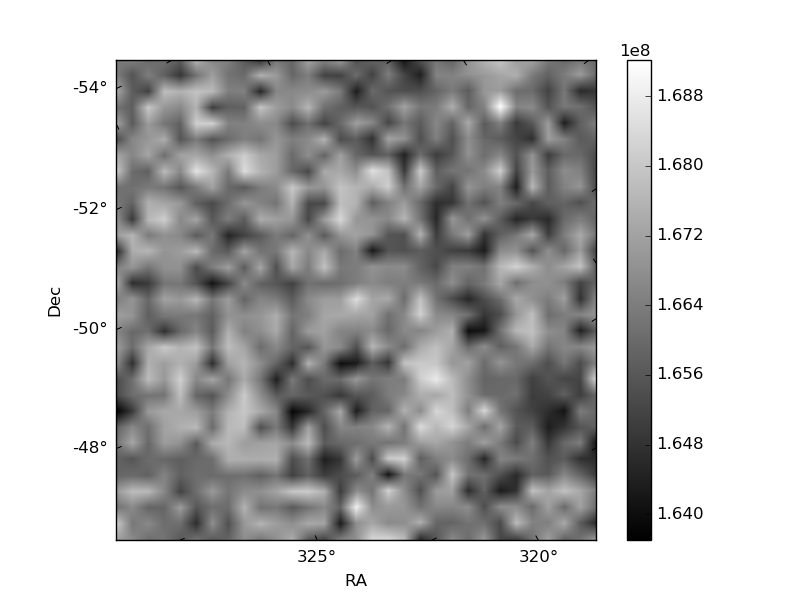
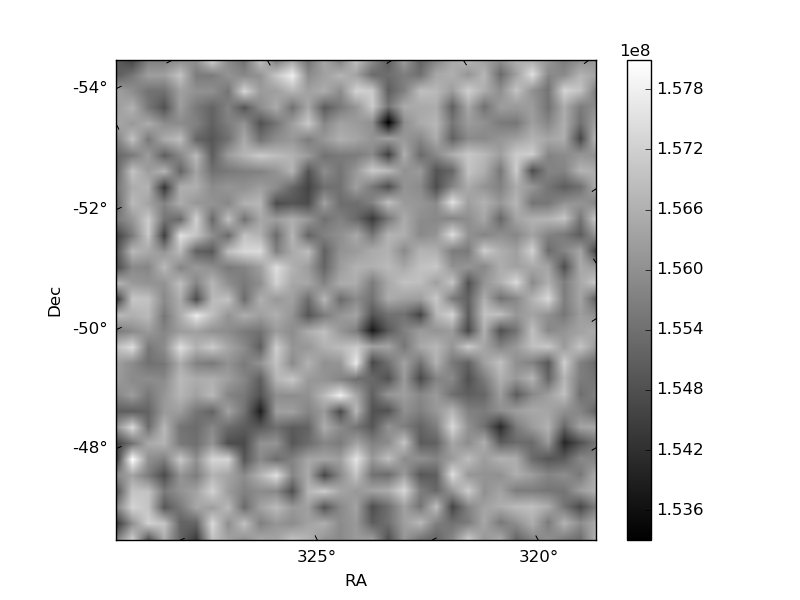
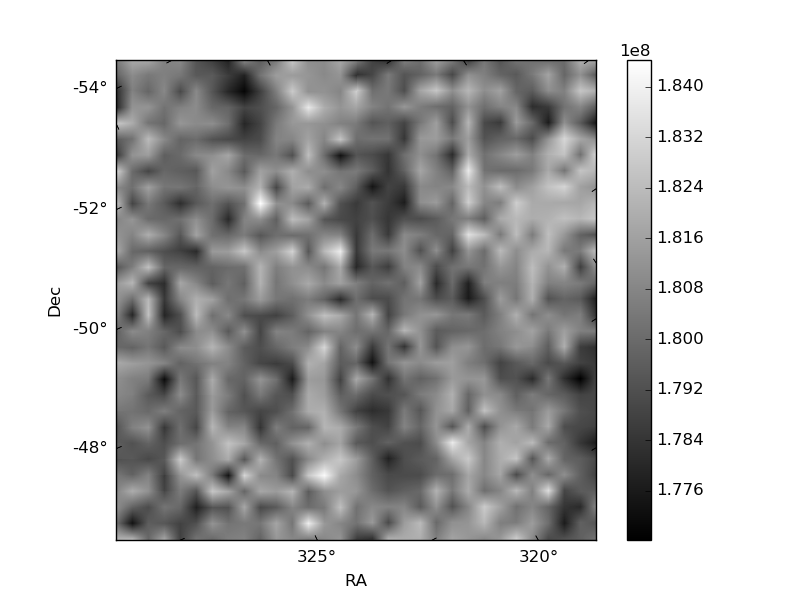
Histogram calculated using DETX and DETY for each event in the final _common_clean file
| Quadrant A | 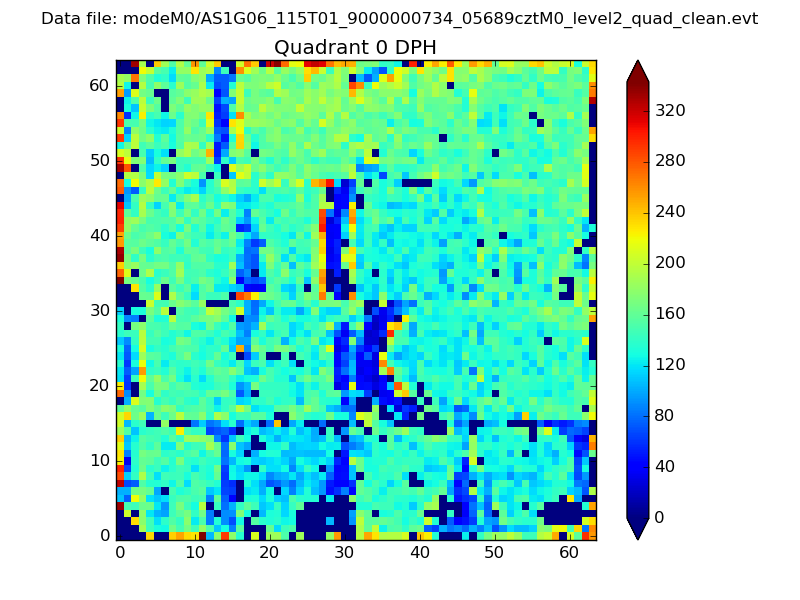 |
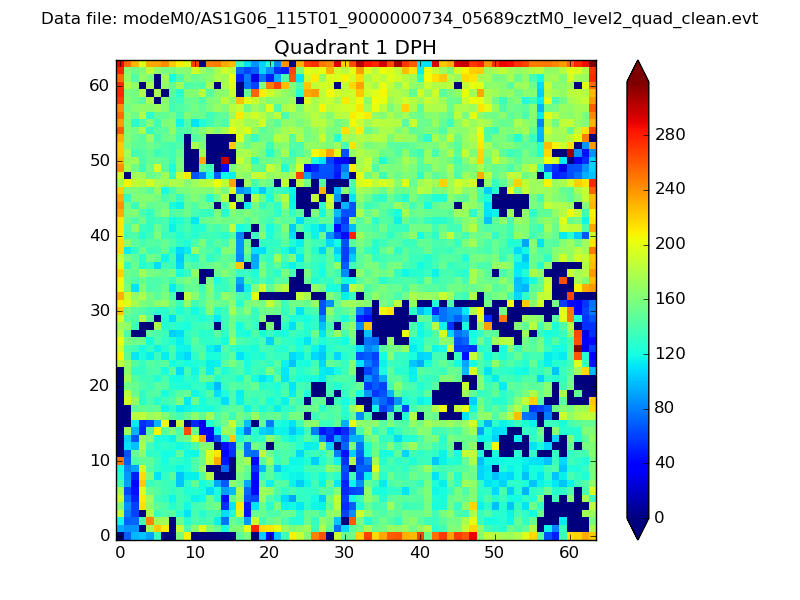 |
Quadrant B |
|---|---|---|---|
| Quadrant D | 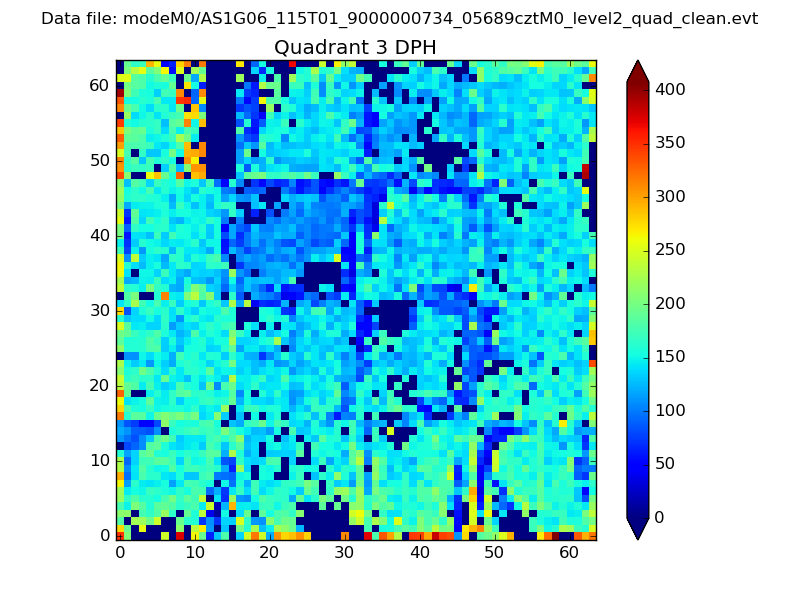 |
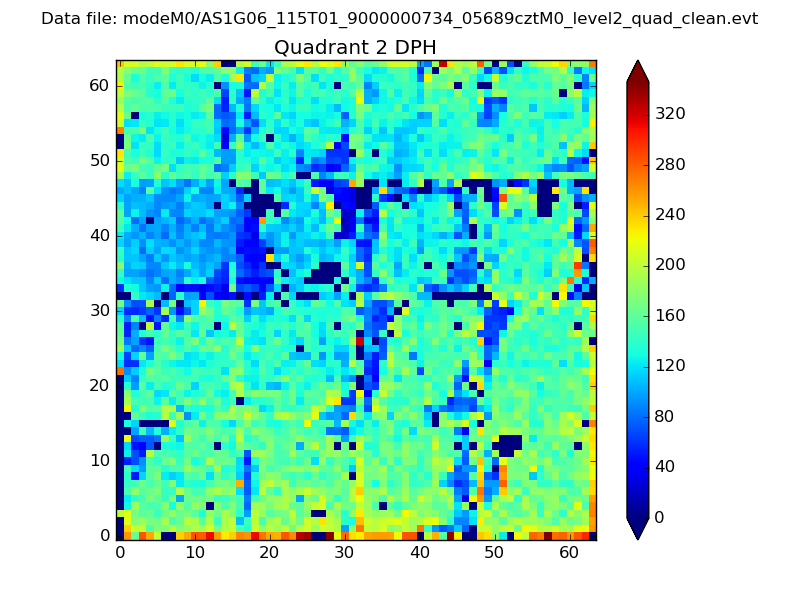 |
Quadrant C |
| Plot type | Count rate plots | Images |
|---|---|---|
| Comparison with Poisson distribution Blue bars denote a histogram of data divided into 1 sec bins. Red curve is a Poisson curve with rate = median count rate of data. |
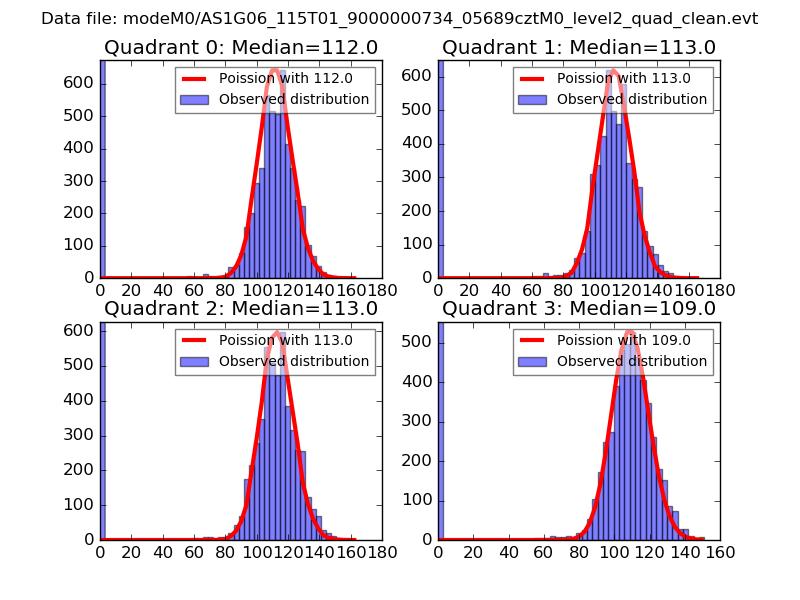 |
 |
| Quadrant-wise count rates Data is divided into 100 sec bins |
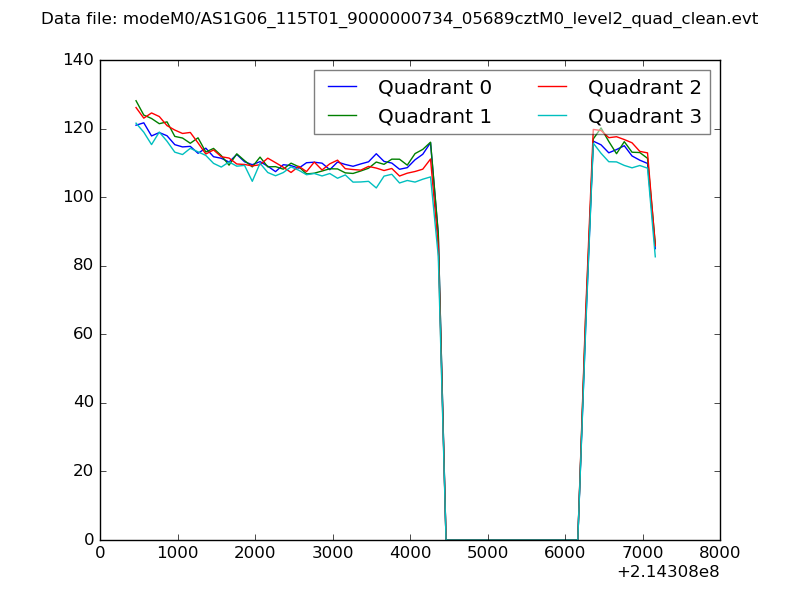 |
|
| Module-wise count rates for Quadrant A Data is divided into 100 sec bins |
 |
 |
| Module-wise count rates for Quadrant B Data is divided into 100 sec bins |
 |
 |
| Module-wise count rates for Quadrant C Data is divided into 100 sec bins |
 |
 |
| Module-wise count rates for Quadrant D Data is divided into 100 sec bins |
 |
 |
| Parameter | Plot |
|---|---|
| CZT HV Monitor | 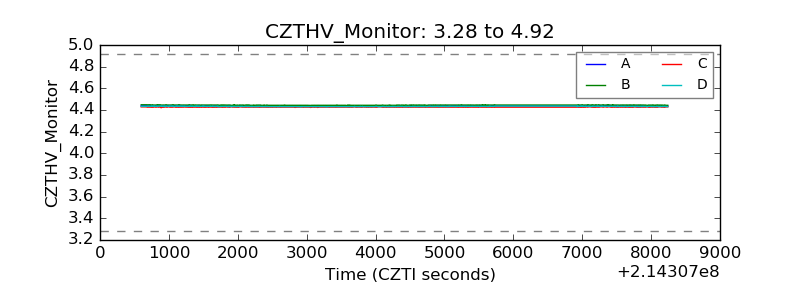 |
| D_VDD | 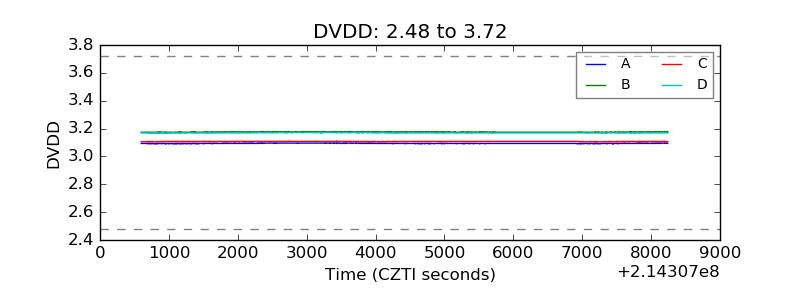 |
| Temperature 1 | 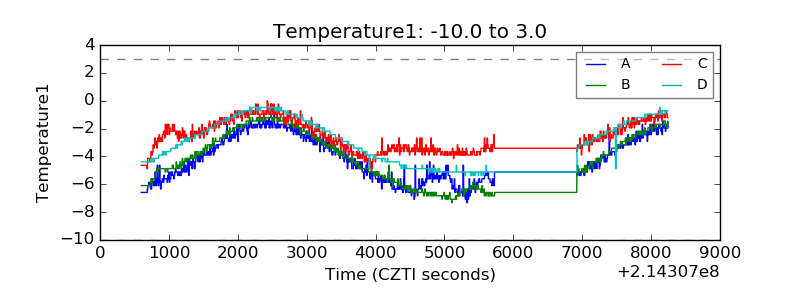 |
| Veto HV Monitor | 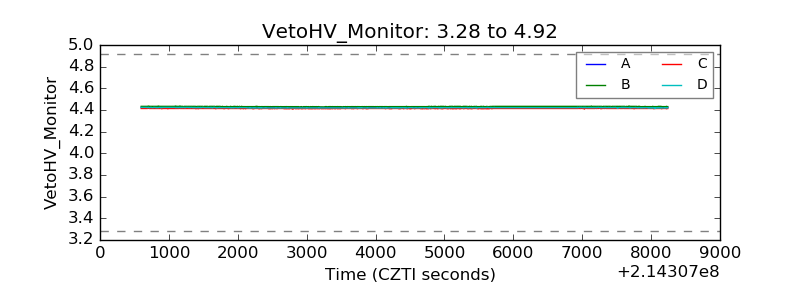 |
| Veto LLD | 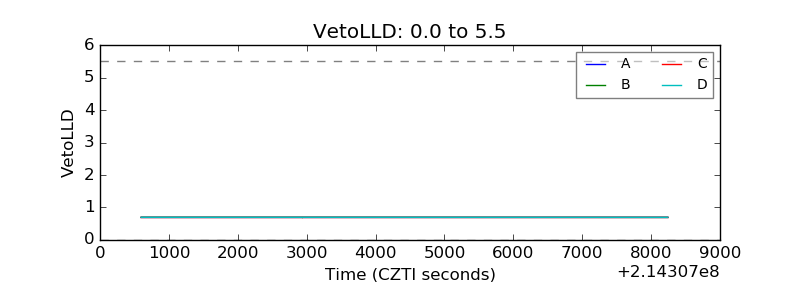 |
| Alpha Counter | 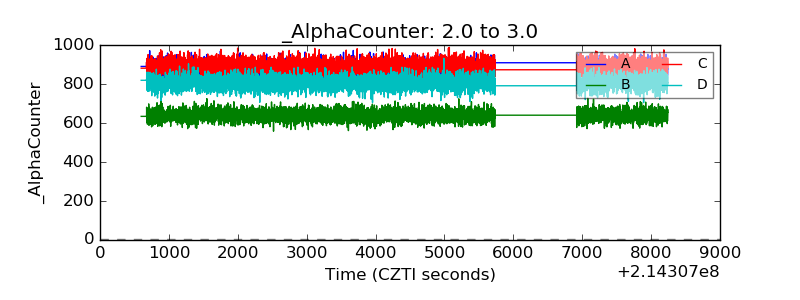 |
| _CPM_Rate | 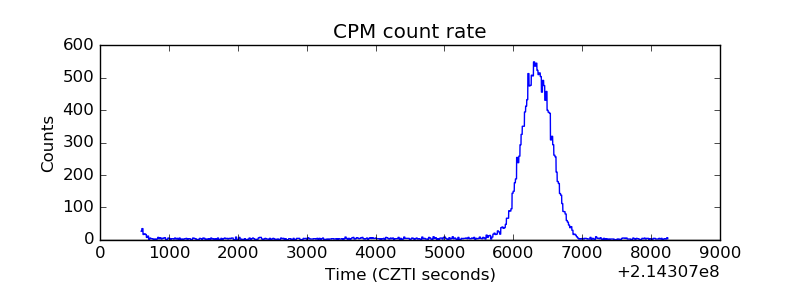 |
| CZT Counter | 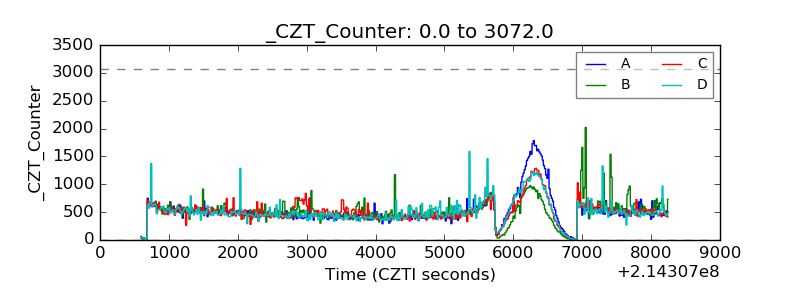 |
| +2.5 Volts monitor | 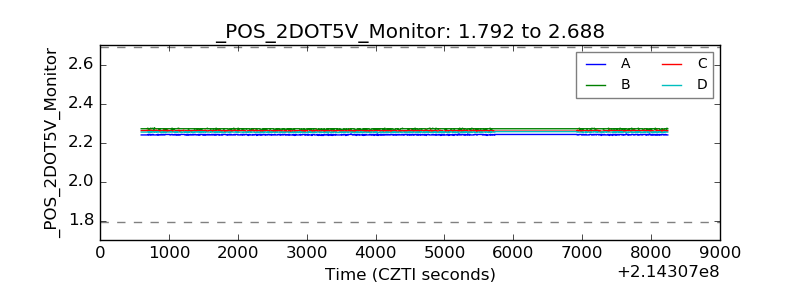 |
| +5 Volts monitor |  |
| _ROLL_ROT |  |
| _Roll_DEC | 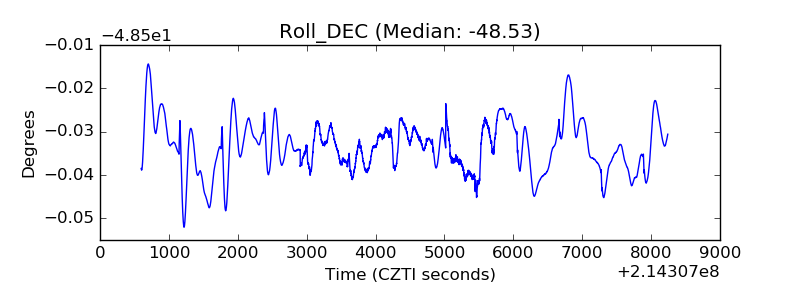 |
| _Roll_RA | 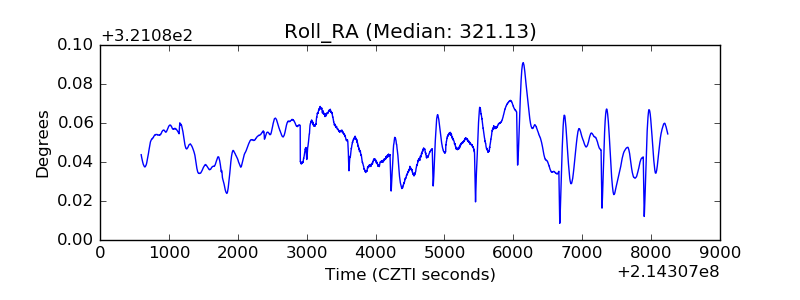 |
| Veto Counter | 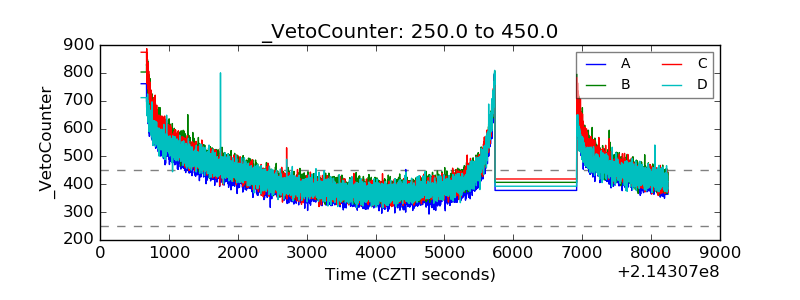 |