| Param | Original file | Final file |
|---|---|---|
| Filename | modeM0/AS1G06_115T01_9000000734_05690cztM0_level2.evt | modeM0/AS1G06_115T01_9000000734_05690cztM0_level2_quad_clean.evt |
| Size (bytes) | 440,087,040 | 94,703,040 |
| Size | 419.7 MB | 90.3 MB |
| Events in quadrant A | 3,059,188 | 605,810 |
| Events in quadrant B | 3,434,362 | 608,619 |
| Events in quadrant C | 3,191,030 | 607,741 |
| Events in quadrant D | 3,196,515 | 587,445 |
| Mode M0 | |||
|---|---|---|---|
| Quadrant | BADHDUFLAG | Total packets | Discarded packets |
| A | 0 | 13679 | 2 |
| B | 0 | 14504 | 1 |
| C | 0 | 13815 | 1 |
| D | 0 | 14016 | 1 |
| Mode M9 | |||
|---|---|---|---|
| Quadrant | BADHDUFLAG | Total packets | Discarded packets |
| A | 0 | 10 | 0 |
| B | 0 | 10 | 0 |
| C | 0 | 10 | 0 |
| D | 0 | 10 | 0 |
| Mode SS | |||
|---|---|---|---|
| Quadrant | BADHDUFLAG | Total packets | Discarded packets |
| A | 0 | 134 | 0 |
| B | 0 | 134 | 0 |
| C | 0 | 134 | 0 |
| D | 0 | 134 | 0 |
| Quadrant | Total seconds | Saturated seconds | Saturation percentage |
|---|---|---|---|
| A | 6572 | 110 | 1.673767% |
| B | 6572 | 103 | 1.567255% |
| C | 6572 | 61 | 0.928180% |
| D | 6572 | 85 | 1.293366% |
Noise dominated data is calculated using 1-second bins in cleaned event files. If a bin has >2000 counts, and if more than 50% of those come from <1% of pixels, then it is considered to be noise-dominated and hence unusable.
| Quadrant | # 1 sec bins | Bins with >0 counts | Bins with >2000 counts | High rate bins dominated by noise | Noise dominated (total time) | Noise dominated (detector-on time) | Marked lightcurve |
|---|---|---|---|---|---|---|---|
| A | 7532 | 6573 | 5 | 5 | 0.07% | 0.08% |  |
| B | 7532 | 6573 | 4 | 4 | 0.05% | 0.06% | 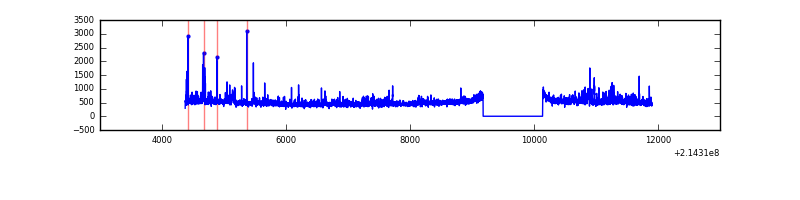 |
| C | 7532 | 6573 | 0 | 0 | 0.00% | 0.00% | 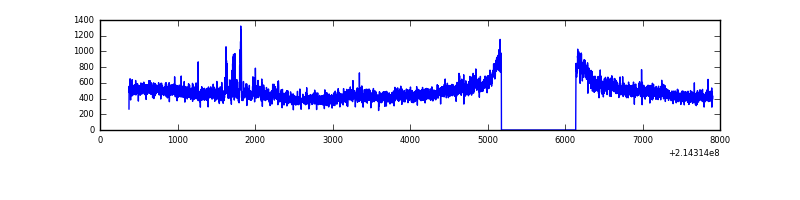 |
| D | 7532 | 6573 | 10 | 10 | 0.13% | 0.15% | 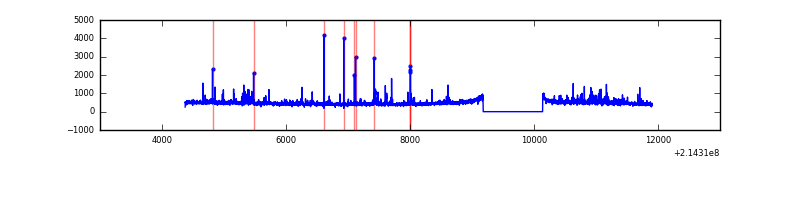 |
Top three noisy pixels from each quadrant. If the there are fewer than three noisy pixels in the level2.evt file, extra rows are filled as -1
| Pixel properties | Quadrant properties | ||||||
|---|---|---|---|---|---|---|---|
| Quadrant | DetID | PixID | Counts | Sigma | Mean | Median | Sigma |
| A | 15 | 236 | 55981 | 354.34 | 771 | 754 | 155.9 |
| A | 0 | 50 | 22985 | 142.63 | 771 | 754 | 155.9 |
| A | 13 | 6 | 8172 | 47.59 | 771 | 754 | 155.9 |
| B | 15 | 204 | 199916 | 1333.82 | 775 | 755 | 149.3 |
| B | 11 | 51 | 78454 | 520.36 | 775 | 755 | 149.3 |
| B | 0 | 214 | 73835 | 489.43 | 775 | 755 | 149.3 |
| C | 1 | 16 | 231706 | 1350.9 | 741 | 744 | 171.0 |
| C | 3 | 9 | 64739 | 374.31 | 741 | 744 | 171.0 |
| C | 13 | 61 | 5932 | 30.34 | 741 | 744 | 171.0 |
| D | 2 | 152 | 125319 | 683.08 | 747 | 723 | 182.4 |
| D | 8 | 195 | 108140 | 588.9 | 747 | 723 | 182.4 |
| D | 2 | 14 | 47760 | 257.87 | 747 | 723 | 182.4 |
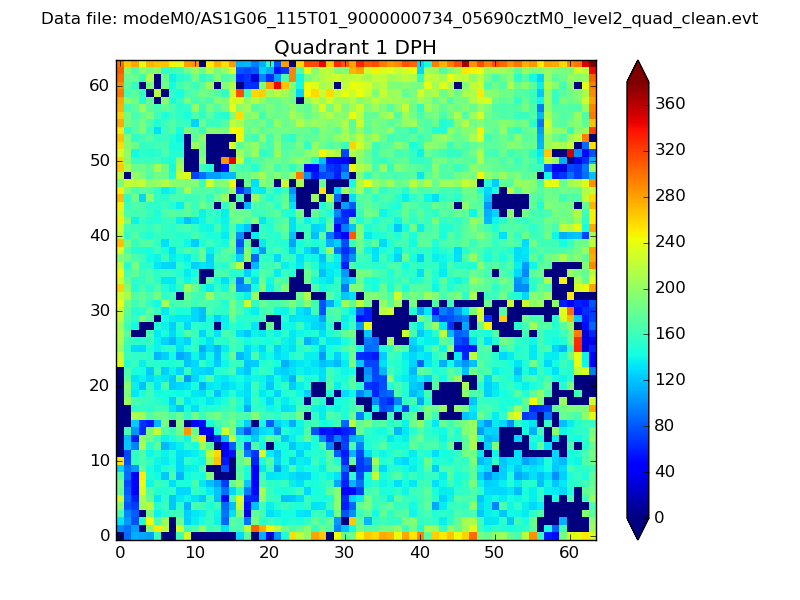
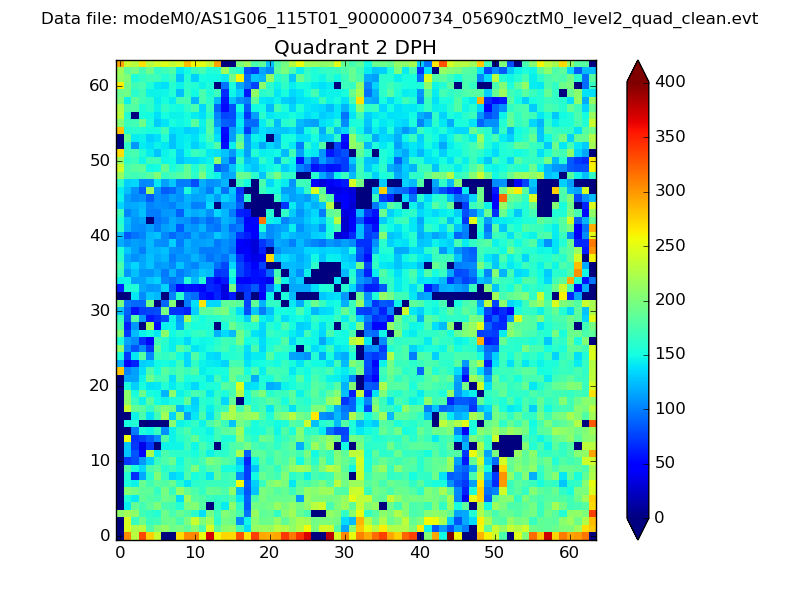
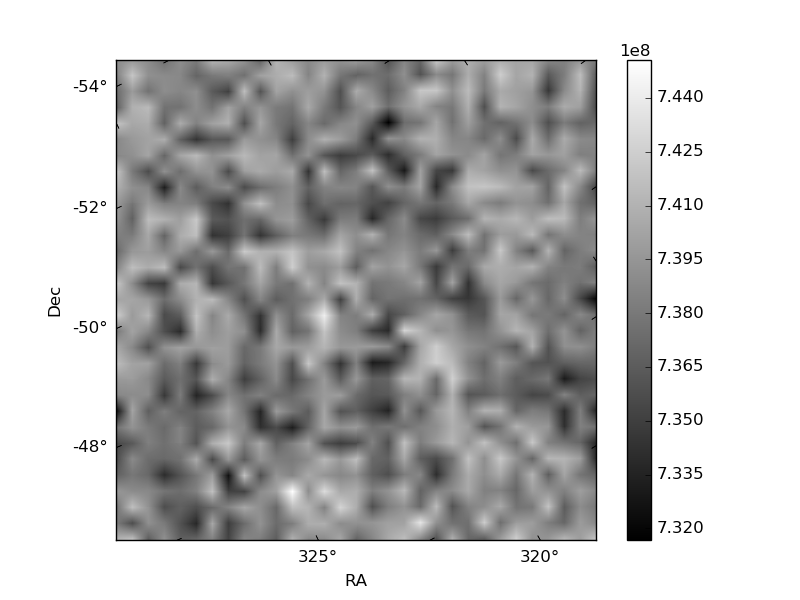
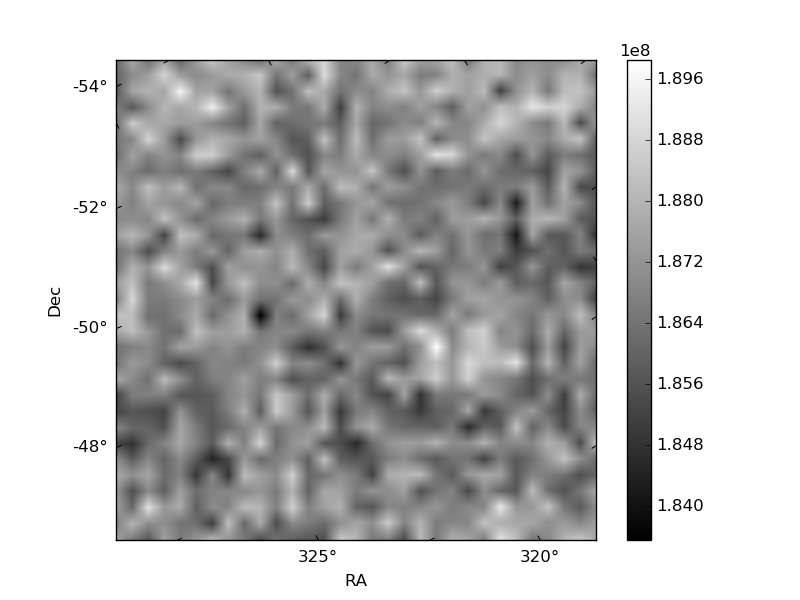
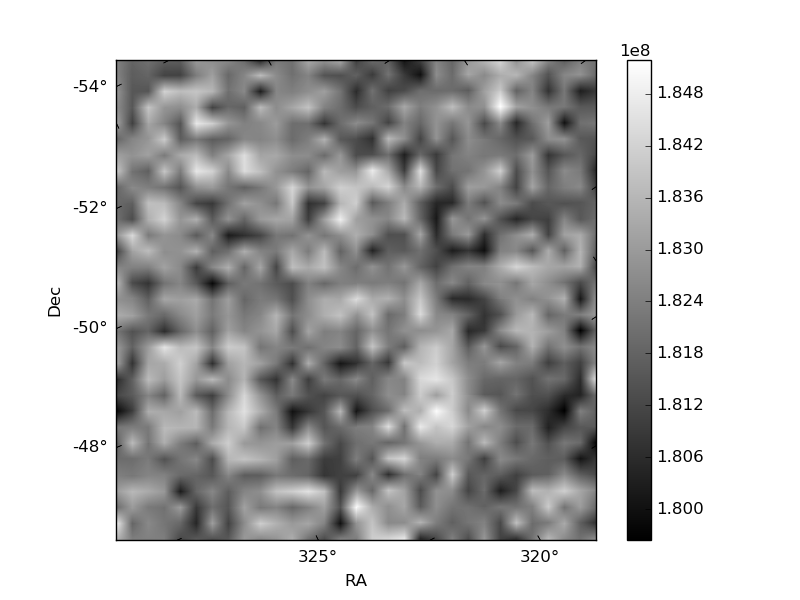
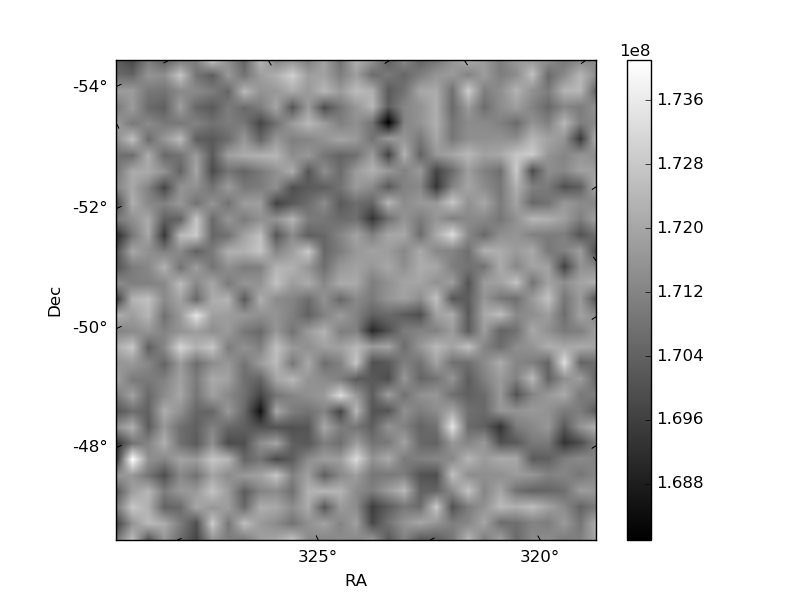
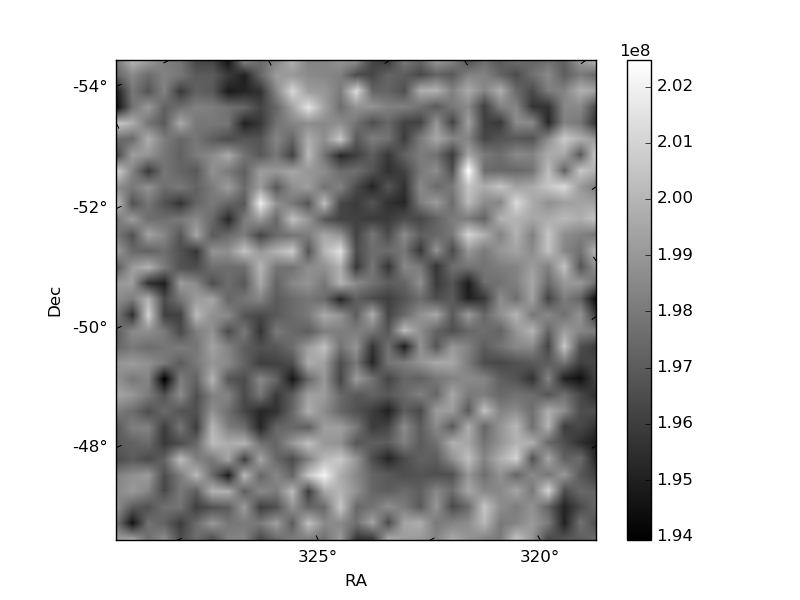
Histogram calculated using DETX and DETY for each event in the final _common_clean file
| Quadrant A | 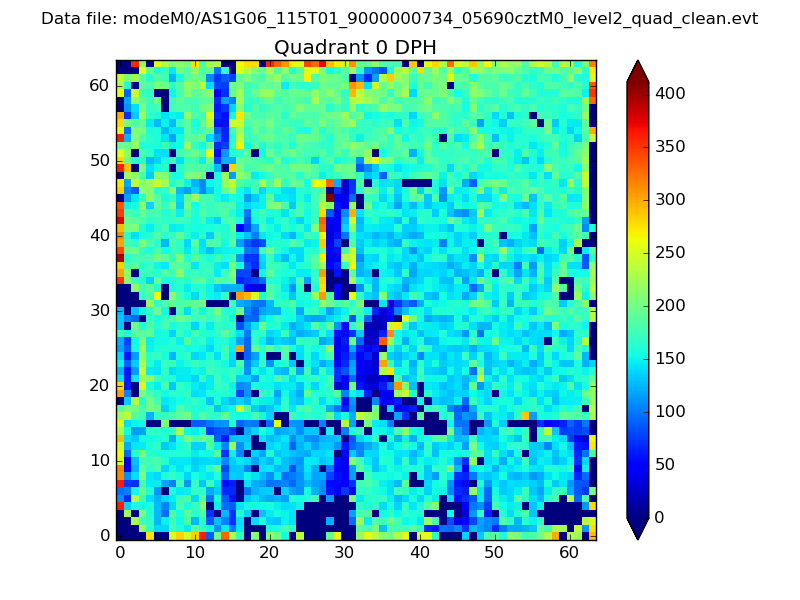 |
 |
Quadrant B |
|---|---|---|---|
| Quadrant D | 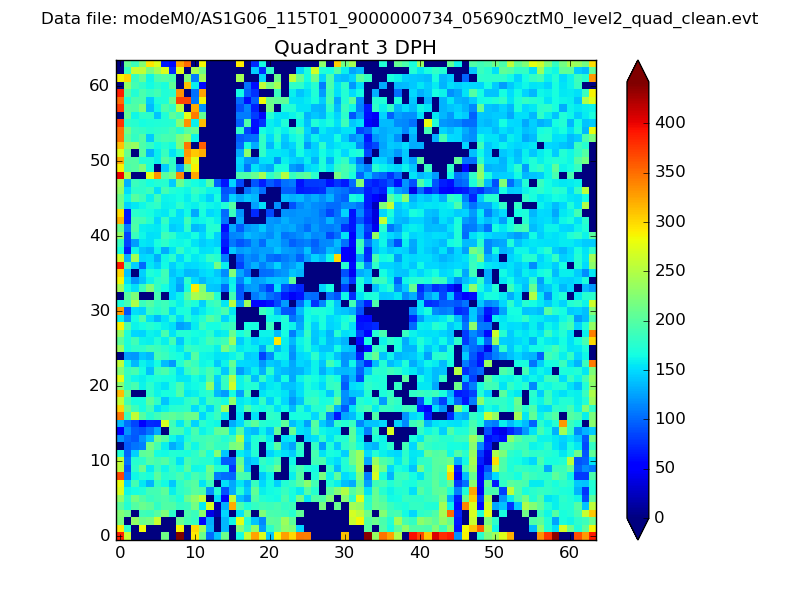 |
 |
Quadrant C |
| Plot type | Count rate plots | Images |
|---|---|---|
| Comparison with Poisson distribution Blue bars denote a histogram of data divided into 1 sec bins. Red curve is a Poisson curve with rate = median count rate of data. |
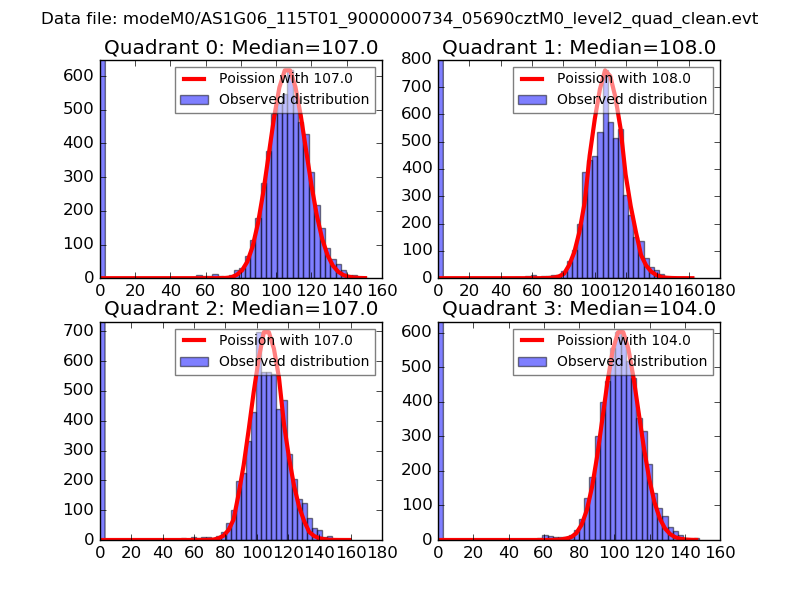 |
 |
| Quadrant-wise count rates Data is divided into 100 sec bins |
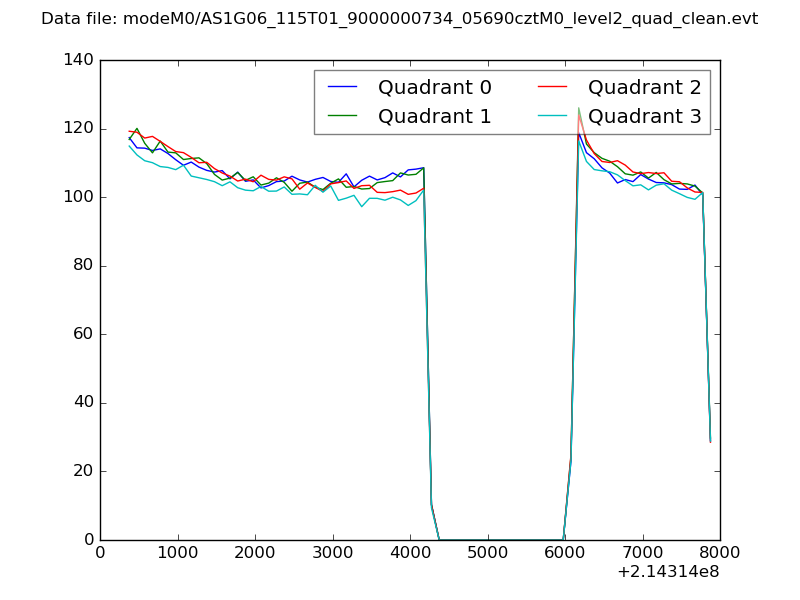 |
|
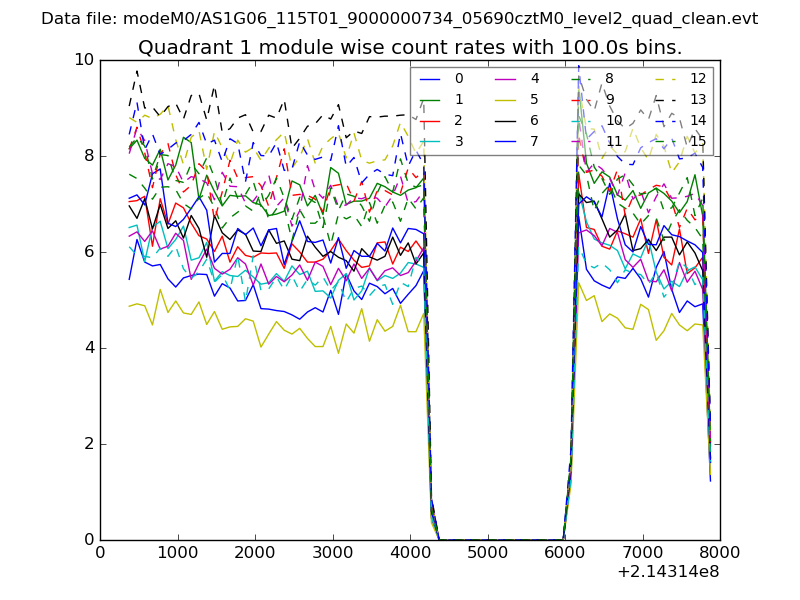
| Module-wise count rates for Quadrant A Data is divided into 100 sec bins |
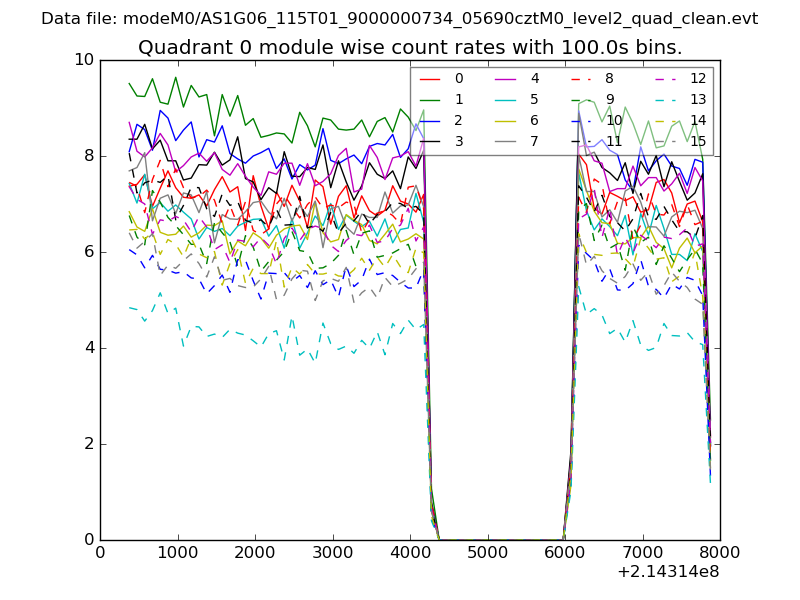 |
 |
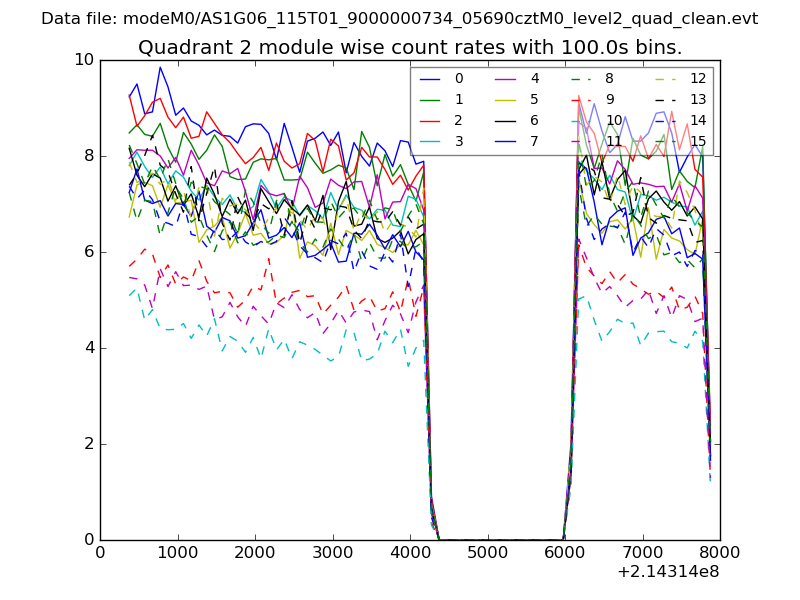
| Module-wise count rates for Quadrant B Data is divided into 100 sec bins |
 |
 |
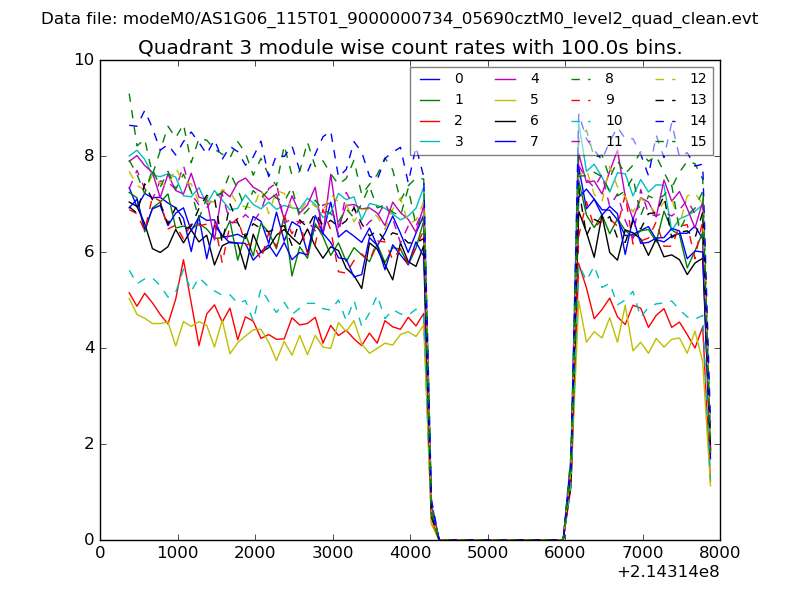
| Module-wise count rates for Quadrant C Data is divided into 100 sec bins |
 |
 |
| Module-wise count rates for Quadrant D Data is divided into 100 sec bins |
 |
 |
| Parameter | Plot |
|---|---|
| CZT HV Monitor | 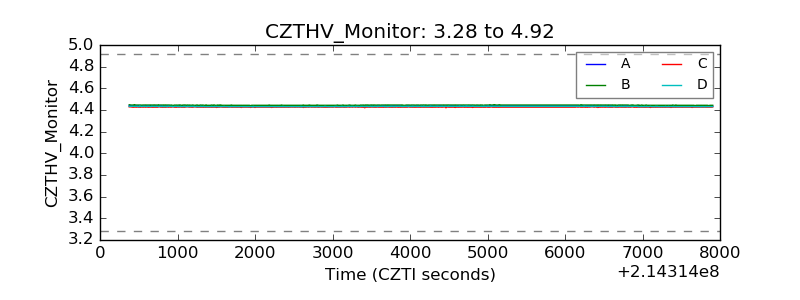 |
| D_VDD | 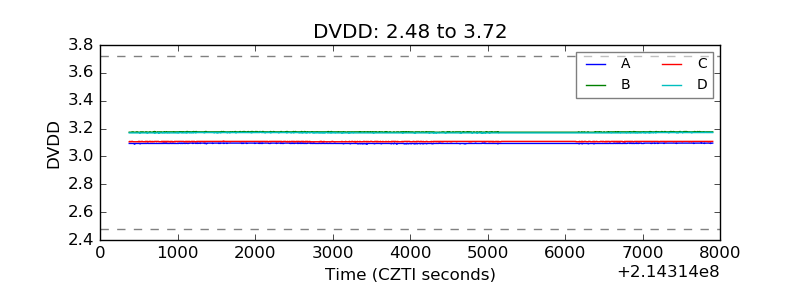 |
| Temperature 1 | 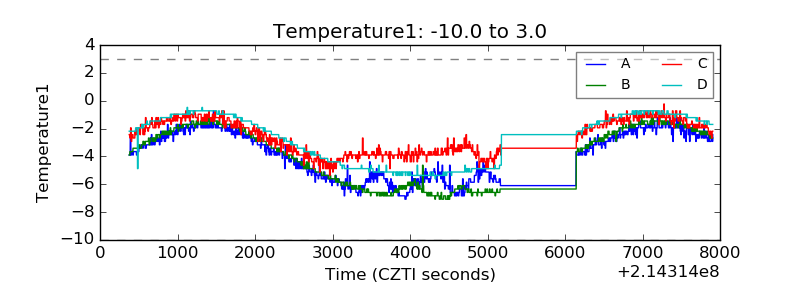 |
| Veto HV Monitor | 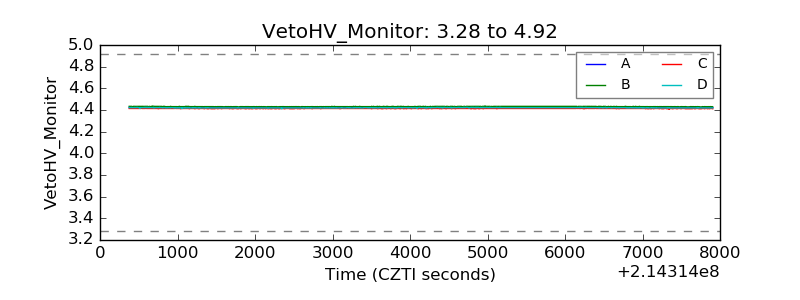 |
| Veto LLD | 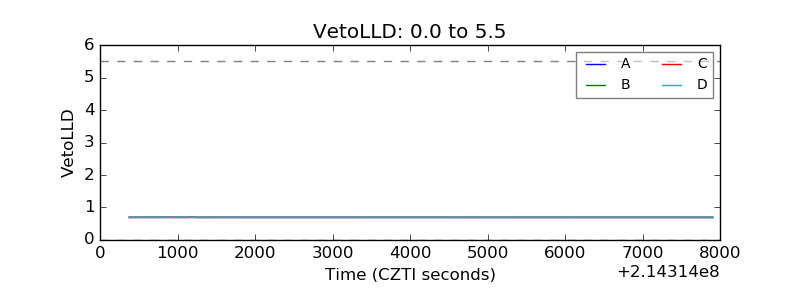 |
| Alpha Counter | 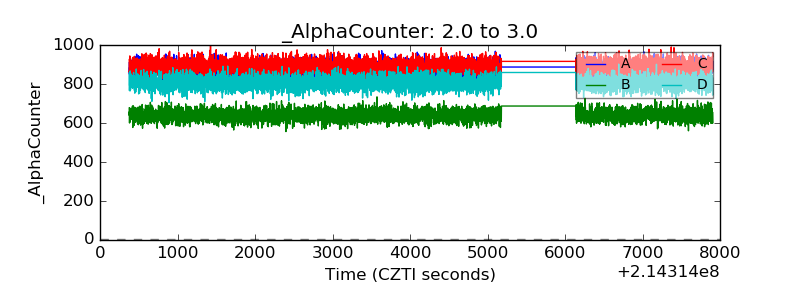 |
| _CPM_Rate | 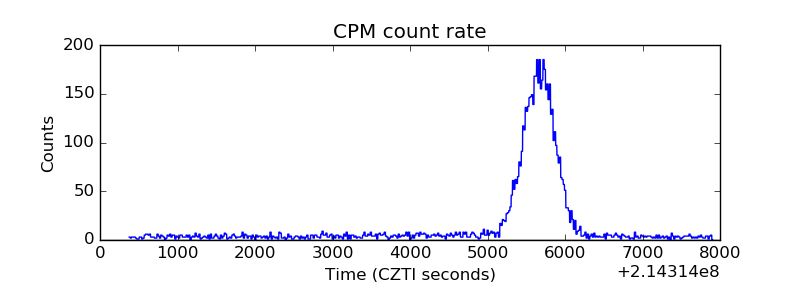 |
| CZT Counter | 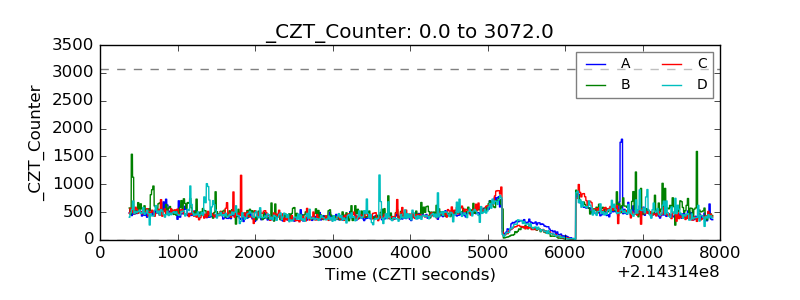 |
| +2.5 Volts monitor |  |
| +5 Volts monitor |  |
| _ROLL_ROT | 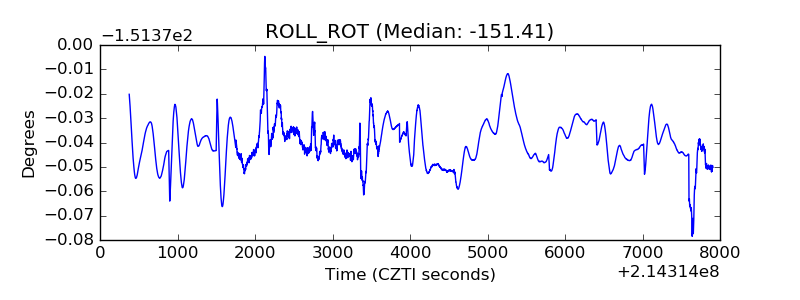 |
| _Roll_DEC | 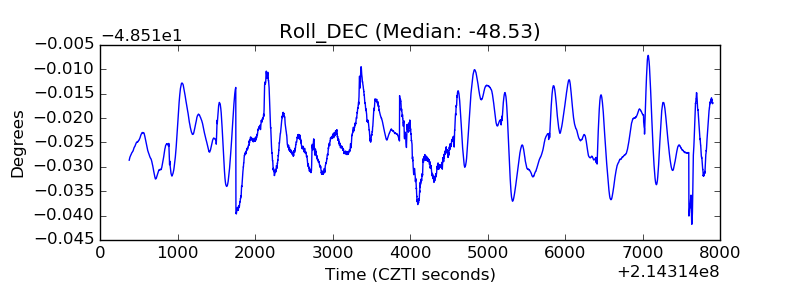 |
| _Roll_RA | 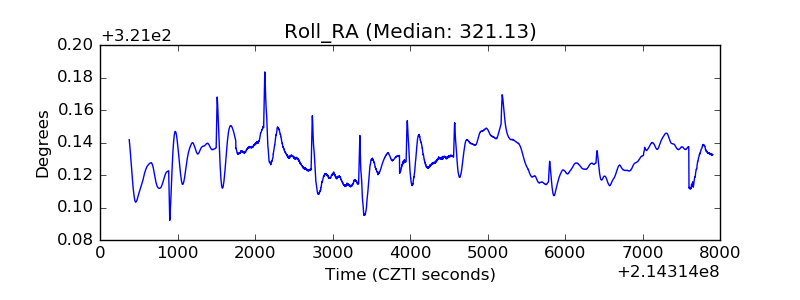 |
| Veto Counter | 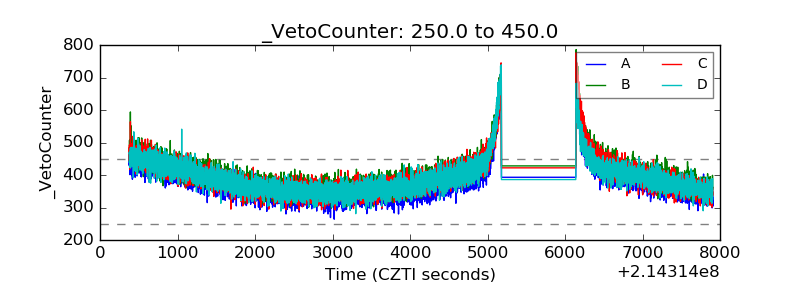 |