| Param | Original file | Final file |
|---|---|---|
| Filename | modeM0/AS1G06_115T01_9000000734_05691cztM0_level2.evt | modeM0/AS1G06_115T01_9000000734_05691cztM0_level2_quad_clean.evt |
| Size (bytes) | 448,416,000 | 86,175,360 |
| Size | 427.6 MB | 82.2 MB |
| Events in quadrant A | 3,121,736 | 536,726 |
| Events in quadrant B | 3,492,915 | 537,012 |
| Events in quadrant C | 3,122,304 | 537,225 |
| Events in quadrant D | 3,376,731 | 520,384 |
| Mode M0 | |||
|---|---|---|---|
| Quadrant | BADHDUFLAG | Total packets | Discarded packets |
| A | 0 | 14250 | 2 |
| B | 0 | 14999 | 1 |
| C | 0 | 14093 | 1 |
| D | 0 | 15100 | 1 |
| Mode M9 | |||
|---|---|---|---|
| Quadrant | BADHDUFLAG | Total packets | Discarded packets |
| A | 0 | 6 | 0 |
| B | 0 | 6 | 0 |
| C | 0 | 6 | 0 |
| D | 0 | 6 | 0 |
| Mode SS | |||
|---|---|---|---|
| Quadrant | BADHDUFLAG | Total packets | Discarded packets |
| A | 0 | 140 | 0 |
| B | 0 | 140 | 0 |
| C | 0 | 140 | 0 |
| D | 0 | 140 | 0 |
| Quadrant | Total seconds | Saturated seconds | Saturation percentage |
|---|---|---|---|
| A | 6862 | 67 | 0.976392% |
| B | 6862 | 84 | 1.224133% |
| C | 6862 | 18 | 0.262314% |
| D | 6862 | 49 | 0.714078% |
Noise dominated data is calculated using 1-second bins in cleaned event files. If a bin has >2000 counts, and if more than 50% of those come from <1% of pixels, then it is considered to be noise-dominated and hence unusable.
| Quadrant | # 1 sec bins | Bins with >0 counts | Bins with >2000 counts | High rate bins dominated by noise | Noise dominated (total time) | Noise dominated (detector-on time) | Marked lightcurve |
|---|---|---|---|---|---|---|---|
| A | 7447 | 6863 | 3 | 3 | 0.04% | 0.04% | 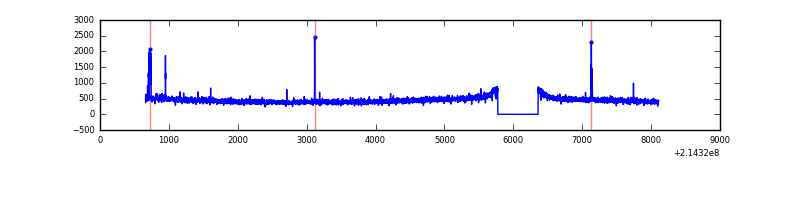 |
| B | 7447 | 6863 | 12 | 12 | 0.16% | 0.17% | 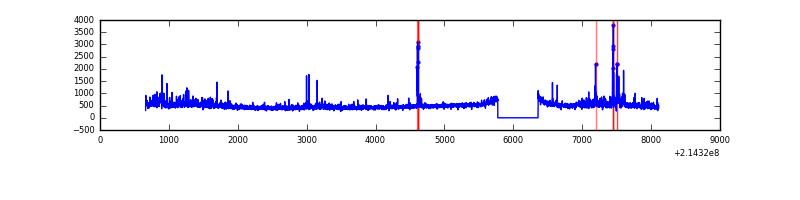 |
| C | 7447 | 6863 | 0 | 0 | 0.00% | 0.00% | 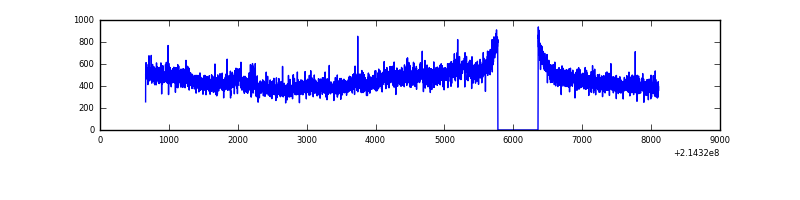 |
| D | 7447 | 6863 | 17 | 17 | 0.23% | 0.25% |  |
Top three noisy pixels from each quadrant. If the there are fewer than three noisy pixels in the level2.evt file, extra rows are filled as -1
| Pixel properties | Quadrant properties | ||||||
|---|---|---|---|---|---|---|---|
| Quadrant | DetID | PixID | Counts | Sigma | Mean | Median | Sigma |
| A | 15 | 236 | 52278 | 322.45 | 787 | 773 | 159.7 |
| A | 0 | 50 | 25405 | 154.21 | 787 | 773 | 159.7 |
| A | 0 | 226 | 7697 | 43.35 | 787 | 773 | 159.7 |
| B | 15 | 204 | 165163 | 1079.2 | 793 | 774 | 152.3 |
| B | 0 | 214 | 68819 | 446.71 | 793 | 774 | 152.3 |
| B | 11 | 51 | 68724 | 446.09 | 793 | 774 | 152.3 |
| C | 1 | 16 | 163296 | 934.63 | 757 | 762 | 173.9 |
| C | 13 | 61 | 6019 | 30.23 | 757 | 762 | 173.9 |
| C | 8 | 222 | 2838 | 11.94 | 757 | 762 | 173.9 |
| D | 2 | 152 | 190271 | 1020.88 | 760 | 735 | 185.7 |
| D | 2 | 136 | 114736 | 614.03 | 760 | 735 | 185.7 |
| D | 2 | 14 | 60391 | 321.32 | 760 | 735 | 185.7 |
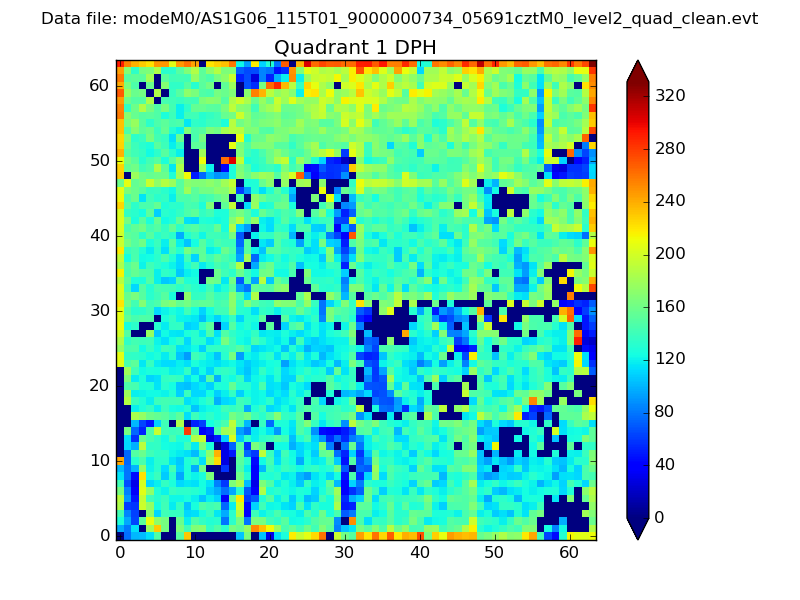
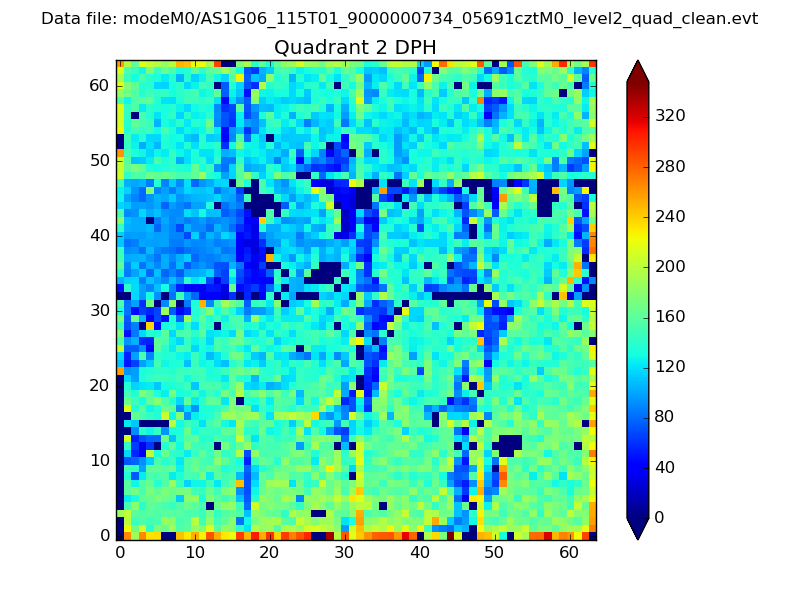
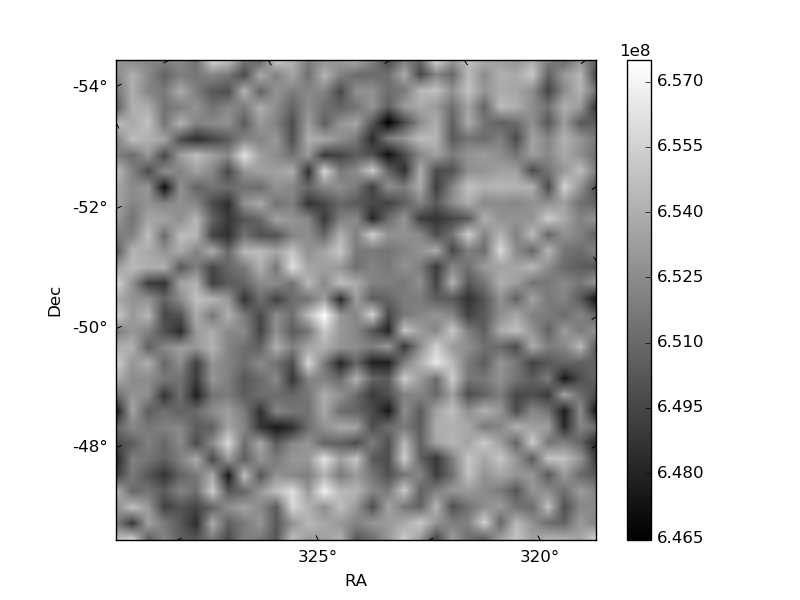
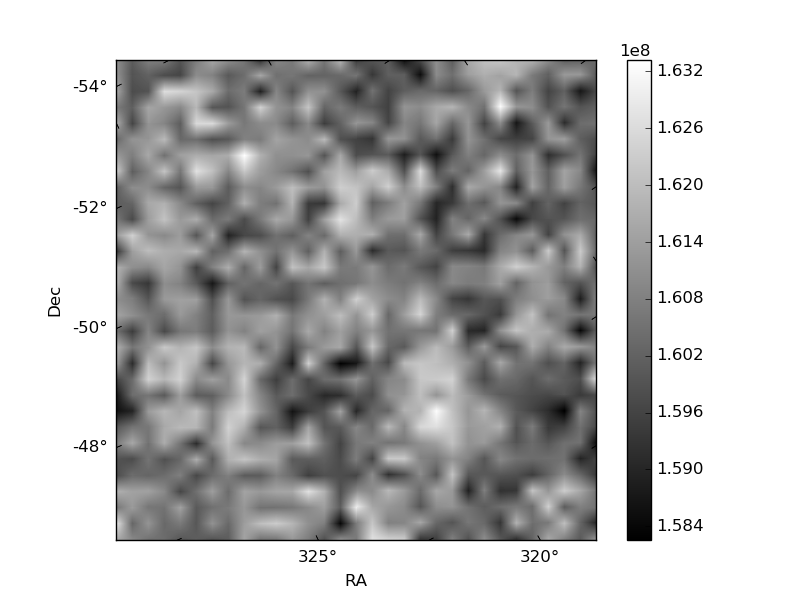
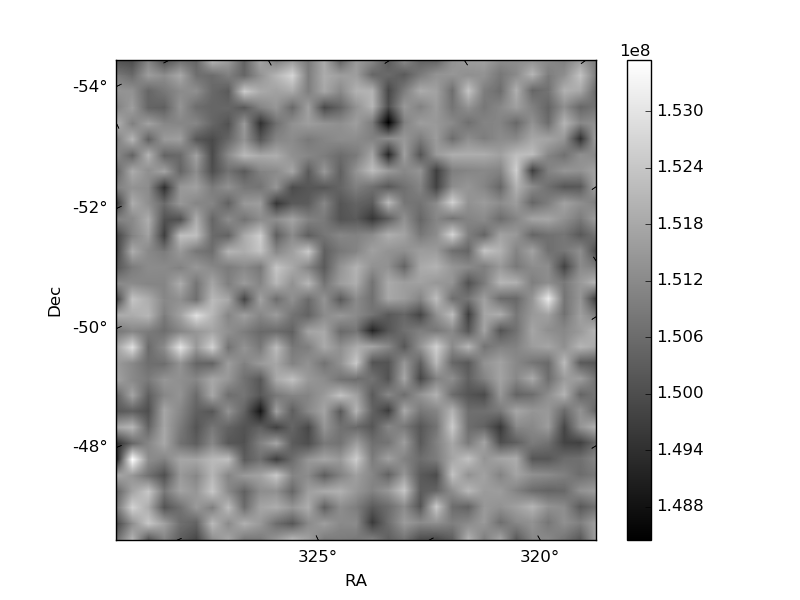
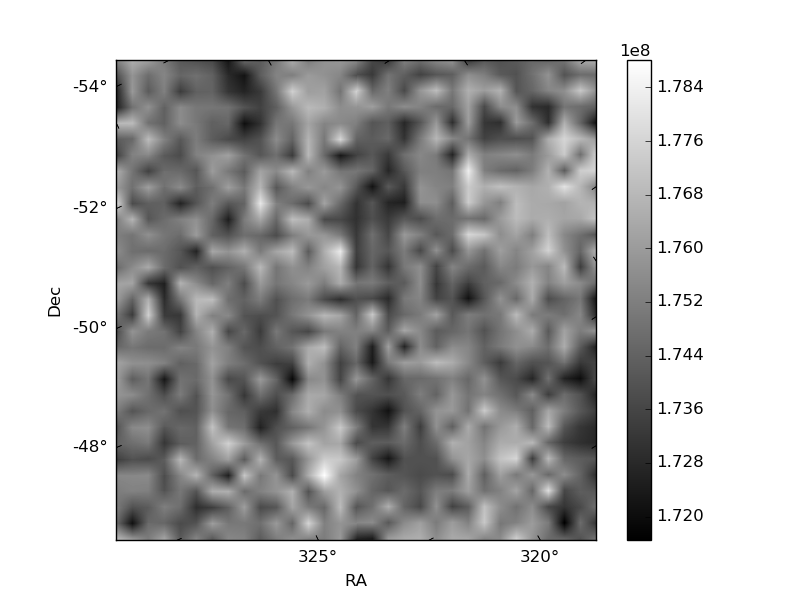
Histogram calculated using DETX and DETY for each event in the final _common_clean file
| Quadrant A | 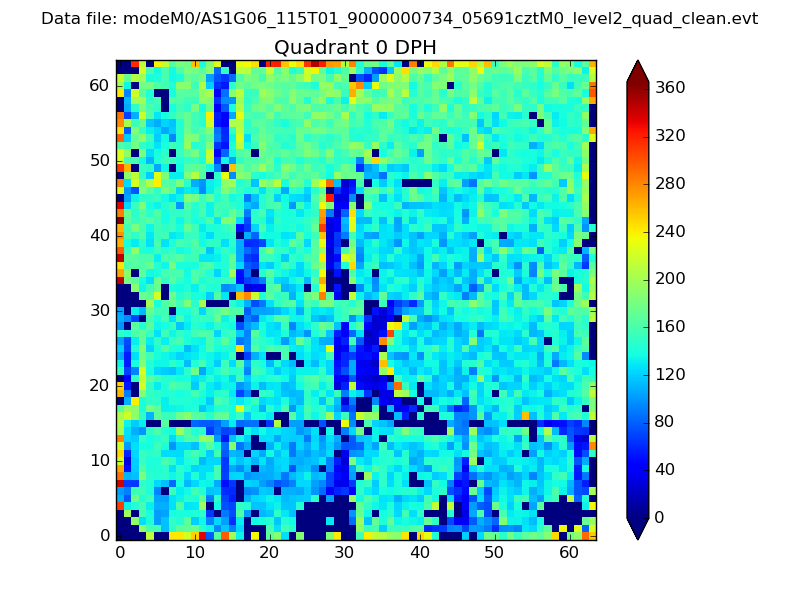 |
 |
Quadrant B |
|---|---|---|---|
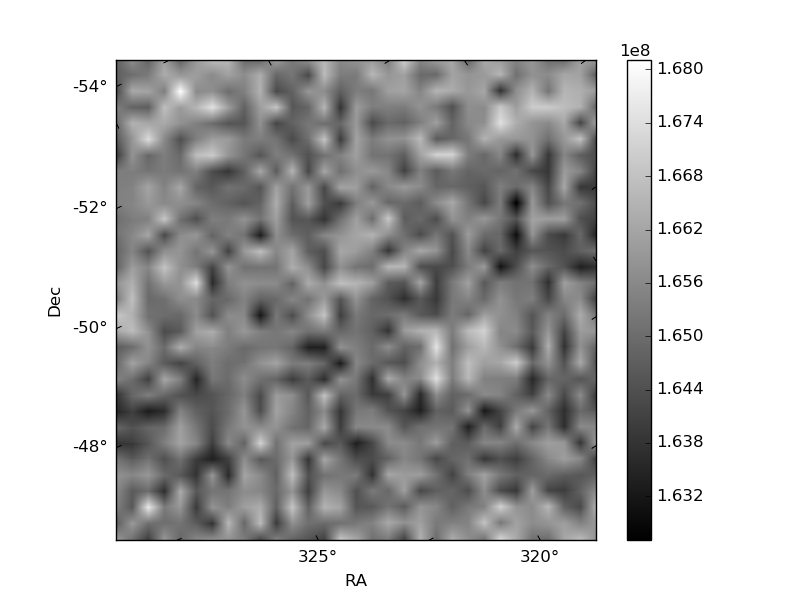
| Quadrant D | 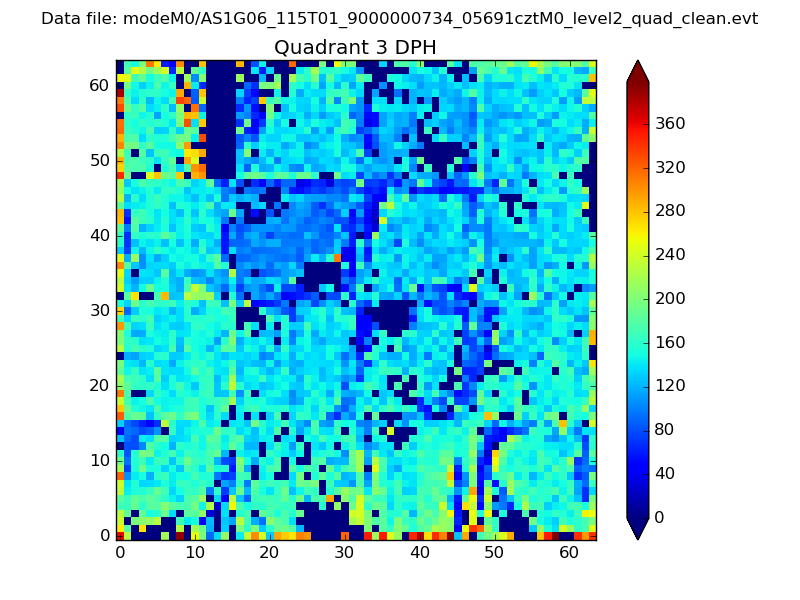 |
 |
Quadrant C |
| Plot type | Count rate plots | Images |
|---|---|---|
| Comparison with Poisson distribution Blue bars denote a histogram of data divided into 1 sec bins. Red curve is a Poisson curve with rate = median count rate of data. |
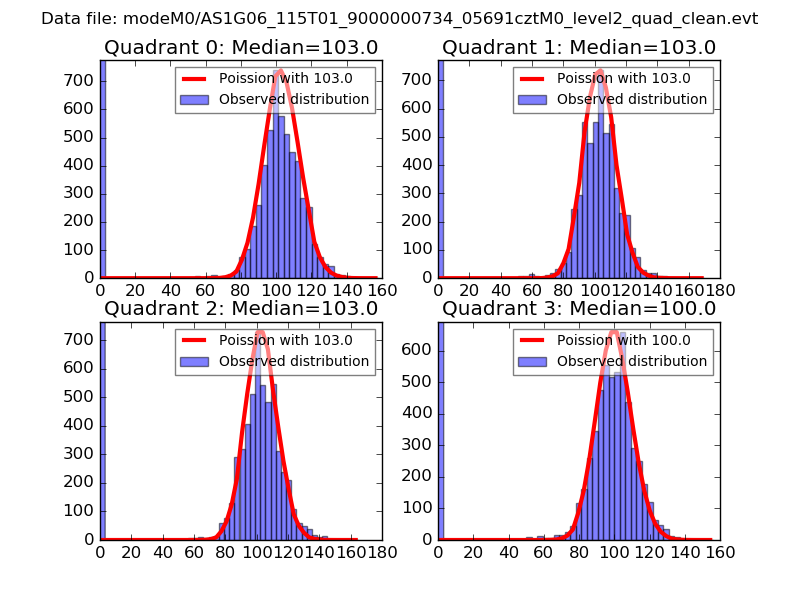 |
 |
| Quadrant-wise count rates Data is divided into 100 sec bins |
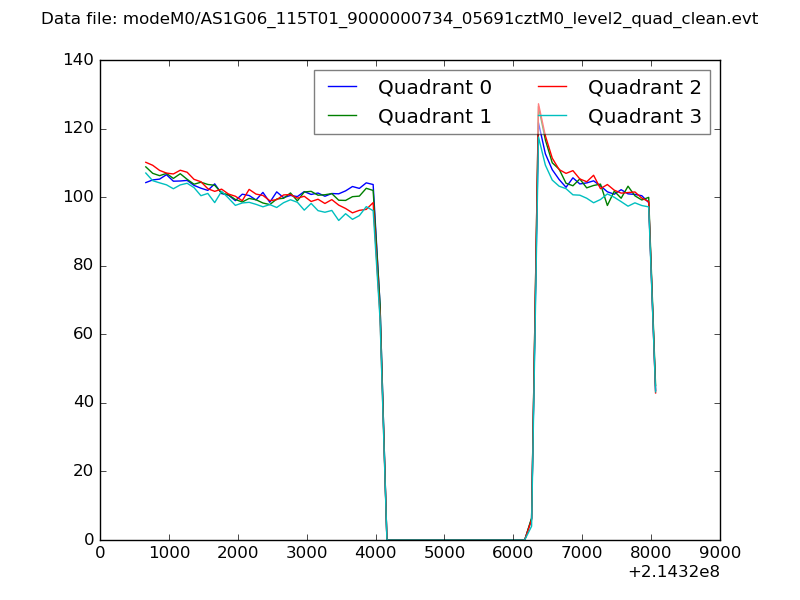 |
|
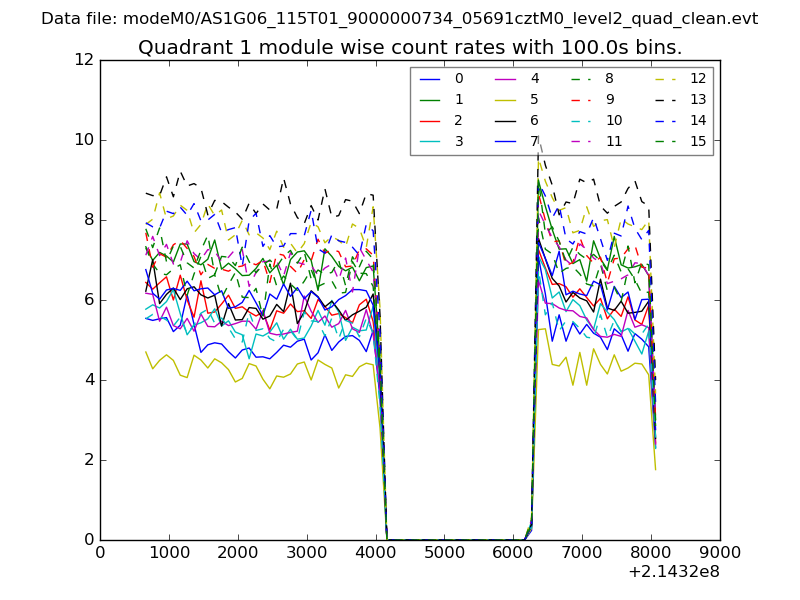
| Module-wise count rates for Quadrant A Data is divided into 100 sec bins |
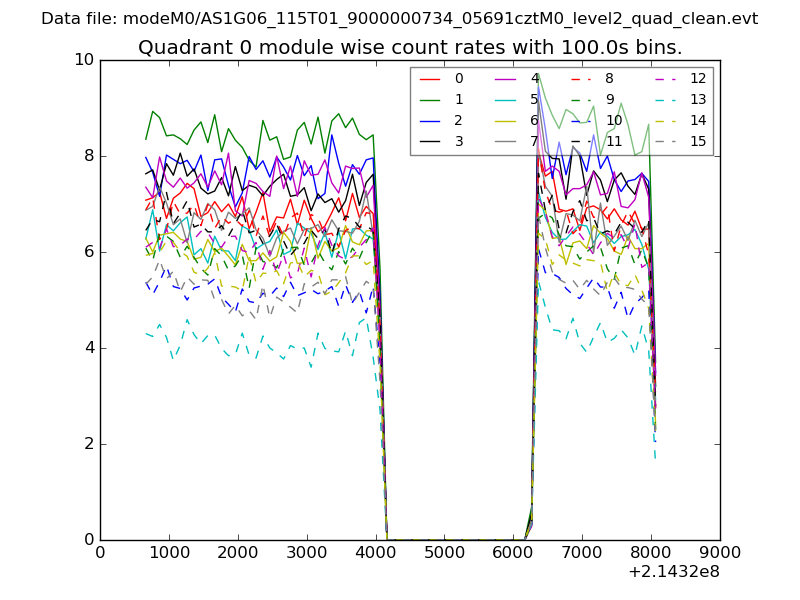 |
 |
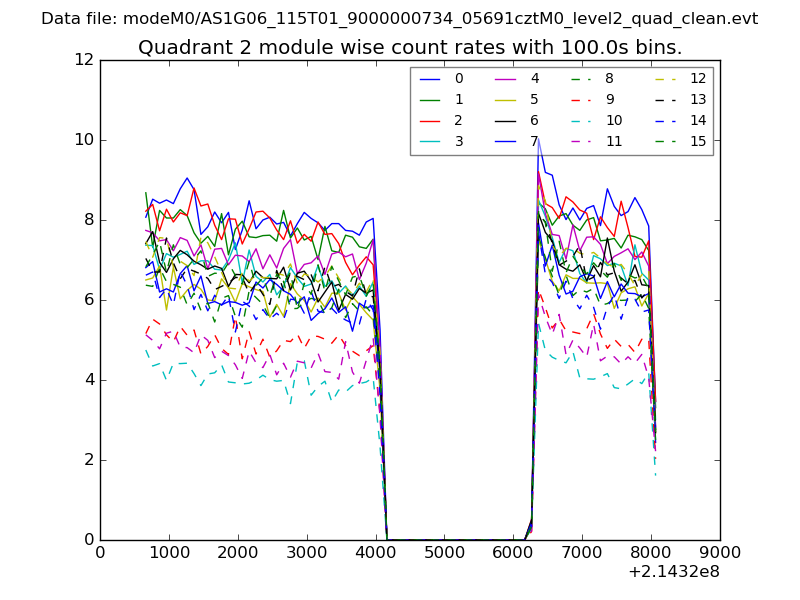
| Module-wise count rates for Quadrant B Data is divided into 100 sec bins |
 |
 |
| Module-wise count rates for Quadrant C Data is divided into 100 sec bins |
 |
 |
| Module-wise count rates for Quadrant D Data is divided into 100 sec bins |
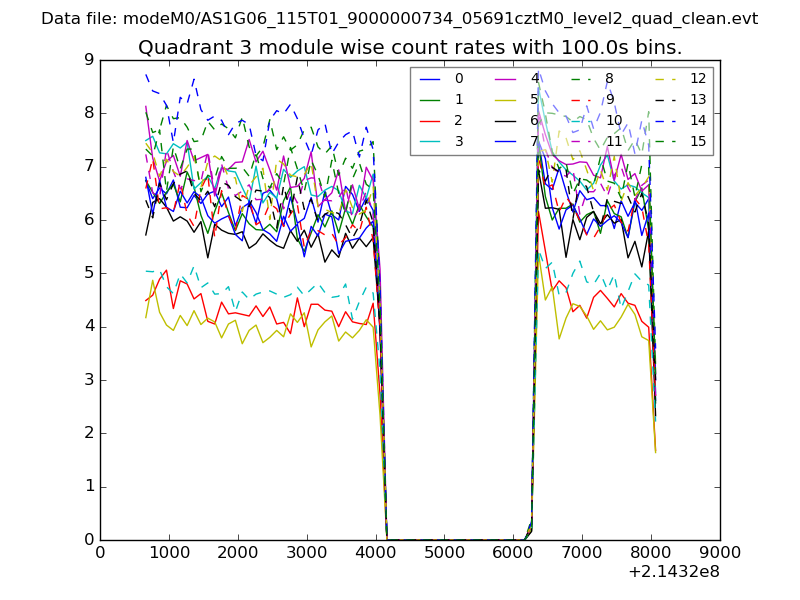 |
 |
| Parameter | Plot |
|---|---|
| CZT HV Monitor | 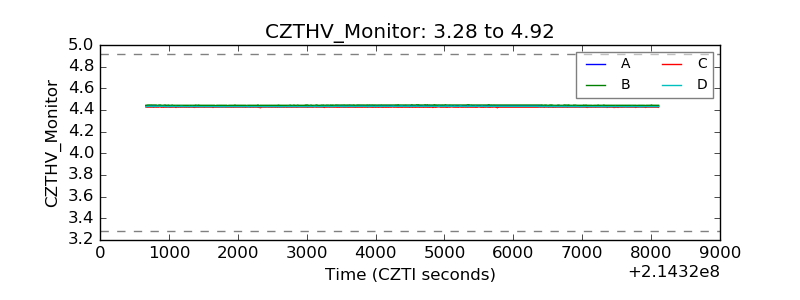 |
| D_VDD | 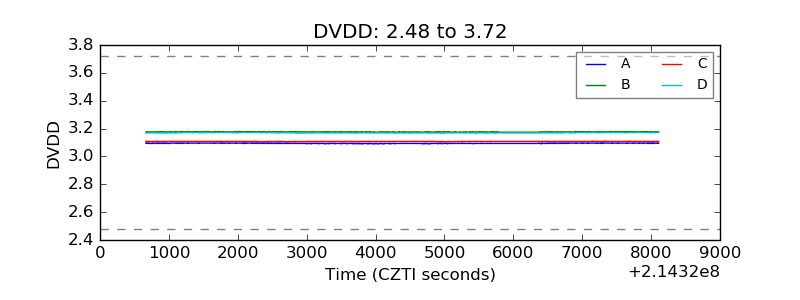 |
| Temperature 1 | 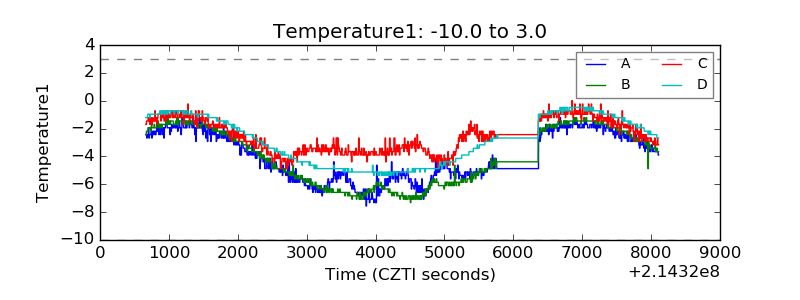 |
| Veto HV Monitor | 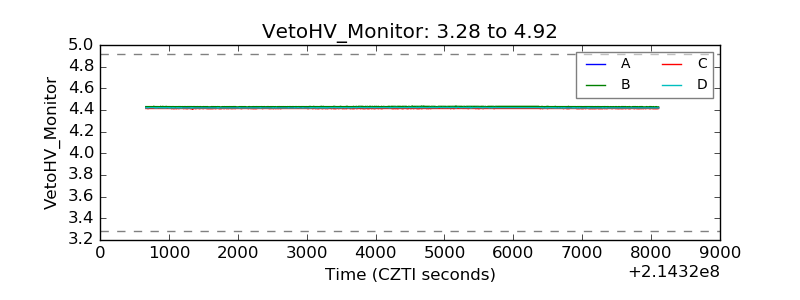 |
| Veto LLD | 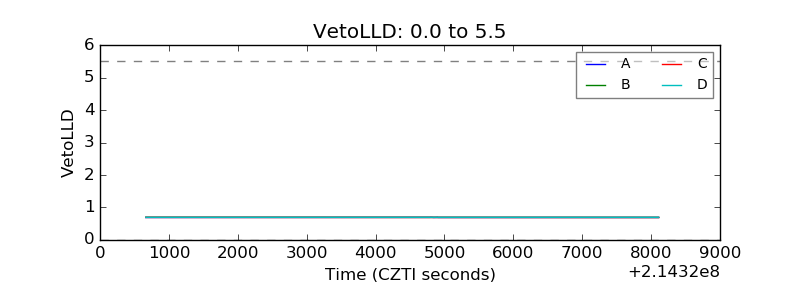 |
| Alpha Counter | 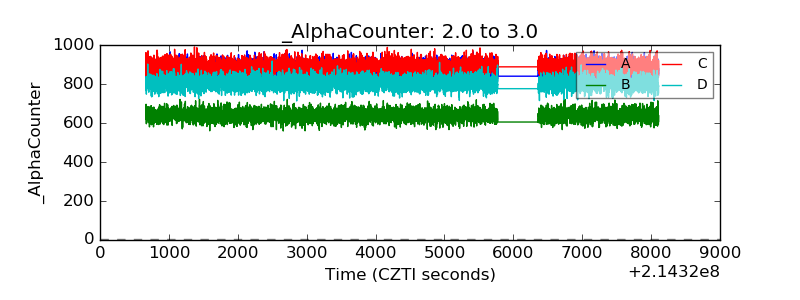 |
| _CPM_Rate | 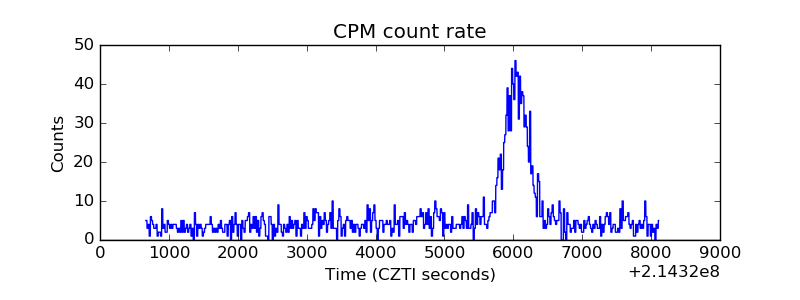 |
| CZT Counter | 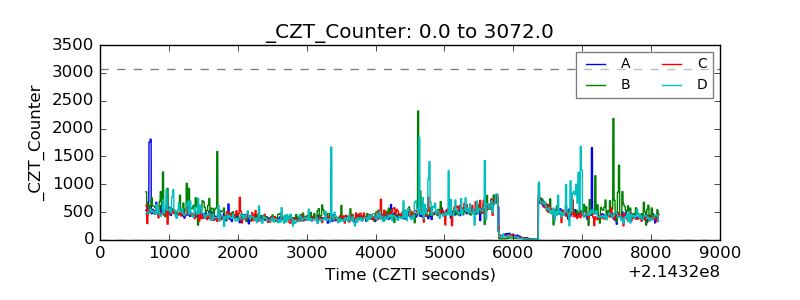 |
| +2.5 Volts monitor |  |
| +5 Volts monitor |  |
| _ROLL_ROT | 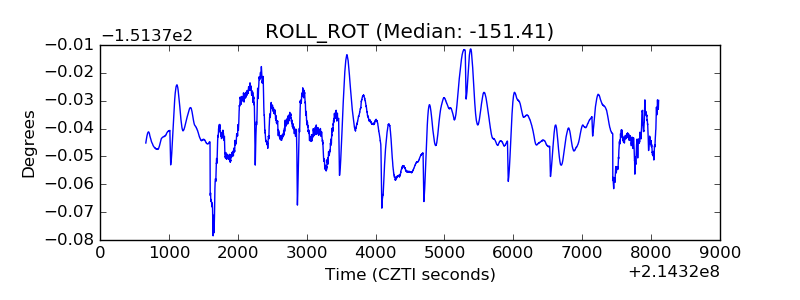 |
| _Roll_DEC | 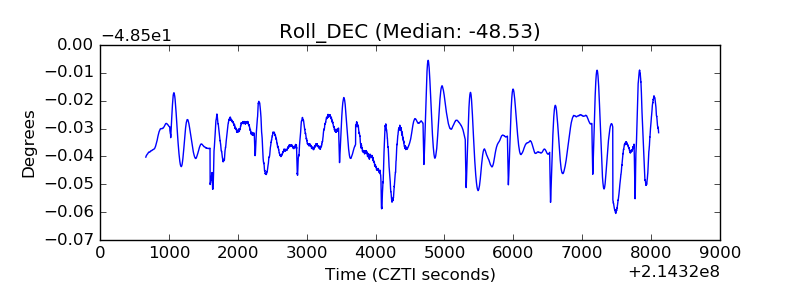 |
| _Roll_RA | 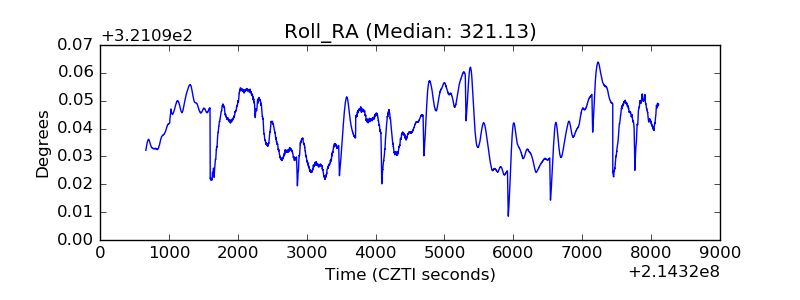 |
| Veto Counter | 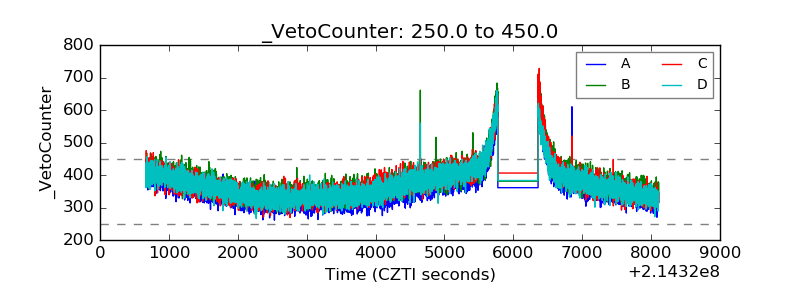 |