| Param | Original file | Final file |
|---|---|---|
| Filename | modeM0/AS1G06_115T01_9000000734_05693cztM0_level2.evt | modeM0/AS1G06_115T01_9000000734_05693cztM0_level2_quad_clean.evt |
| Size (bytes) | 543,090,240 | 90,840,960 |
| Size | 517.9 MB | 86.6 MB |
| Events in quadrant A | 3,317,752 | 568,742 |
| Events in quadrant B | 4,245,510 | 562,846 |
| Events in quadrant C | 3,501,104 | 567,430 |
| Events in quadrant D | 4,875,429 | 531,179 |
| Mode M0 | |||
|---|---|---|---|
| Quadrant | BADHDUFLAG | Total packets | Discarded packets |
| A | 0 | 15306 | 3 |
| B | 0 | 17606 | 2 |
| C | 0 | 15634 | 2 |
| D | 0 | 20049 | 2 |
| Mode SS | |||
|---|---|---|---|
| Quadrant | BADHDUFLAG | Total packets | Discarded packets |
| A | 0 | 152 | 0 |
| B | 0 | 152 | 0 |
| C | 0 | 152 | 0 |
| D | 0 | 152 | 0 |
| Quadrant | Total seconds | Saturated seconds | Saturation percentage |
|---|---|---|---|
| A | 7472 | 47 | 0.629015% |
| B | 7472 | 258 | 3.452891% |
| C | 7472 | 44 | 0.588865% |
| D | 7472 | 453 | 6.062634% |
Noise dominated data is calculated using 1-second bins in cleaned event files. If a bin has >2000 counts, and if more than 50% of those come from <1% of pixels, then it is considered to be noise-dominated and hence unusable.
| Quadrant | # 1 sec bins | Bins with >0 counts | Bins with >2000 counts | High rate bins dominated by noise | Noise dominated (total time) | Noise dominated (detector-on time) | Marked lightcurve |
|---|---|---|---|---|---|---|---|
| A | 7587 | 7474 | 0 | 0 | 0.00% | 0.00% | 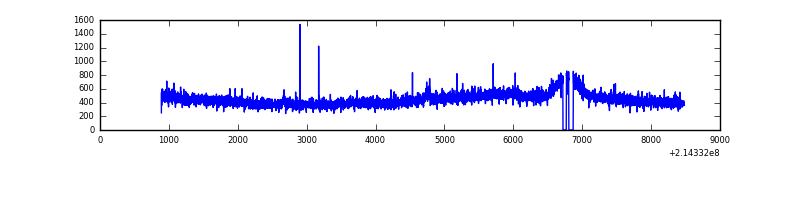 |
| B | 7587 | 7474 | 139 | 139 | 1.83% | 1.86% | 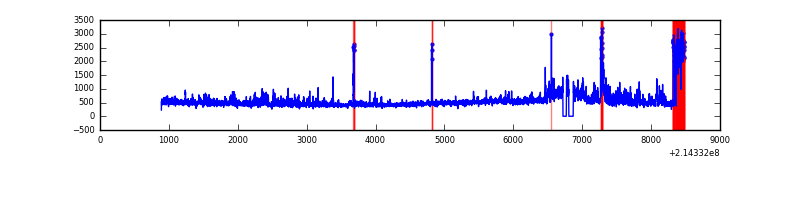 |
| C | 7587 | 7474 | 10 | 10 | 0.13% | 0.13% | 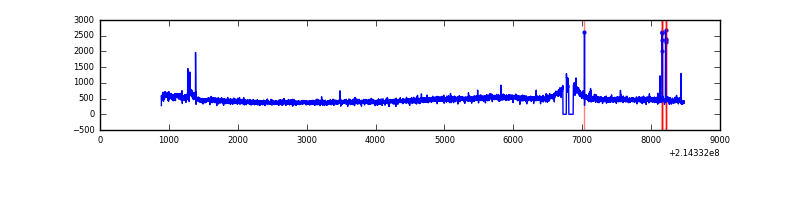 |
| D | 7587 | 7474 | 270 | 270 | 3.56% | 3.61% | 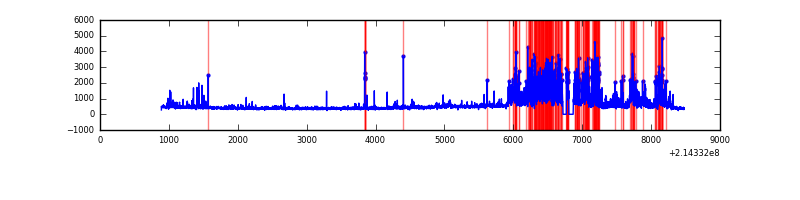 |
Top three noisy pixels from each quadrant. If the there are fewer than three noisy pixels in the level2.evt file, extra rows are filled as -1
| Pixel properties | Quadrant properties | ||||||
|---|---|---|---|---|---|---|---|
| Quadrant | DetID | PixID | Counts | Sigma | Mean | Median | Sigma |
| A | 0 | 50 | 10978 | 58.19 | 851 | 831 | 174.4 |
| A | 13 | 6 | 8893 | 46.23 | 851 | 831 | 174.4 |
| A | 0 | 226 | 8442 | 43.65 | 851 | 831 | 174.4 |
| B | 15 | 204 | 414276 | 2473.15 | 857 | 836 | 167.2 |
| B | 5 | 172 | 353996 | 2112.57 | 857 | 836 | 167.2 |
| B | 11 | 51 | 61133 | 360.69 | 857 | 836 | 167.2 |
| C | 1 | 16 | 205918 | 1075.18 | 821 | 823 | 190.8 |
| C | 3 | 9 | 27089 | 137.7 | 821 | 823 | 190.8 |
| C | 1 | 241 | 25131 | 127.43 | 821 | 823 | 190.8 |
| D | 1 | 239 | 1374922 | 6930.68 | 802 | 775 | 198.3 |
| D | 2 | 152 | 188017 | 944.38 | 802 | 775 | 198.3 |
| D | 6 | 223 | 64163 | 319.71 | 802 | 775 | 198.3 |
Histogram calculated using DETX and DETY for each event in the final _common_clean file
| Quadrant A | 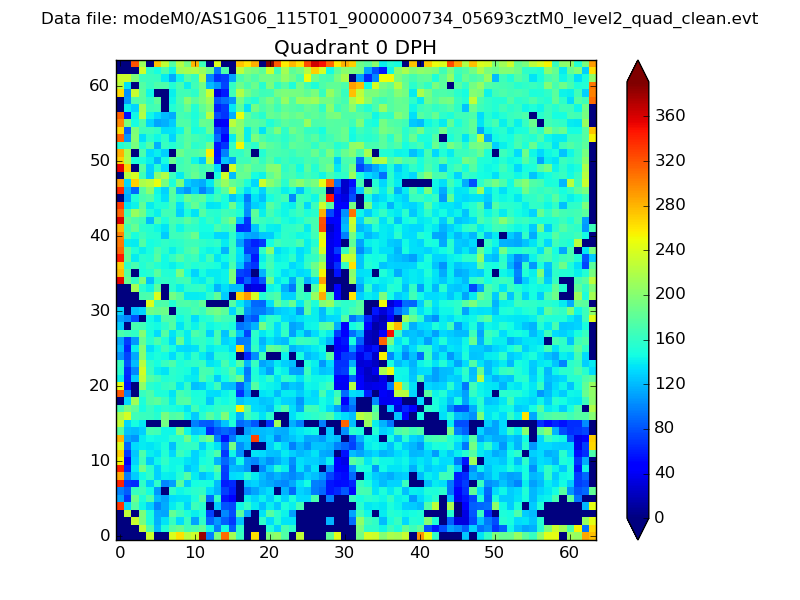 |
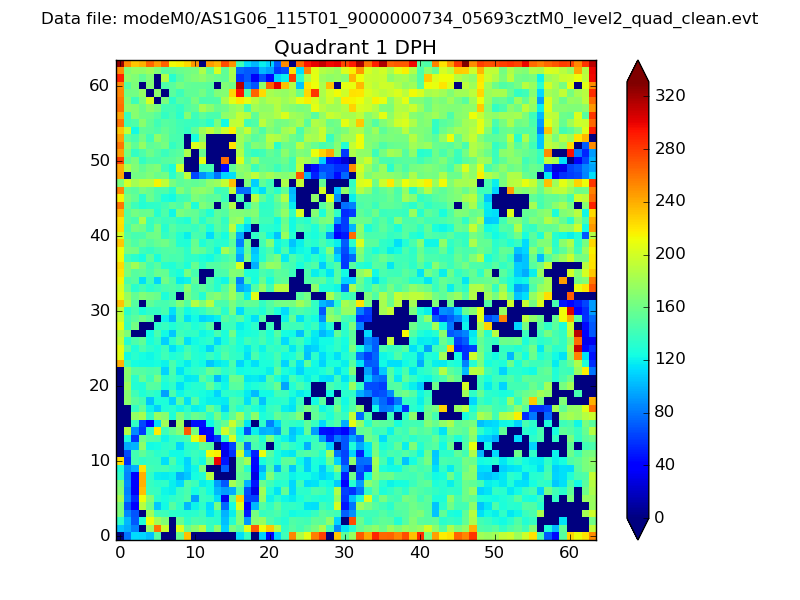 |
Quadrant B |
|---|---|---|---|
| Quadrant D | 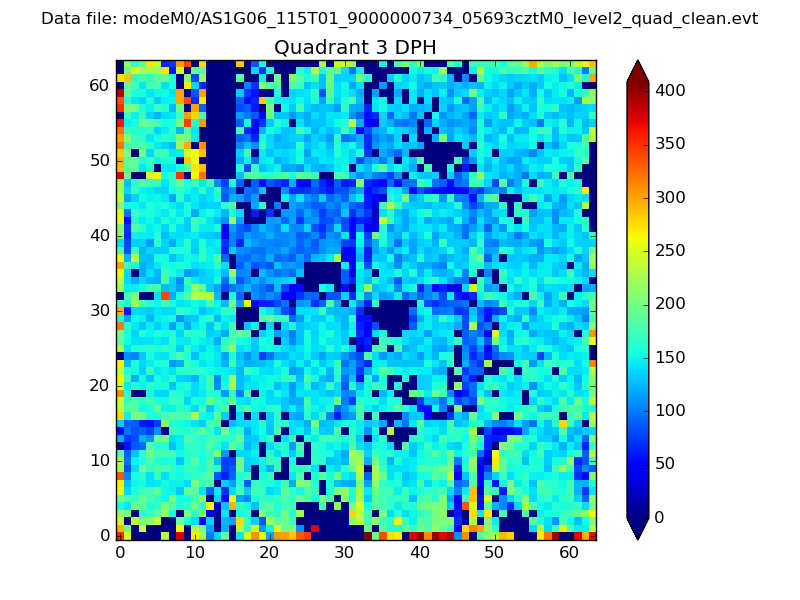 |
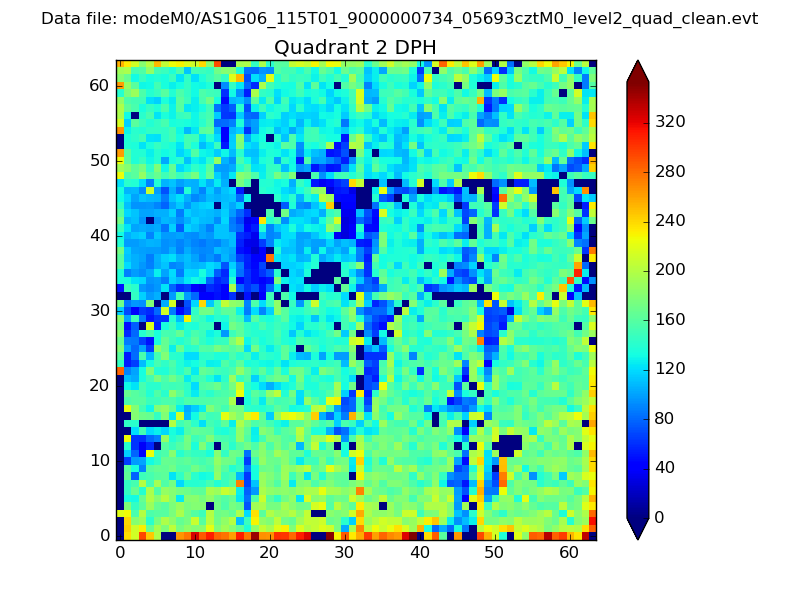 |
Quadrant C |
| Plot type | Count rate plots | Images |
|---|---|---|
| Comparison with Poisson distribution Blue bars denote a histogram of data divided into 1 sec bins. Red curve is a Poisson curve with rate = median count rate of data. |
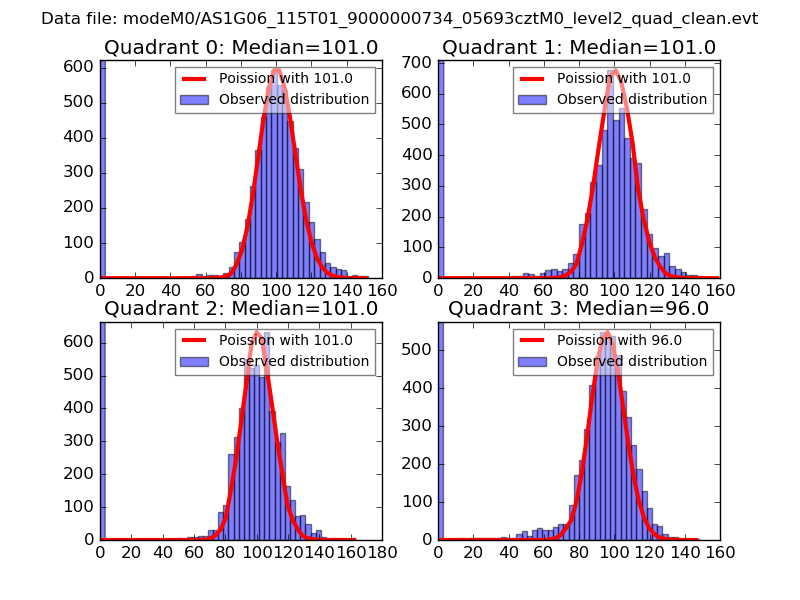 |
 |
| Quadrant-wise count rates Data is divided into 100 sec bins |
 |
|
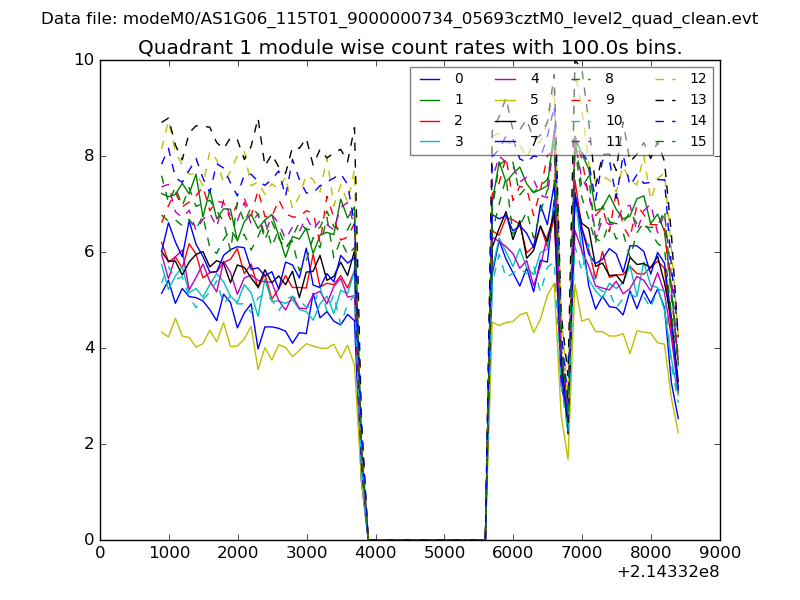
| Module-wise count rates for Quadrant A Data is divided into 100 sec bins |
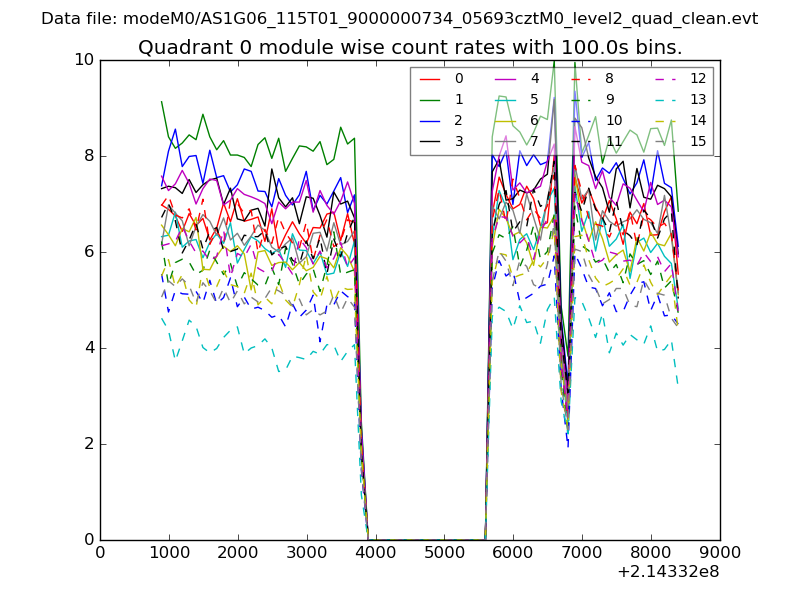 |
 |
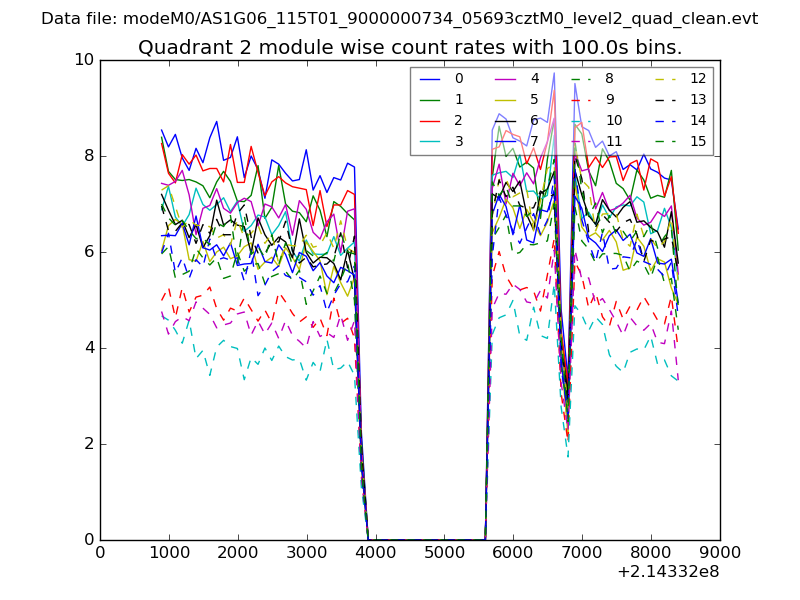
| Module-wise count rates for Quadrant B Data is divided into 100 sec bins |
 |
 |
| Module-wise count rates for Quadrant C Data is divided into 100 sec bins |
 |
 |
| Module-wise count rates for Quadrant D Data is divided into 100 sec bins |
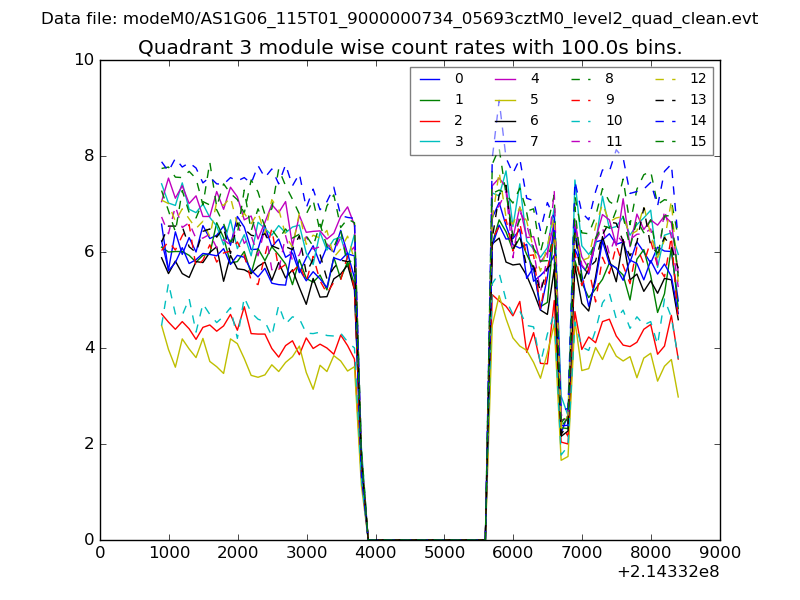 |
 |
| Parameter | Plot |
|---|---|
| CZT HV Monitor | 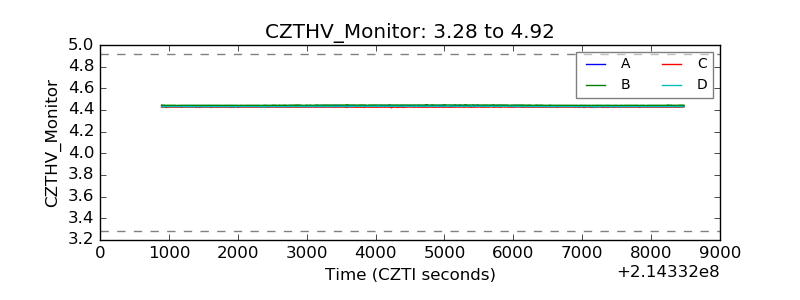 |
| D_VDD | 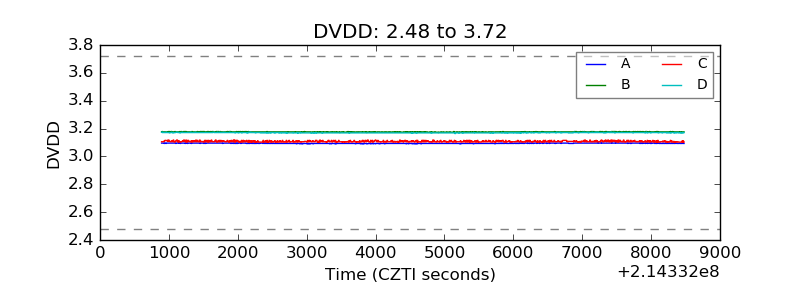 |
| Temperature 1 | 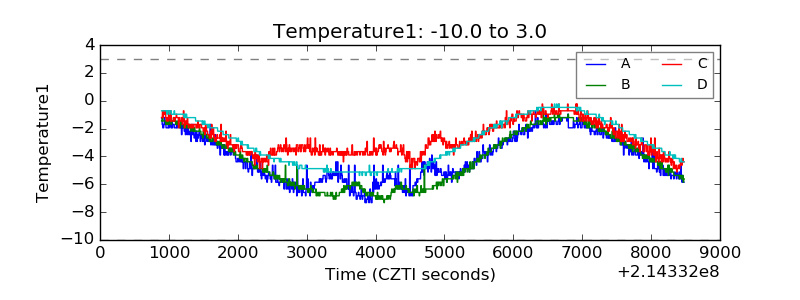 |
| Veto HV Monitor | 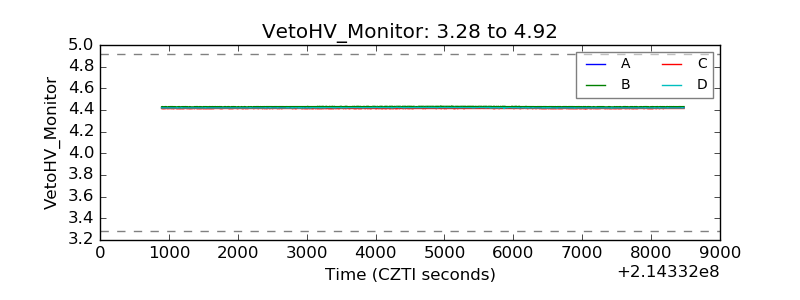 |
| Veto LLD | 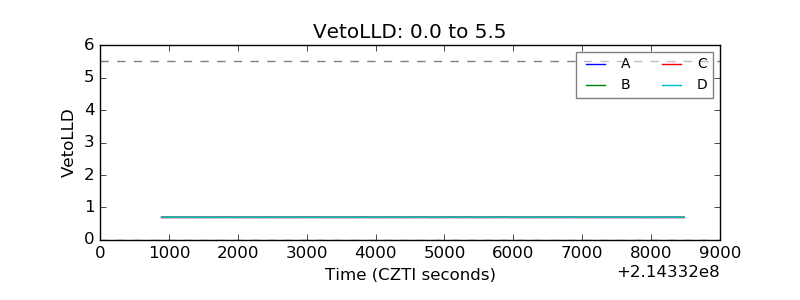 |
| Alpha Counter |  |
| _CPM_Rate | 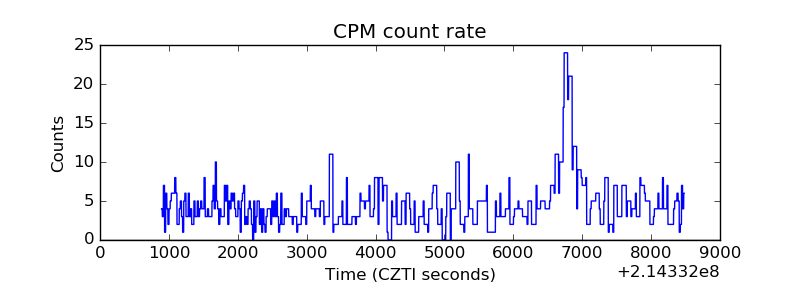 |
| CZT Counter | 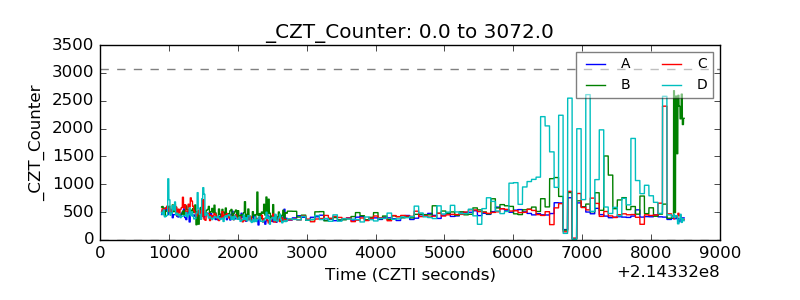 |
| +2.5 Volts monitor |  |
| +5 Volts monitor |  |
| _ROLL_ROT | 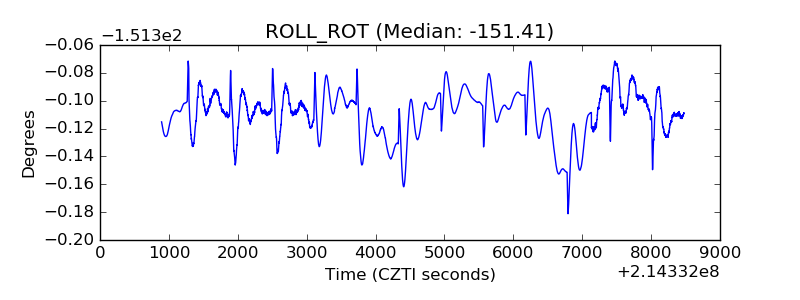 |
| _Roll_DEC | 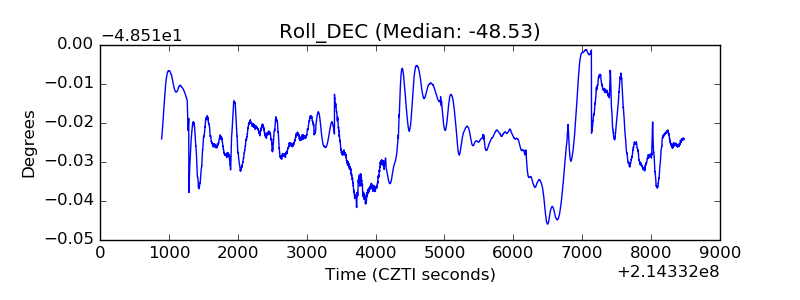 |
| _Roll_RA | 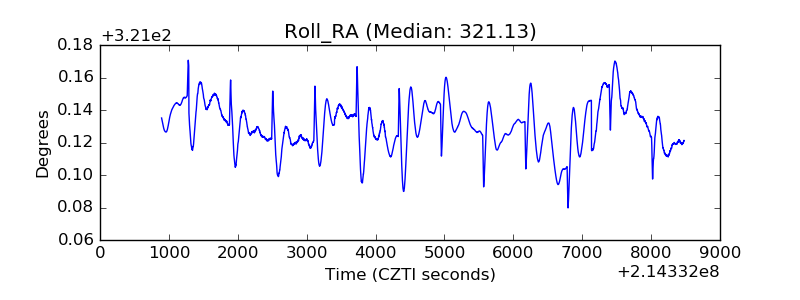 |
| Veto Counter | 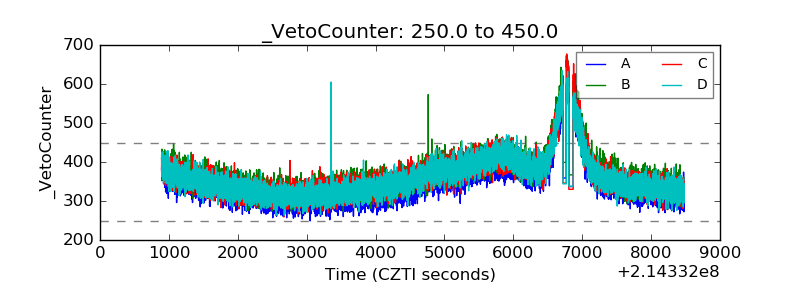 |