| Param | Original file | Final file |
|---|---|---|
| Filename | modeM0/AS1G06_115T01_9000000734_05694cztM0_level2.evt | modeM0/AS1G06_115T01_9000000734_05694cztM0_level2_quad_clean.evt |
| Size (bytes) | 446,889,600 | 67,271,040 |
| Size | 426.2 MB | 64.2 MB |
| Events in quadrant A | 2,674,023 | 416,071 |
| Events in quadrant B | 3,749,683 | 401,050 |
| Events in quadrant C | 2,775,889 | 413,334 |
| Events in quadrant D | 3,930,835 | 391,299 |
| Mode M0 | |||
|---|---|---|---|
| Quadrant | BADHDUFLAG | Total packets | Discarded packets |
| A | 0 | 12199 | 0 |
| B | 0 | 15191 | 0 |
| C | 0 | 12184 | 0 |
| D | 0 | 15919 | 0 |
| Mode M9 | |||
|---|---|---|---|
| Quadrant | BADHDUFLAG | Total packets | Discarded packets |
| A | 0 | 2 | 0 |
| B | 0 | 1 | 0 |
| C | 0 | 1 | 0 |
| D | 0 | 1 | 0 |
| Mode SS | |||
|---|---|---|---|
| Quadrant | BADHDUFLAG | Total packets | Discarded packets |
| A | 0 | 120 | 0 |
| B | 0 | 120 | 0 |
| C | 0 | 120 | 0 |
| D | 0 | 120 | 0 |
| Quadrant | Total seconds | Saturated seconds | Saturation percentage |
|---|---|---|---|
| A | 5941 | 15 | 0.252483% |
| B | 5941 | 318 | 5.352634% |
| C | 5941 | 14 | 0.235651% |
| D | 5941 | 224 | 3.770409% |
Noise dominated data is calculated using 1-second bins in cleaned event files. If a bin has >2000 counts, and if more than 50% of those come from <1% of pixels, then it is considered to be noise-dominated and hence unusable.
| Quadrant | # 1 sec bins | Bins with >0 counts | Bins with >2000 counts | High rate bins dominated by noise | Noise dominated (total time) | Noise dominated (detector-on time) | Marked lightcurve |
|---|---|---|---|---|---|---|---|
| A | 5941 | 5941 | 2 | 2 | 0.03% | 0.03% | 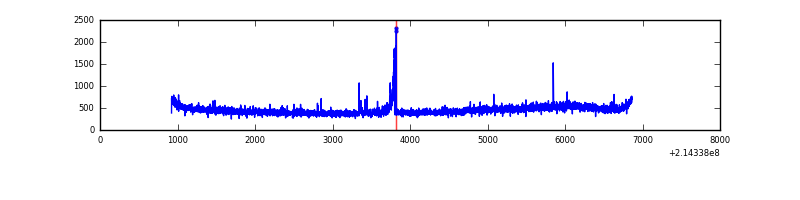 |
| B | 5941 | 5941 | 252 | 252 | 4.24% | 4.24% | 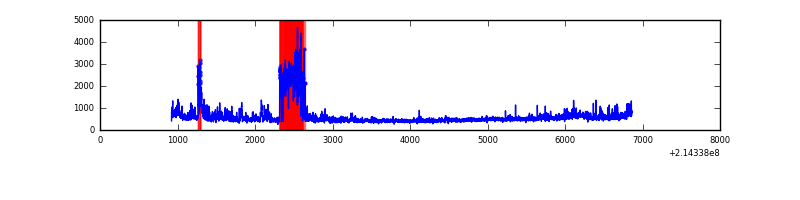 |
| C | 5941 | 5941 | 10 | 10 | 0.17% | 0.17% | 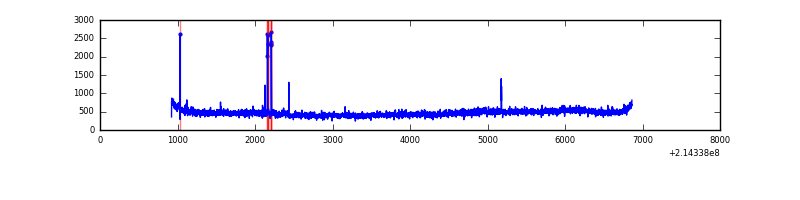 |
| D | 5941 | 5941 | 166 | 166 | 2.79% | 2.79% | 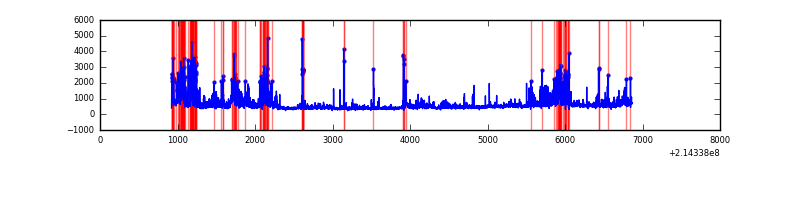 |
Top three noisy pixels from each quadrant. If the there are fewer than three noisy pixels in the level2.evt file, extra rows are filled as -1
| Pixel properties | Quadrant properties | ||||||
|---|---|---|---|---|---|---|---|
| Quadrant | DetID | PixID | Counts | Sigma | Mean | Median | Sigma |
| A | 0 | 50 | 56566 | 402.57 | 674 | 658 | 138.9 |
| A | 0 | 226 | 6577 | 42.62 | 674 | 658 | 138.9 |
| A | 12 | 194 | 6451 | 41.71 | 674 | 658 | 138.9 |
| B | 5 | 172 | 679356 | 5226.86 | 672 | 656 | 129.8 |
| B | 15 | 204 | 372194 | 2861.32 | 672 | 656 | 129.8 |
| B | 0 | 214 | 35678 | 269.71 | 672 | 656 | 129.8 |
| C | 1 | 16 | 162019 | 1066.85 | 652 | 656 | 151.3 |
| C | 1 | 241 | 25155 | 161.97 | 652 | 656 | 151.3 |
| C | 8 | 128 | 15228 | 96.34 | 652 | 656 | 151.3 |
| D | 1 | 239 | 820040 | 5122.47 | 646 | 622 | 160.0 |
| D | 12 | 233 | 247250 | 1541.76 | 646 | 622 | 160.0 |
| D | 2 | 152 | 200245 | 1247.91 | 646 | 622 | 160.0 |
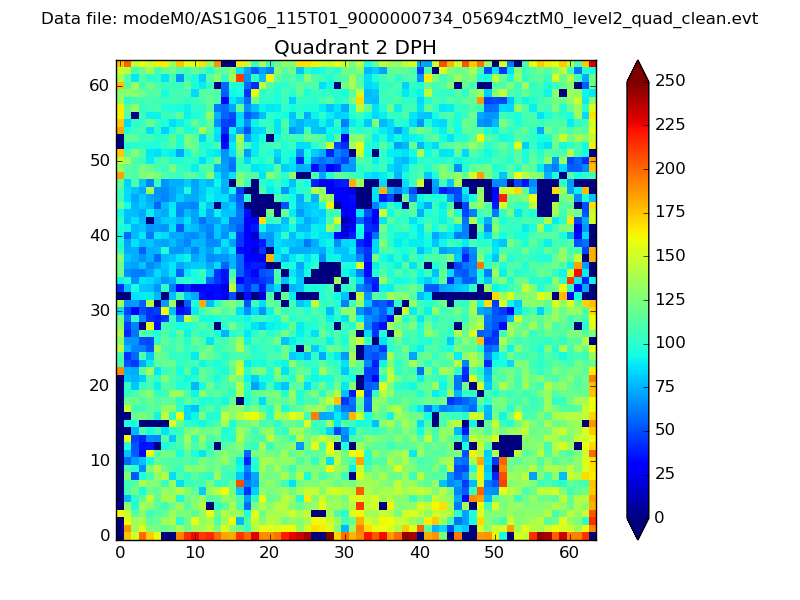
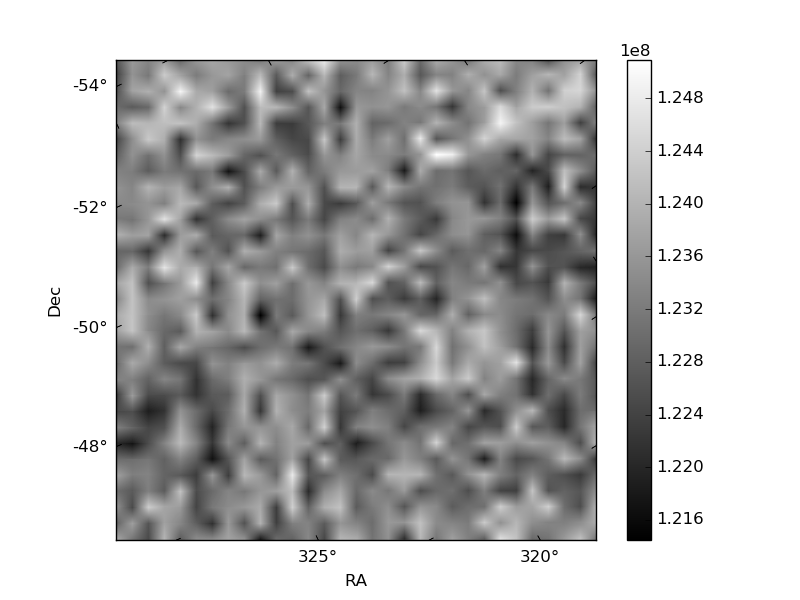
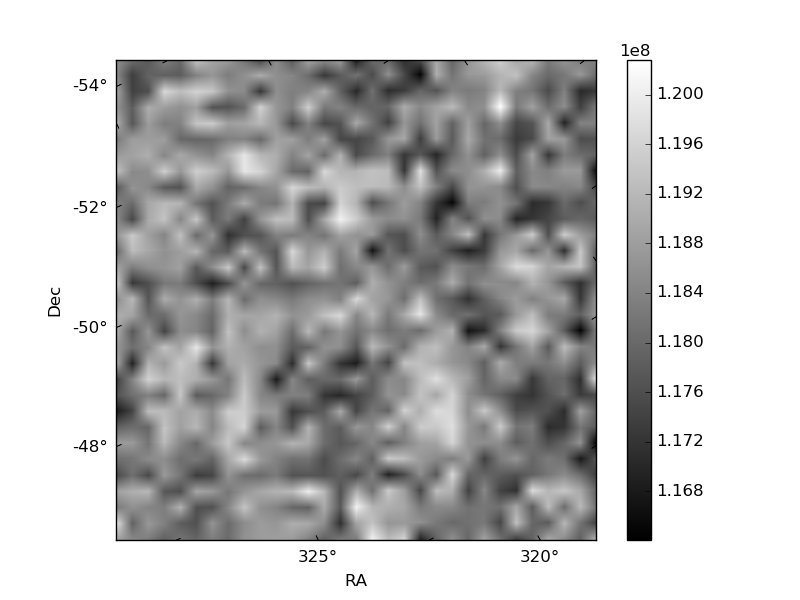
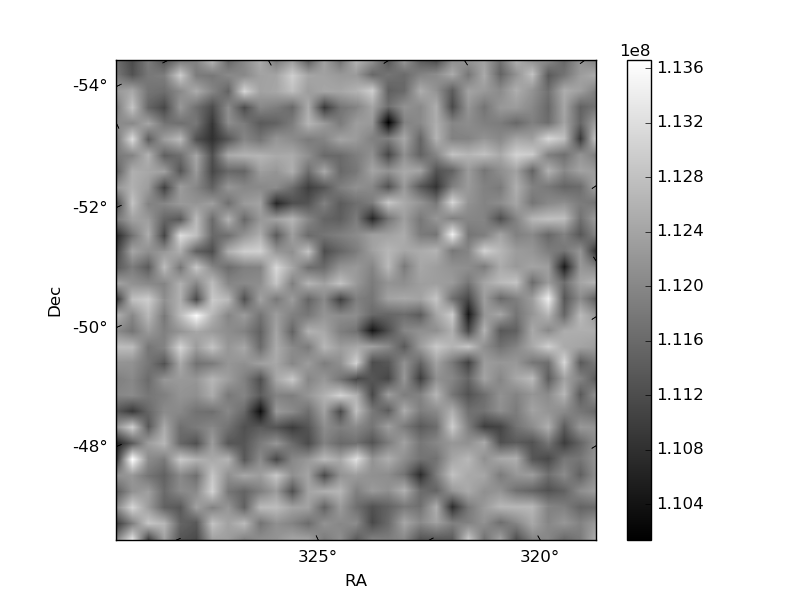
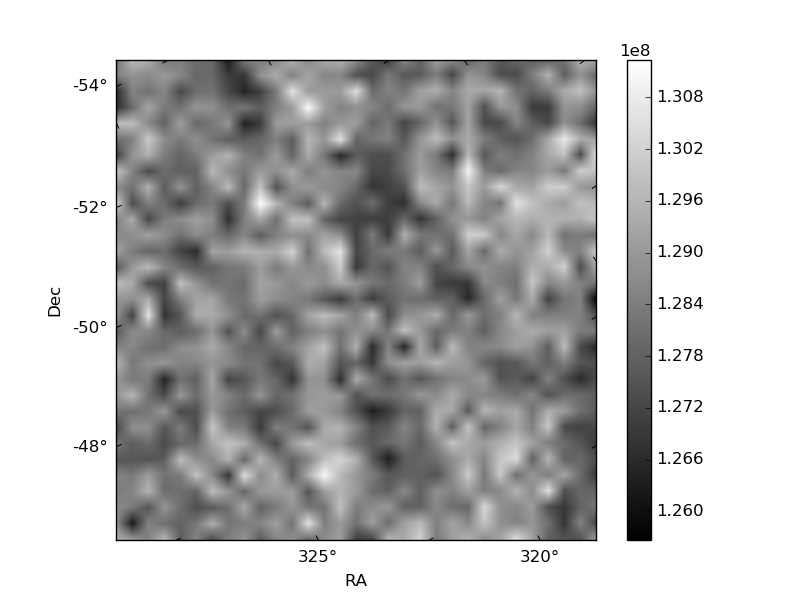
Histogram calculated using DETX and DETY for each event in the final _common_clean file
| Quadrant A | 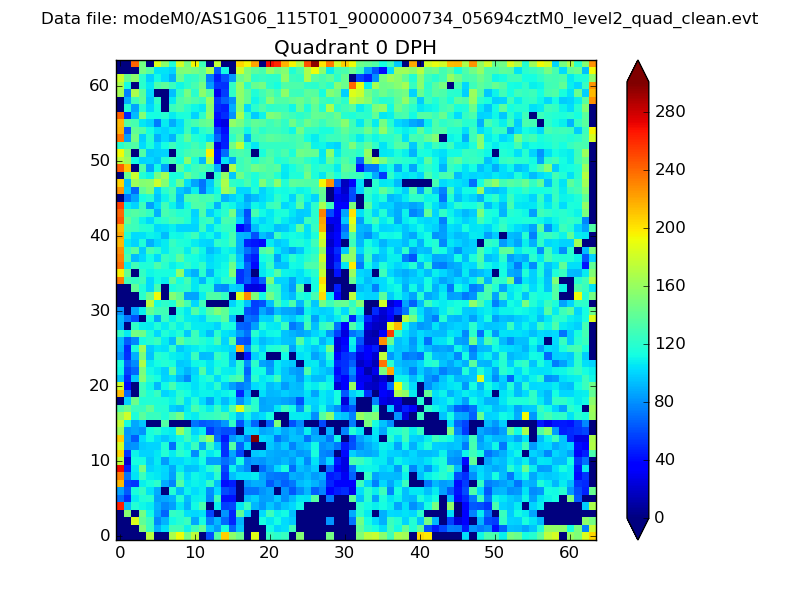 |
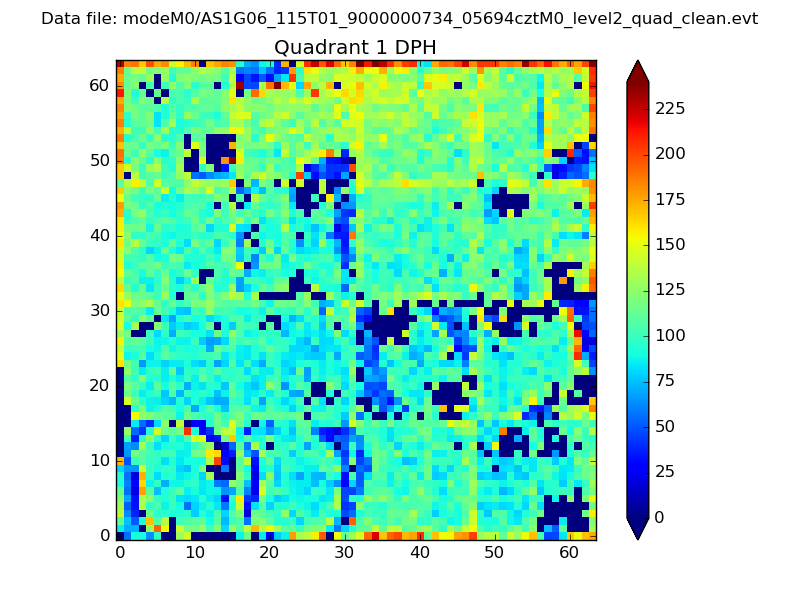 |
Quadrant B |
|---|---|---|---|
| Quadrant D | 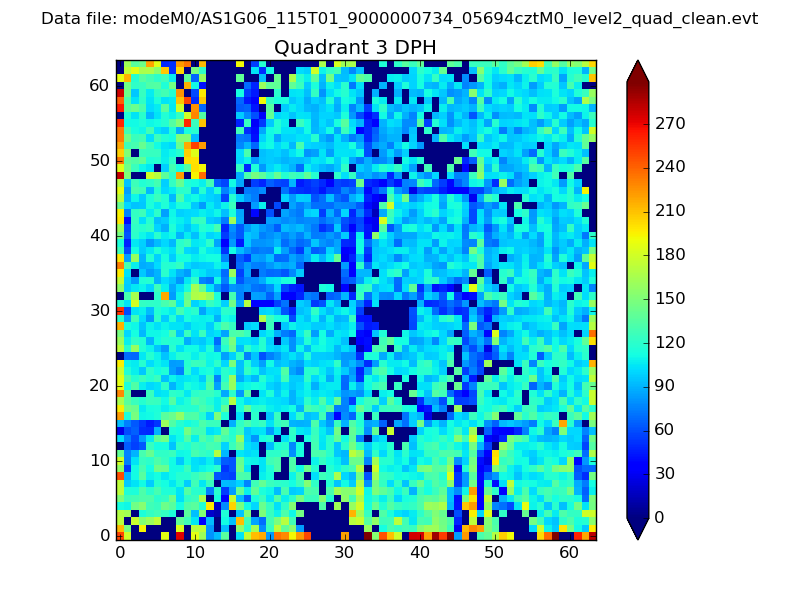 |
 |
Quadrant C |
| Plot type | Count rate plots | Images |
|---|---|---|
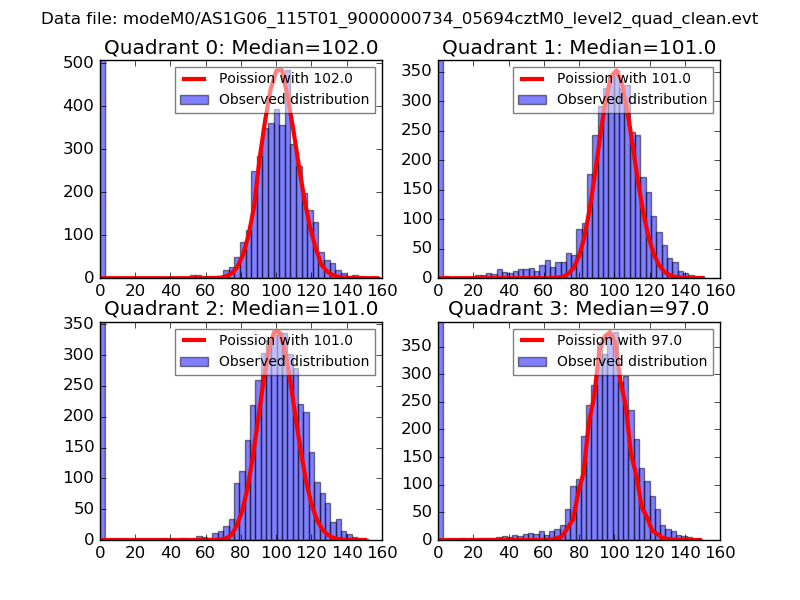
| Comparison with Poisson distribution Blue bars denote a histogram of data divided into 1 sec bins. Red curve is a Poisson curve with rate = median count rate of data. |
 |
 |
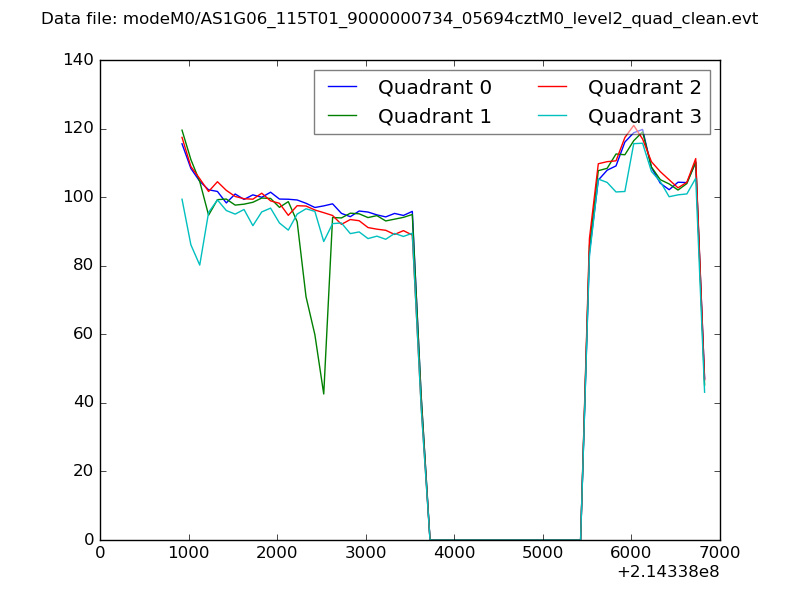
| Quadrant-wise count rates Data is divided into 100 sec bins |
 |
|
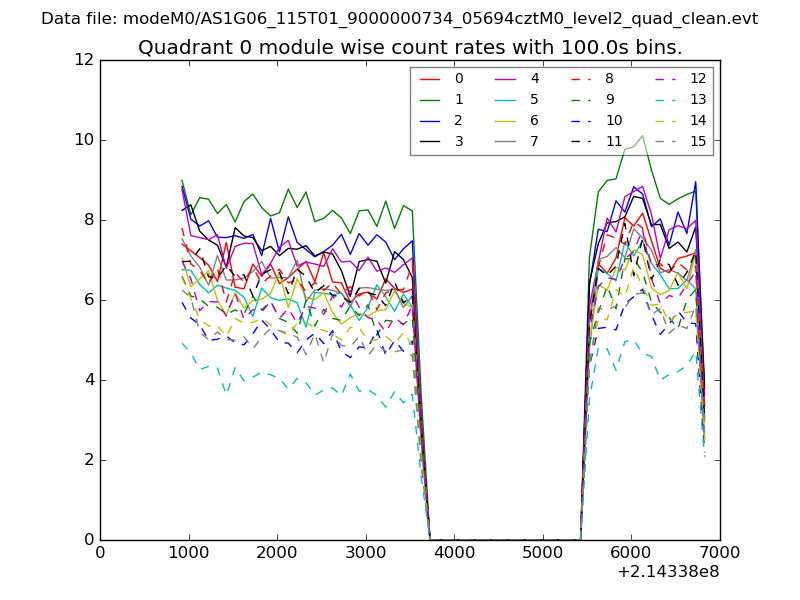
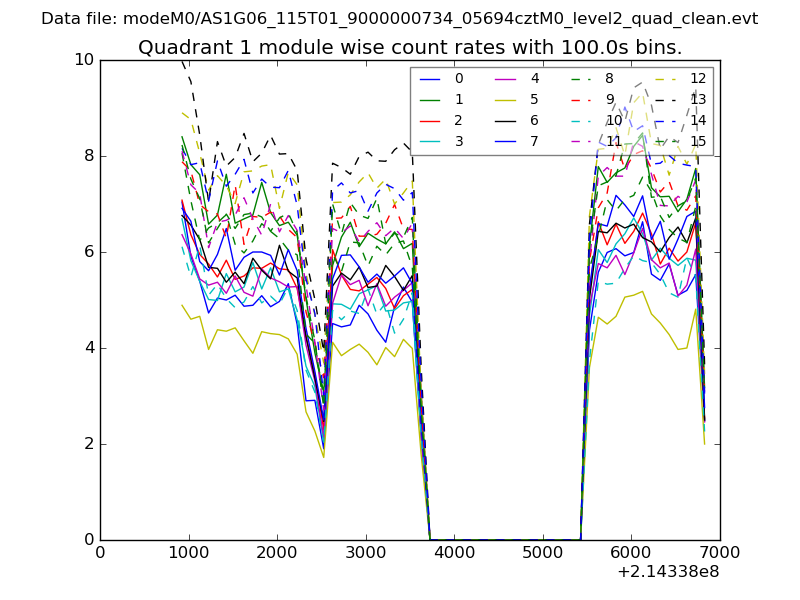
| Module-wise count rates for Quadrant A Data is divided into 100 sec bins |
 |
 |
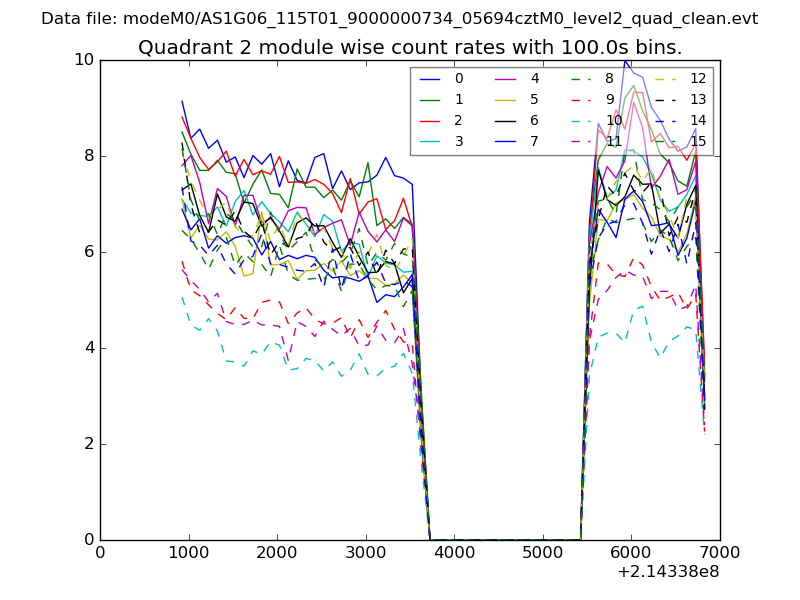
| Module-wise count rates for Quadrant B Data is divided into 100 sec bins |
 |
 |
| Module-wise count rates for Quadrant C Data is divided into 100 sec bins |
 |
 |
| Module-wise count rates for Quadrant D Data is divided into 100 sec bins |
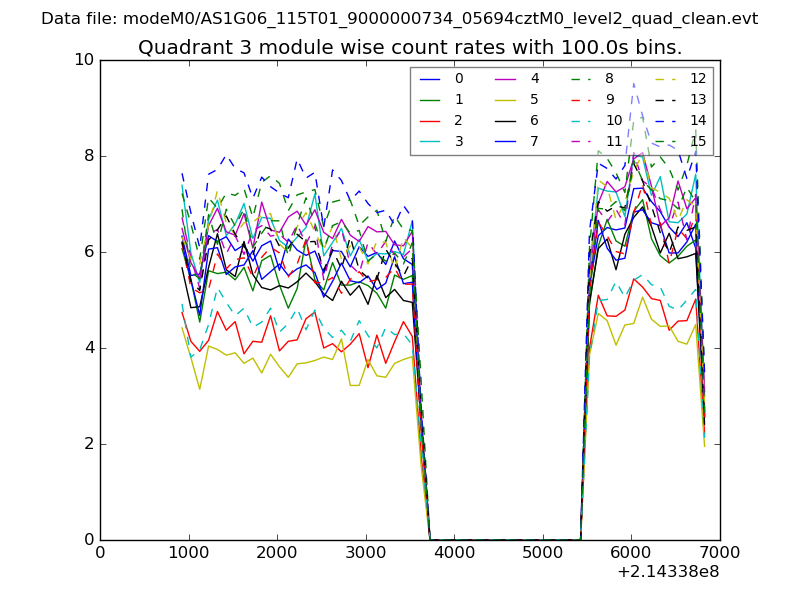 |
 |
| Parameter | Plot |
|---|---|
| CZT HV Monitor | 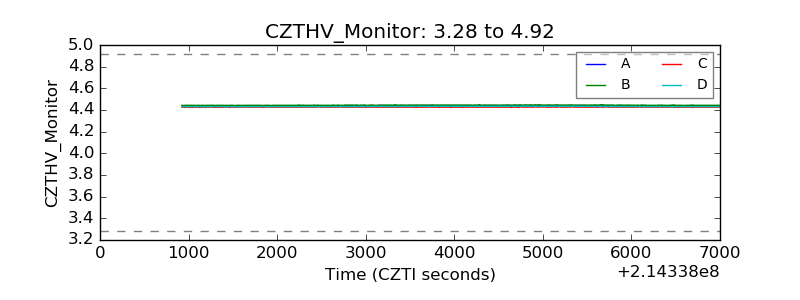 |
| D_VDD | 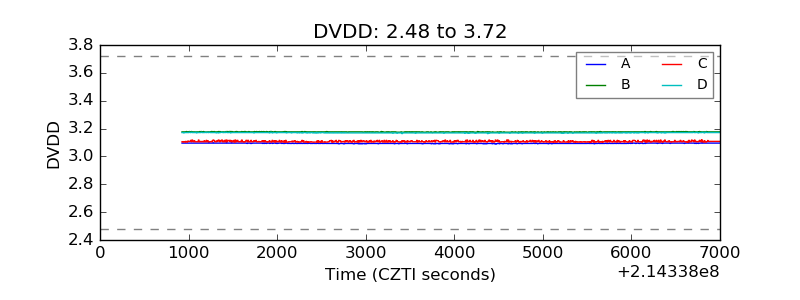 |
| Temperature 1 | 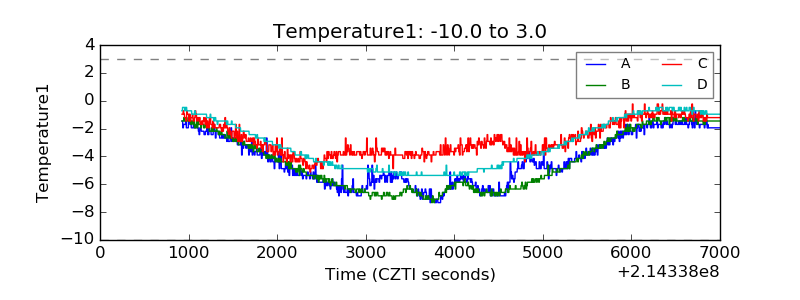 |
| Veto HV Monitor | 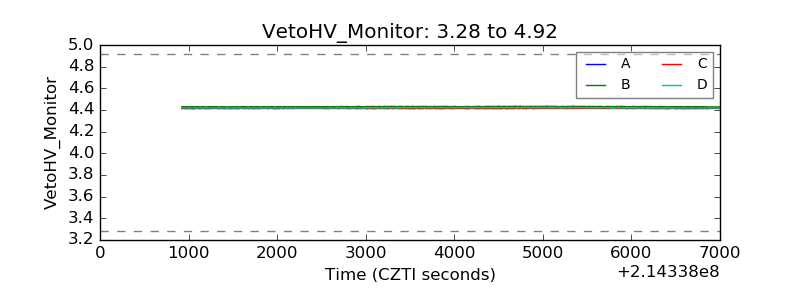 |
| Veto LLD | 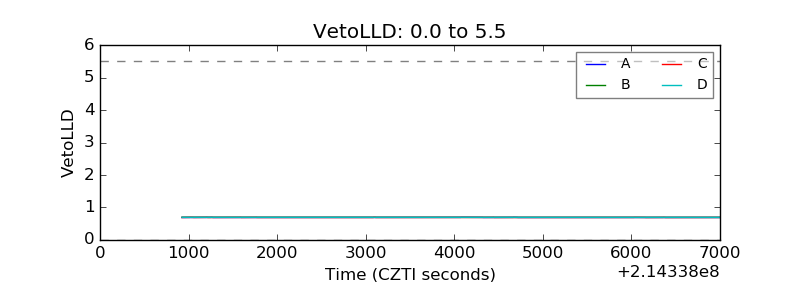 |
| Alpha Counter | 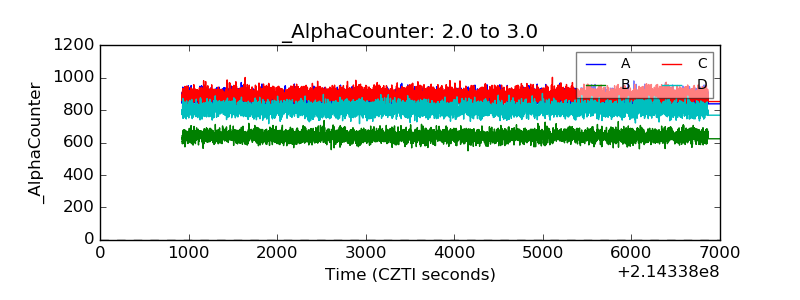 |
| _CPM_Rate | 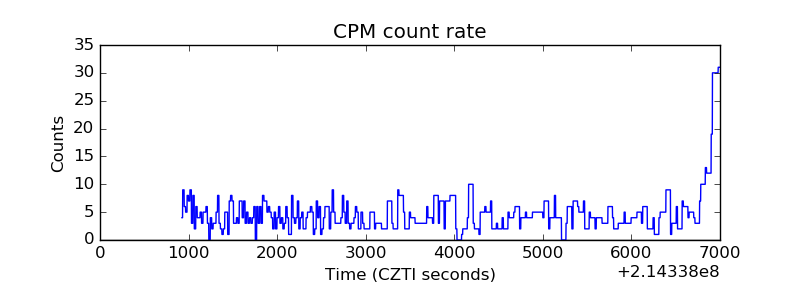 |
| CZT Counter | 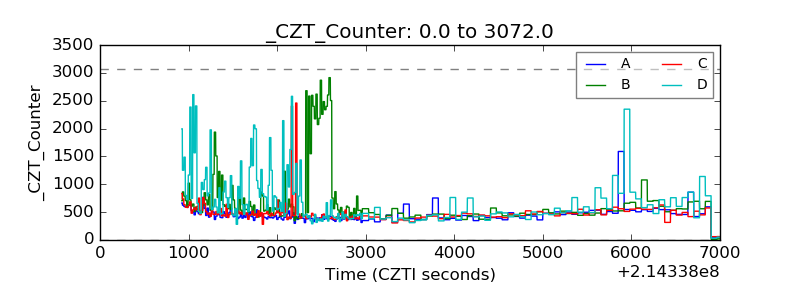 |
| +2.5 Volts monitor |  |
| +5 Volts monitor |  |
| _ROLL_ROT | 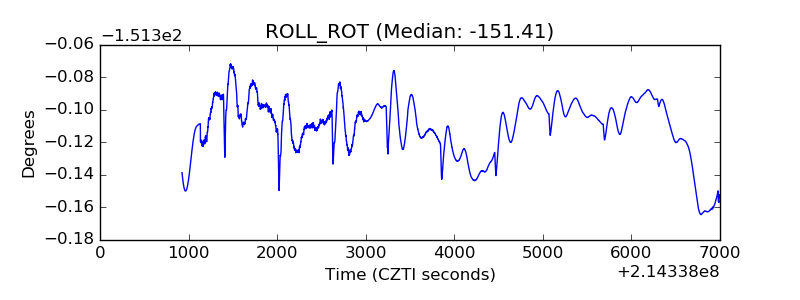 |
| _Roll_DEC | 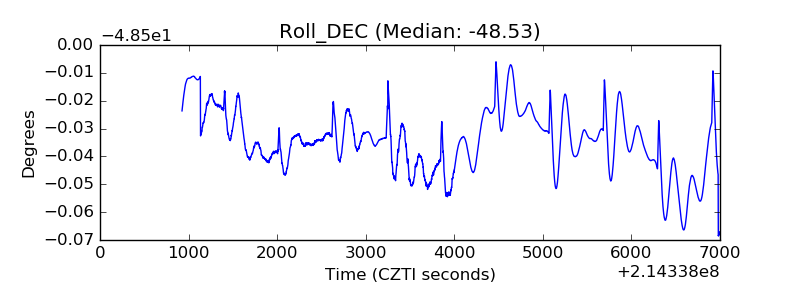 |
| _Roll_RA | 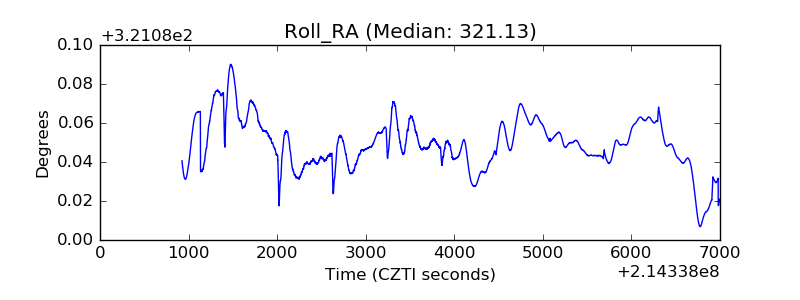 |
| Veto Counter | 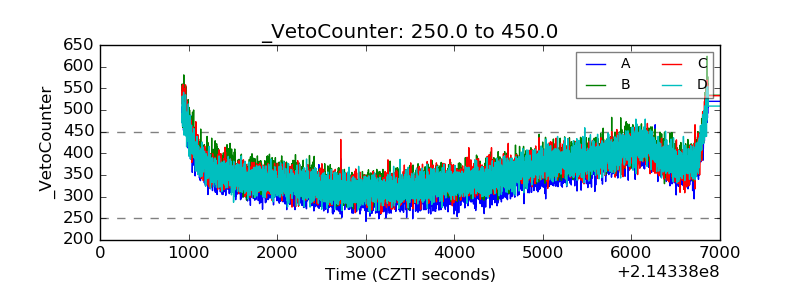 |