| Param | Original file | Final file |
|---|---|---|
| Filename | modeM0/AS1G06_115T01_9000000734_05696cztM0_level2.evt | modeM0/AS1G06_115T01_9000000734_05696cztM0_level2_quad_clean.evt |
| Size (bytes) | 839,753,280 | 148,852,800 |
| Size | 800.9 MB | 142.0 MB |
| Events in quadrant A | 5,593,827 | 911,137 |
| Events in quadrant B | 6,084,729 | 915,254 |
| Events in quadrant C | 5,802,650 | 909,737 |
| Events in quadrant D | 7,078,914 | 882,548 |
| Mode M0 | |||
|---|---|---|---|
| Quadrant | BADHDUFLAG | Total packets | Discarded packets |
| A | 0 | 25994 | 4 |
| B | 0 | 26998 | 3 |
| C | 0 | 26301 | 3 |
| D | 0 | 30223 | 3 |
| Mode M9 | |||
|---|---|---|---|
| Quadrant | BADHDUFLAG | Total packets | Discarded packets |
| A | 0 | 17 | 0 |
| B | 0 | 17 | 0 |
| C | 0 | 17 | 0 |
| D | 0 | 17 | 0 |
| Mode SS | |||
|---|---|---|---|
| Quadrant | BADHDUFLAG | Total packets | Discarded packets |
| A | 0 | 264 | 0 |
| B | 0 | 264 | 0 |
| C | 0 | 264 | 0 |
| D | 0 | 264 | 0 |
| Quadrant | Total seconds | Saturated seconds | Saturation percentage |
|---|---|---|---|
| A | 12867 | 34 | 0.264242% |
| B | 12867 | 62 | 0.481853% |
| C | 12867 | 48 | 0.373047% |
| D | 12867 | 315 | 2.448123% |
Noise dominated data is calculated using 1-second bins in cleaned event files. If a bin has >2000 counts, and if more than 50% of those come from <1% of pixels, then it is considered to be noise-dominated and hence unusable.
| Quadrant | # 1 sec bins | Bins with >0 counts | Bins with >2000 counts | High rate bins dominated by noise | Noise dominated (total time) | Noise dominated (detector-on time) | Marked lightcurve |
|---|---|---|---|---|---|---|---|
| A | 14582 | 12870 | 0 | 0 | 0.00% | 0.00% | 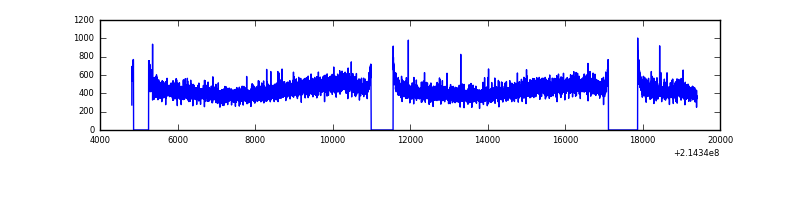 |
| B | 14582 | 12870 | 9 | 9 | 0.06% | 0.07% | 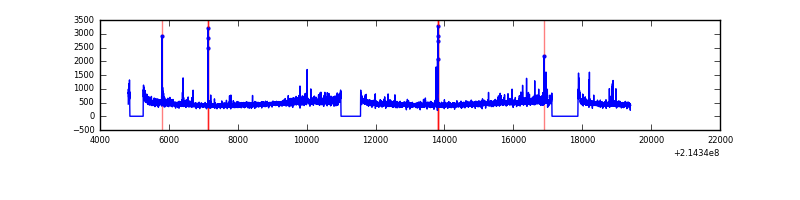 |
| C | 14582 | 12870 | 7 | 7 | 0.05% | 0.05% | 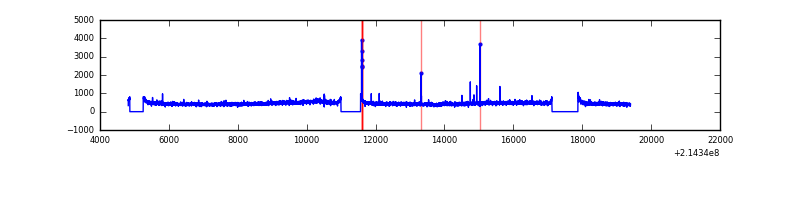 |
| D | 14582 | 12870 | 230 | 230 | 1.58% | 1.79% | 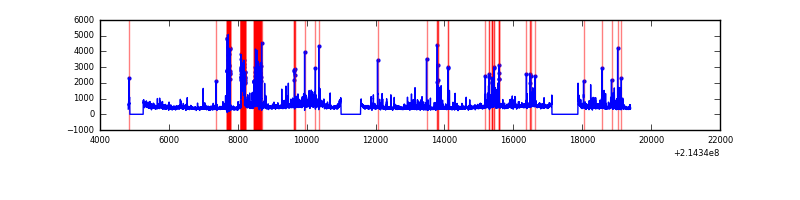 |
Top three noisy pixels from each quadrant. If the there are fewer than three noisy pixels in the level2.evt file, extra rows are filled as -1
| Pixel properties | Quadrant properties | ||||||
|---|---|---|---|---|---|---|---|
| Quadrant | DetID | PixID | Counts | Sigma | Mean | Median | Sigma |
| A | 0 | 226 | 13950 | 41.93 | 1447 | 1413 | 299.0 |
| A | 12 | 194 | 13643 | 40.9 | 1447 | 1413 | 299.0 |
| A | 13 | 6 | 12513 | 37.12 | 1447 | 1413 | 299.0 |
| B | 15 | 204 | 152769 | 543.54 | 1464 | 1429 | 278.4 |
| B | 0 | 214 | 66847 | 234.95 | 1464 | 1429 | 278.4 |
| B | 4 | 48 | 60810 | 213.27 | 1464 | 1429 | 278.4 |
| C | 1 | 16 | 261462 | 803.35 | 1406 | 1412 | 323.7 |
| C | 3 | 9 | 20969 | 60.42 | 1406 | 1412 | 323.7 |
| C | 1 | 241 | 19524 | 55.95 | 1406 | 1412 | 323.7 |
| D | 2 | 152 | 514390 | 1517.71 | 1386 | 1342 | 338.0 |
| D | 9 | 35 | 431466 | 1272.4 | 1386 | 1342 | 338.0 |
| D | 2 | 14 | 329966 | 972.14 | 1386 | 1342 | 338.0 |
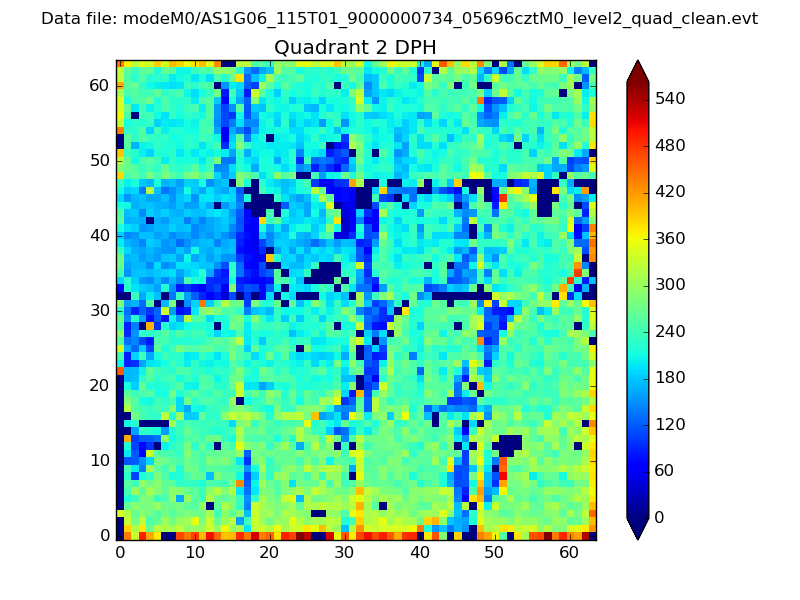
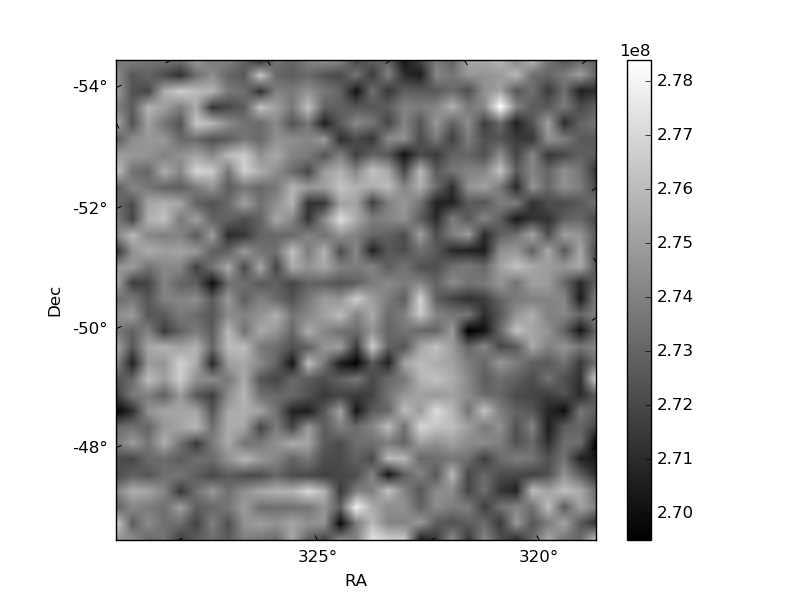
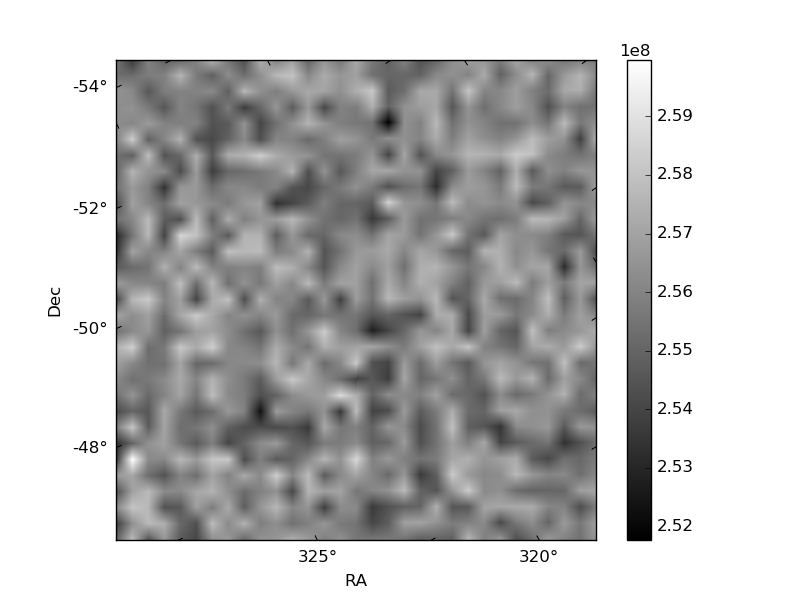
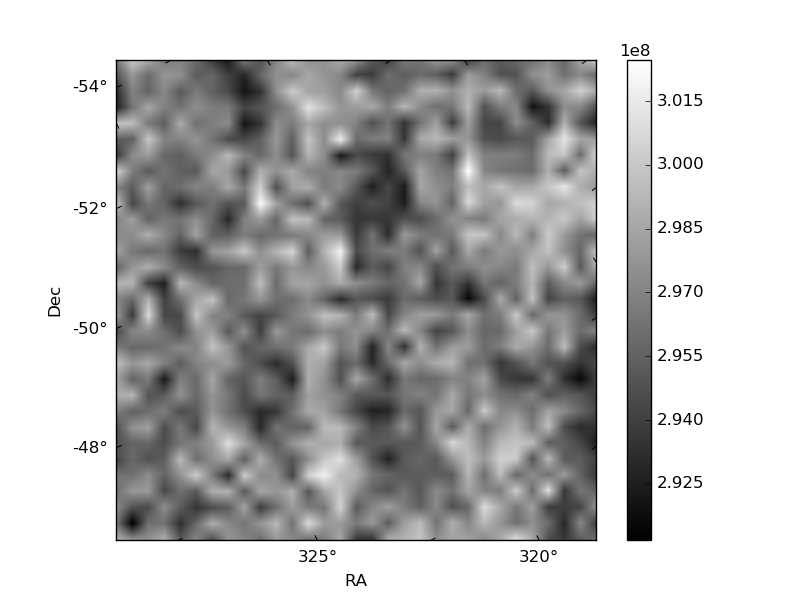
Histogram calculated using DETX and DETY for each event in the final _common_clean file
| Quadrant A | 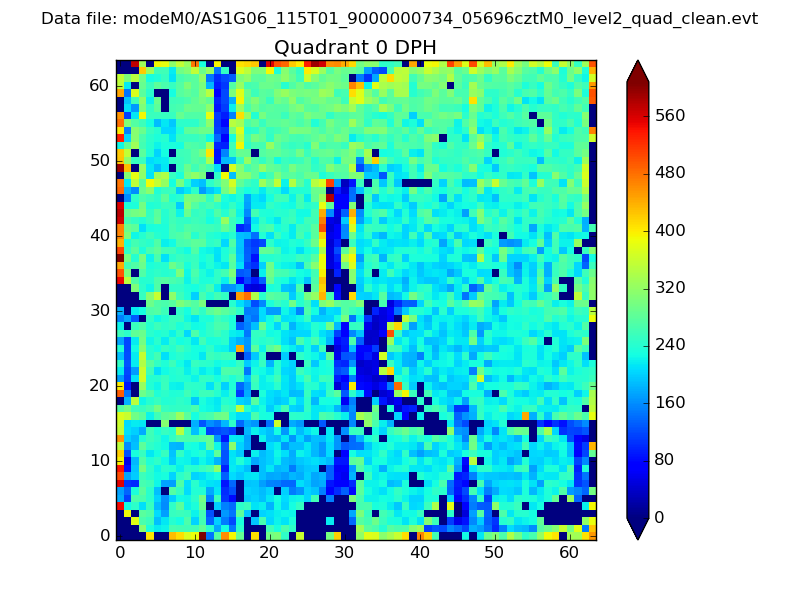 |
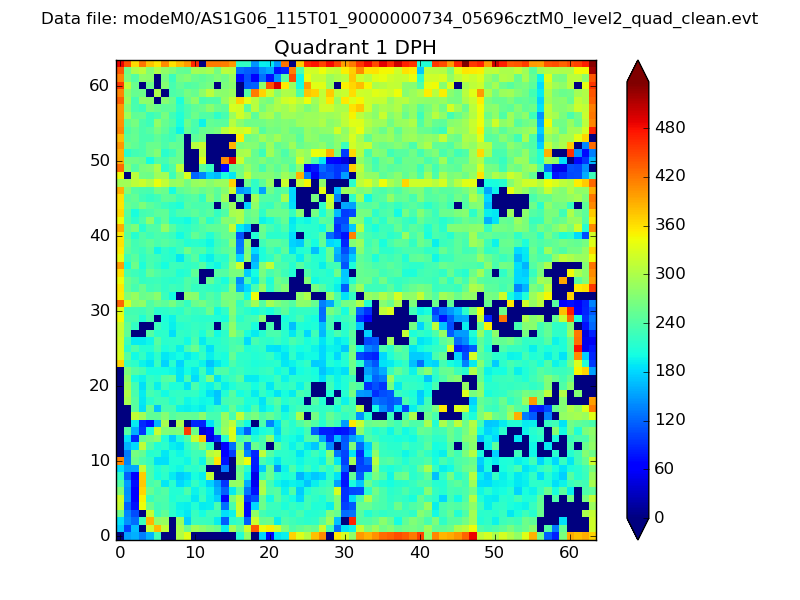 |
Quadrant B |
|---|---|---|---|
| Quadrant D | 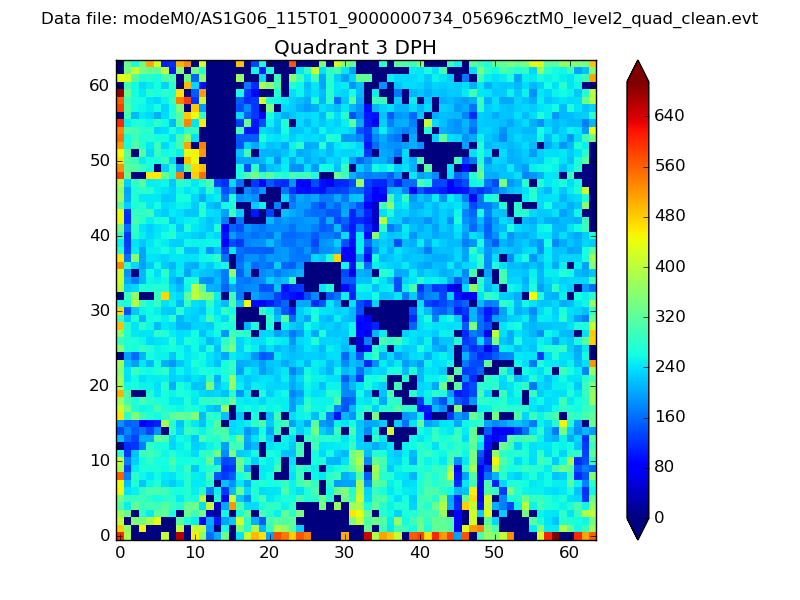 |
 |
Quadrant C |
| Plot type | Count rate plots | Images |
|---|---|---|
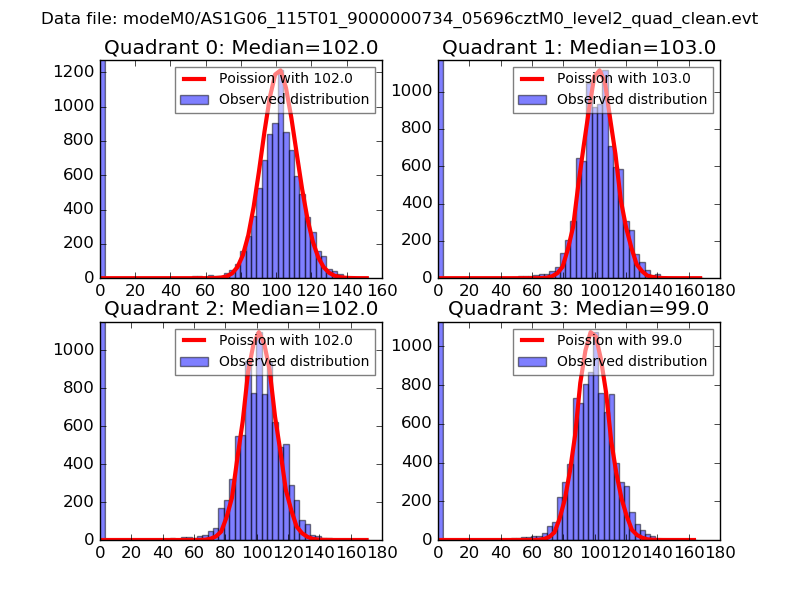
| Comparison with Poisson distribution Blue bars denote a histogram of data divided into 1 sec bins. Red curve is a Poisson curve with rate = median count rate of data. |
 |
 |
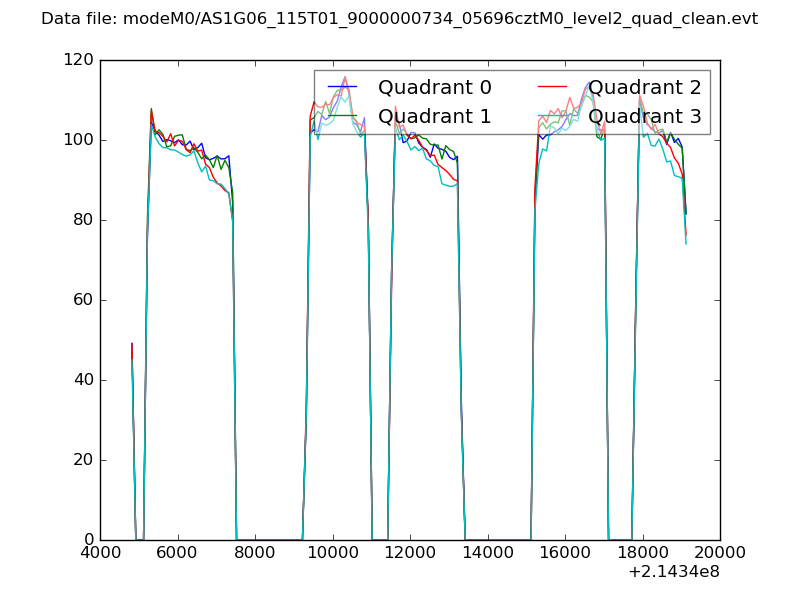
| Quadrant-wise count rates Data is divided into 100 sec bins |
 |
|
| Module-wise count rates for Quadrant A Data is divided into 100 sec bins |
 |
 |
| Module-wise count rates for Quadrant B Data is divided into 100 sec bins |
 |
 |
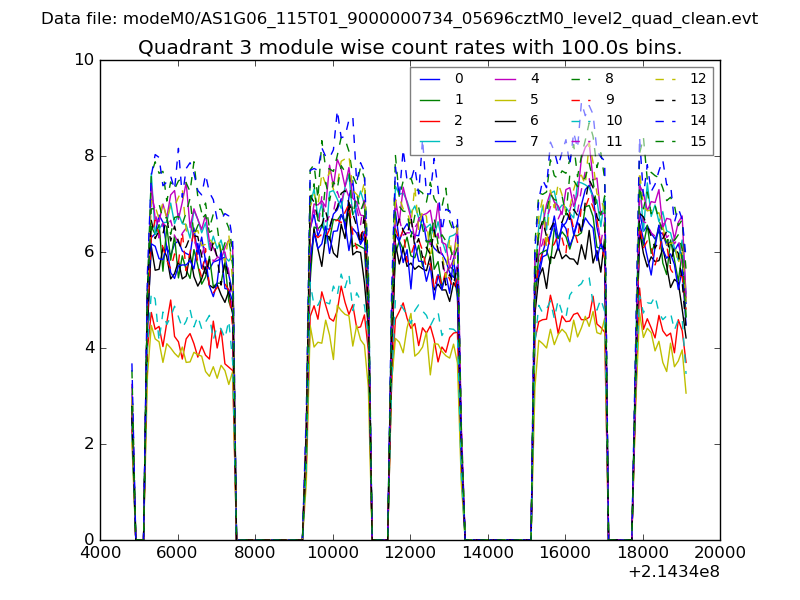
| Module-wise count rates for Quadrant C Data is divided into 100 sec bins |
 |
 |
| Module-wise count rates for Quadrant D Data is divided into 100 sec bins |
 |
 |
| Parameter | Plot |
|---|---|
| CZT HV Monitor |  |
| D_VDD | 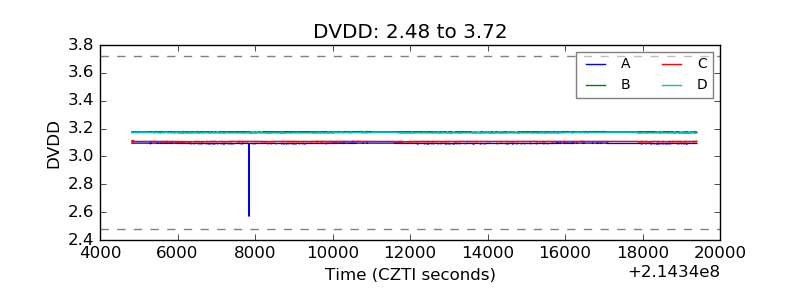 |
| Temperature 1 | 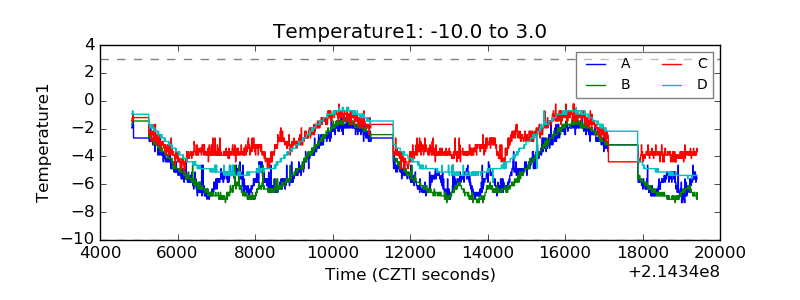 |
| Veto HV Monitor | 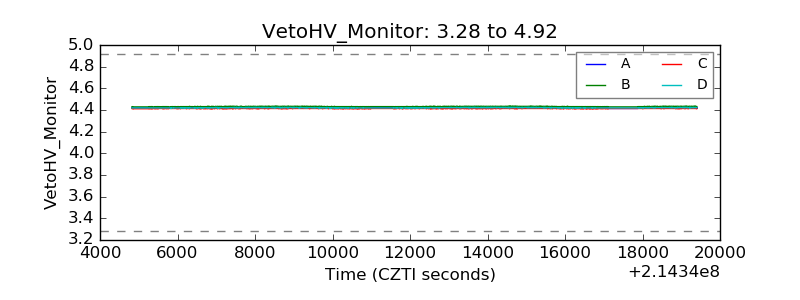 |
| Veto LLD | 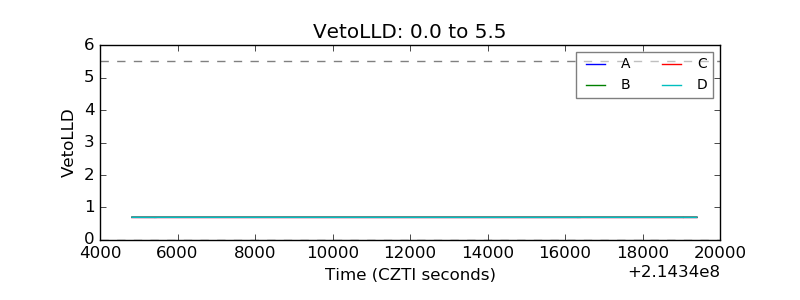 |
| Alpha Counter | 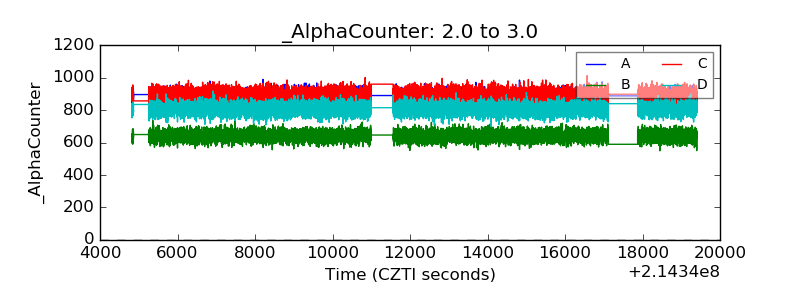 |
| _CPM_Rate | 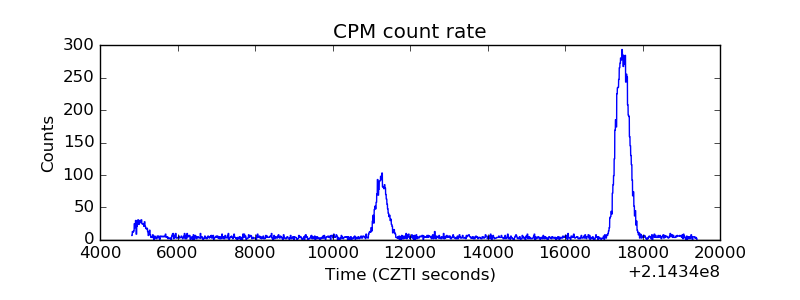 |
| CZT Counter | 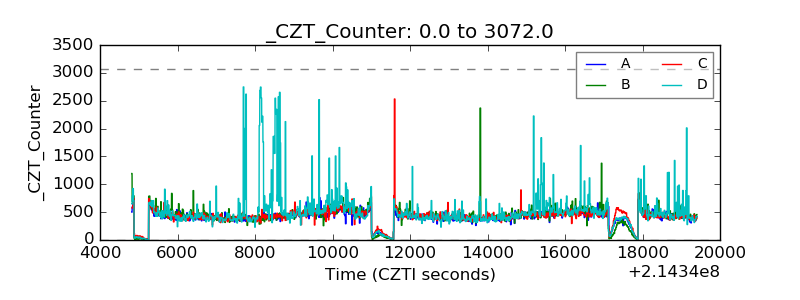 |
| +2.5 Volts monitor |  |
| +5 Volts monitor | 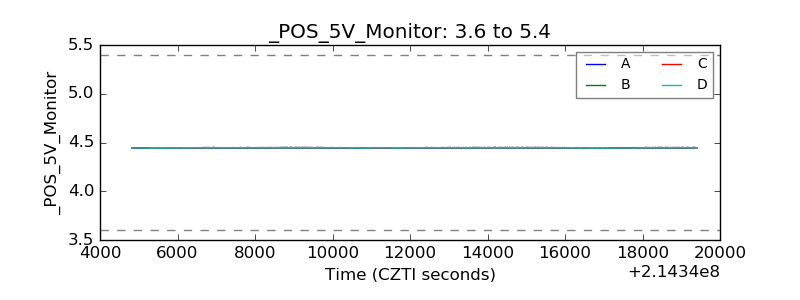 |
| _ROLL_ROT | 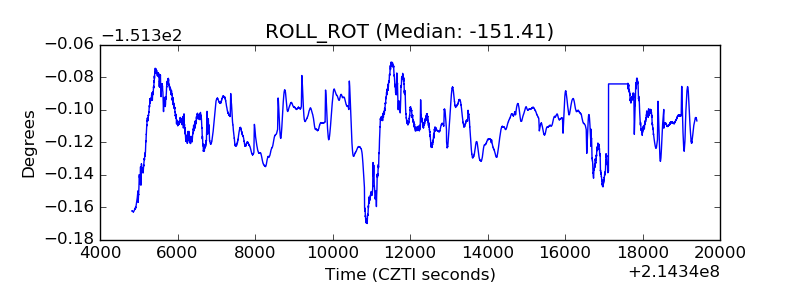 |
| _Roll_DEC | 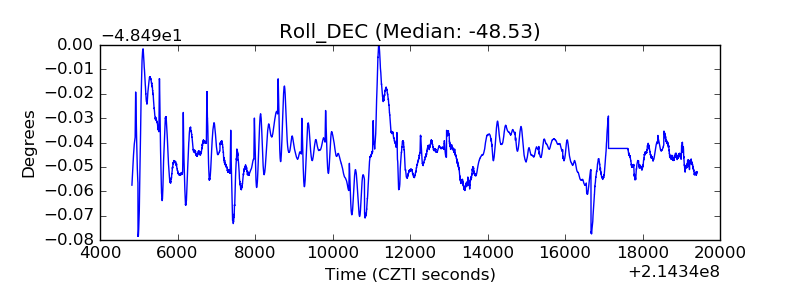 |
| _Roll_RA | 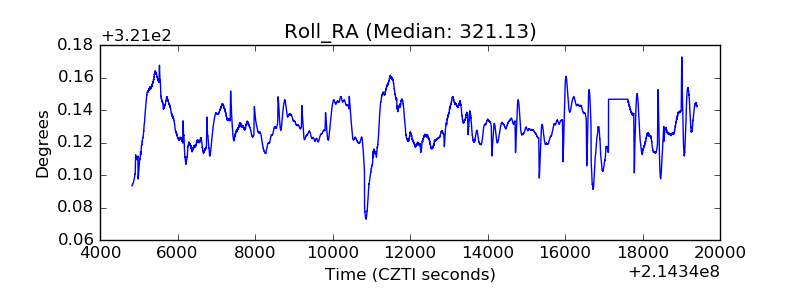 |
| Veto Counter | 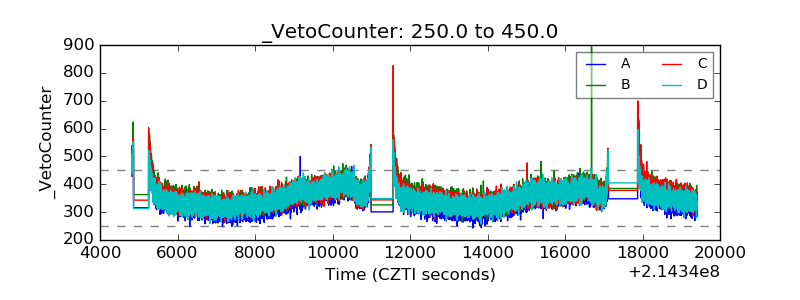 |