| Param | Original file | Final file |
|---|---|---|
| Filename | modeM0/AS1A02_098T01_9000000736_05698cztM0_level2.evt | modeM0/AS1A02_098T01_9000000736_05698cztM0_level2_quad_clean.evt |
| Size (bytes) | 437,774,400 | 59,402,880 |
| Size | 417.5 MB | 56.7 MB |
| Events in quadrant A | 3,053,638 | 333,880 |
| Events in quadrant B | 3,355,433 | 334,678 |
| Events in quadrant C | 3,025,233 | 339,622 |
| Events in quadrant D | 3,372,593 | 327,690 |
| Mode SS | |||
|---|---|---|---|
| Quadrant | BADHDUFLAG | Total packets | Discarded packets |
| A | 0 | 136 | 0 |
| B | 0 | 136 | 0 |
| C | 0 | 136 | 0 |
| D | 0 | 136 | 0 |
| Mode M0 | |||
|---|---|---|---|
| Quadrant | BADHDUFLAG | Total packets | Discarded packets |
| A | 0 | 13595 | 3 |
| B | 0 | 14202 | 2 |
| C | 0 | 13580 | 2 |
| D | 0 | 14632 | 2 |
| Mode M9 | |||
|---|---|---|---|
| Quadrant | BADHDUFLAG | Total packets | Discarded packets |
| A | 0 | 11 | 0 |
| B | 0 | 11 | 0 |
| C | 0 | 11 | 0 |
| D | 0 | 12 | 0 |
| Quadrant | Total seconds | Saturated seconds | Saturation percentage |
|---|---|---|---|
| A | 6629 | 58 | 0.874943% |
| B | 6629 | 77 | 1.161563% |
| C | 6629 | 59 | 0.890029% |
| D | 6629 | 108 | 1.629205% |
Noise dominated data is calculated using 1-second bins in cleaned event files. If a bin has >2000 counts, and if more than 50% of those come from <1% of pixels, then it is considered to be noise-dominated and hence unusable.
| Quadrant | # 1 sec bins | Bins with >0 counts | Bins with >2000 counts | High rate bins dominated by noise | Noise dominated (total time) | Noise dominated (detector-on time) | Marked lightcurve |
|---|---|---|---|---|---|---|---|
| A | 7665 | 6630 | 0 | 0 | 0.00% | 0.00% | 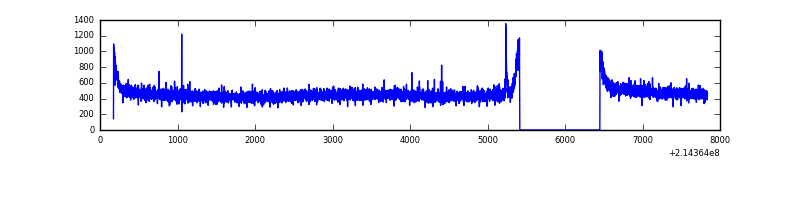 |
| B | 7665 | 6630 | 0 | 0 | 0.00% | 0.00% | 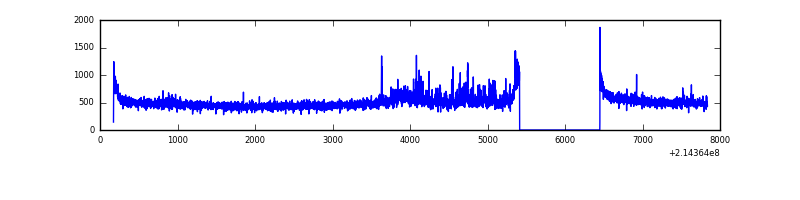 |
| C | 7665 | 6630 | 0 | 0 | 0.00% | 0.00% | 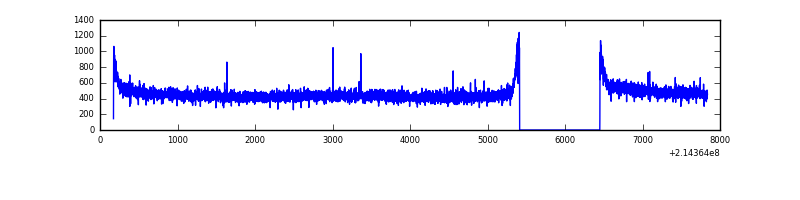 |
| D | 7665 | 6630 | 32 | 32 | 0.42% | 0.48% |  |
Top three noisy pixels from each quadrant. If the there are fewer than three noisy pixels in the level2.evt file, extra rows are filled as -1
| Pixel properties | Quadrant properties | ||||||
|---|---|---|---|---|---|---|---|
| Quadrant | DetID | PixID | Counts | Sigma | Mean | Median | Sigma |
| A | 0 | 50 | 11327 | 65.32 | 789 | 769 | 161.6 |
| A | 0 | 226 | 7746 | 43.16 | 789 | 769 | 161.6 |
| A | 12 | 194 | 7590 | 42.2 | 789 | 769 | 161.6 |
| B | 15 | 204 | 147923 | 966.51 | 799 | 779 | 152.2 |
| B | 0 | 219 | 50617 | 327.36 | 799 | 779 | 152.2 |
| B | 0 | 214 | 36688 | 235.86 | 799 | 779 | 152.2 |
| C | 1 | 16 | 11982 | 62.84 | 769 | 773 | 178.4 |
| C | 13 | 61 | 6174 | 30.28 | 769 | 773 | 178.4 |
| C | 12 | 4 | 3806 | 17.0 | 769 | 773 | 178.4 |
| D | 2 | 152 | 175400 | 921.98 | 766 | 741 | 189.4 |
| D | 2 | 14 | 112823 | 591.66 | 766 | 741 | 189.4 |
| D | 2 | 136 | 65455 | 341.61 | 766 | 741 | 189.4 |
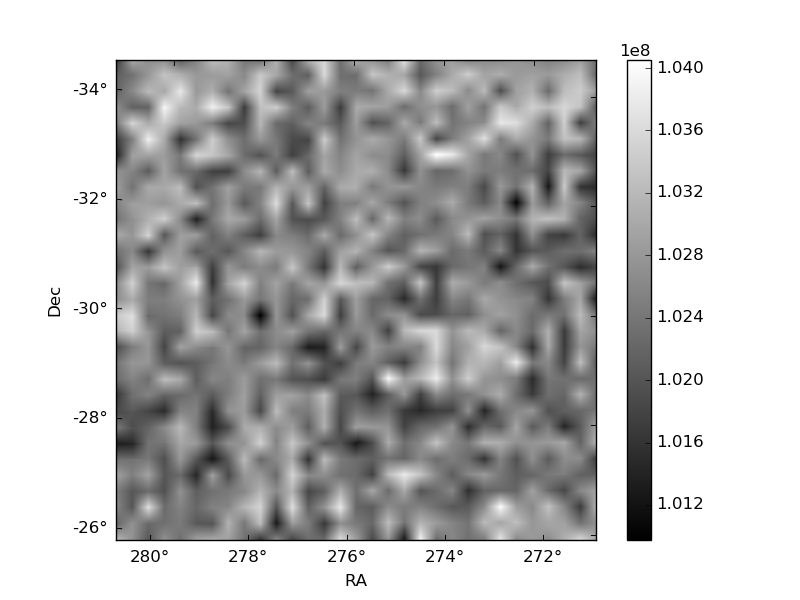
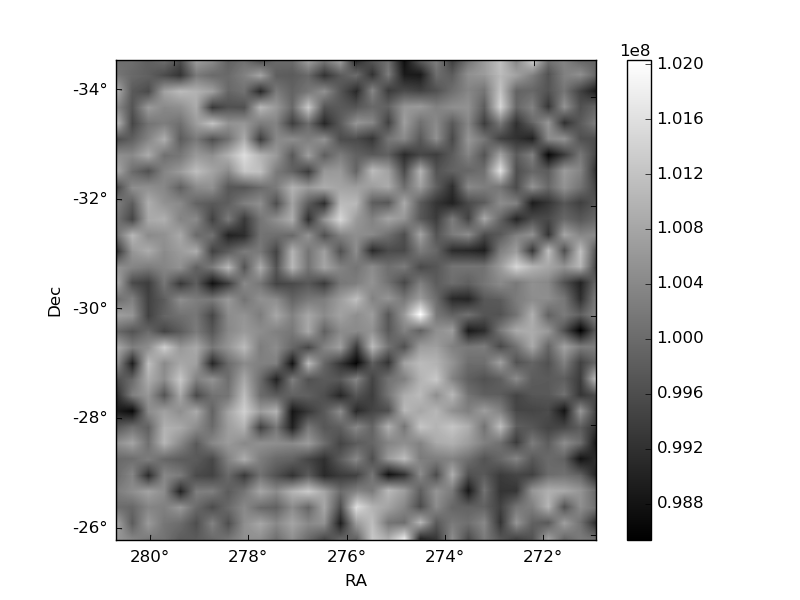
Histogram calculated using DETX and DETY for each event in the final _common_clean file
| Quadrant A |  |
 |
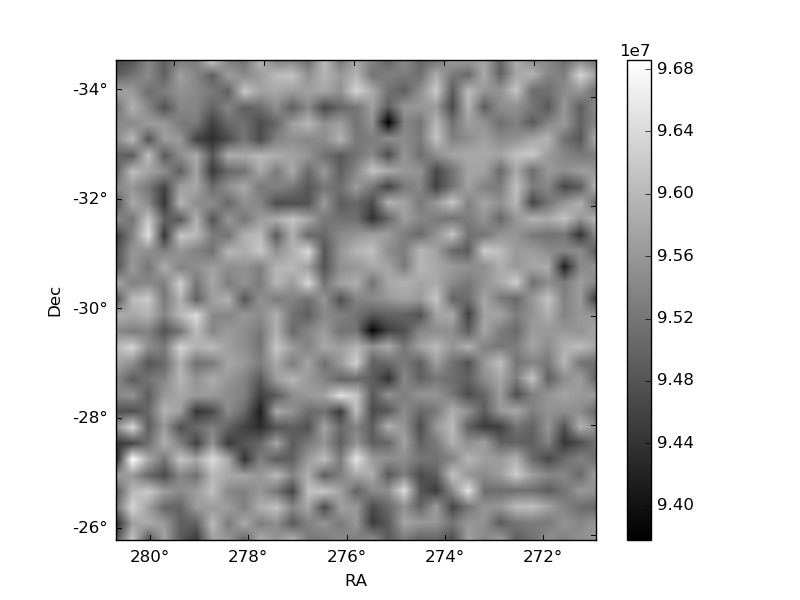
Quadrant B |
|---|---|---|---|
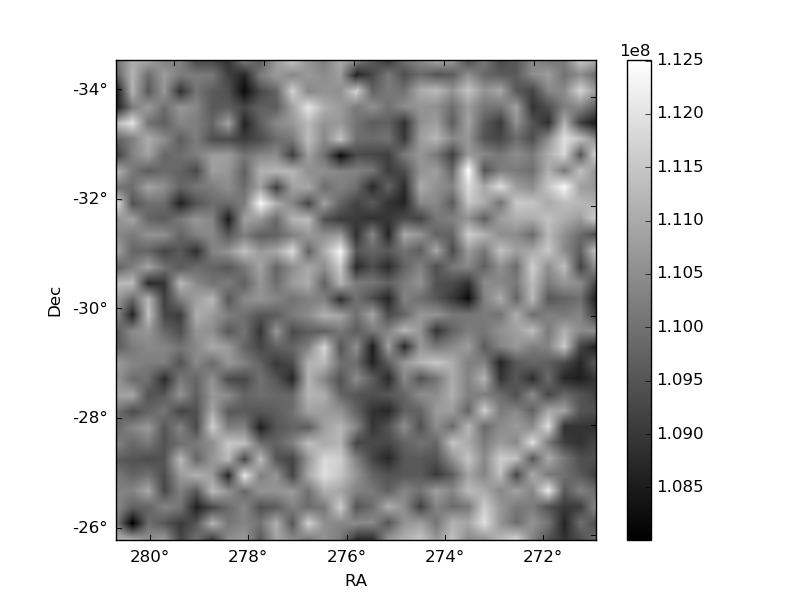
| Quadrant D | 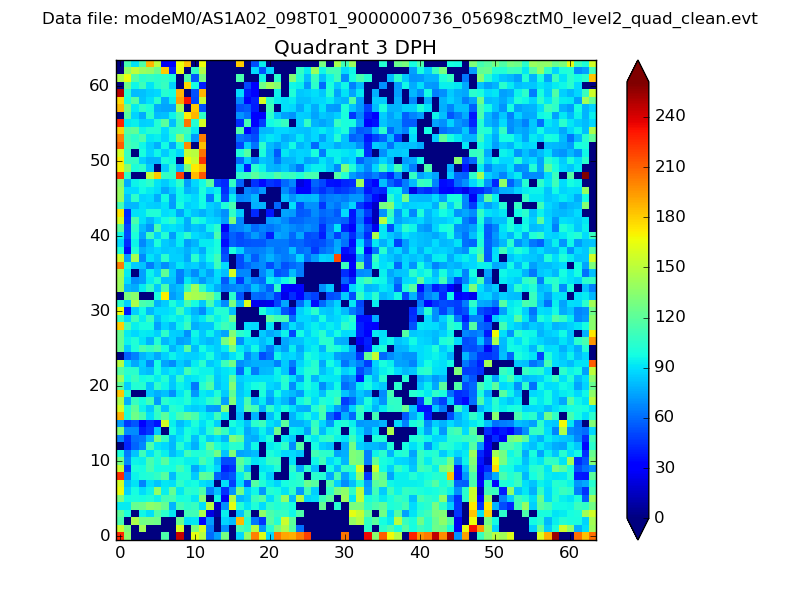 |
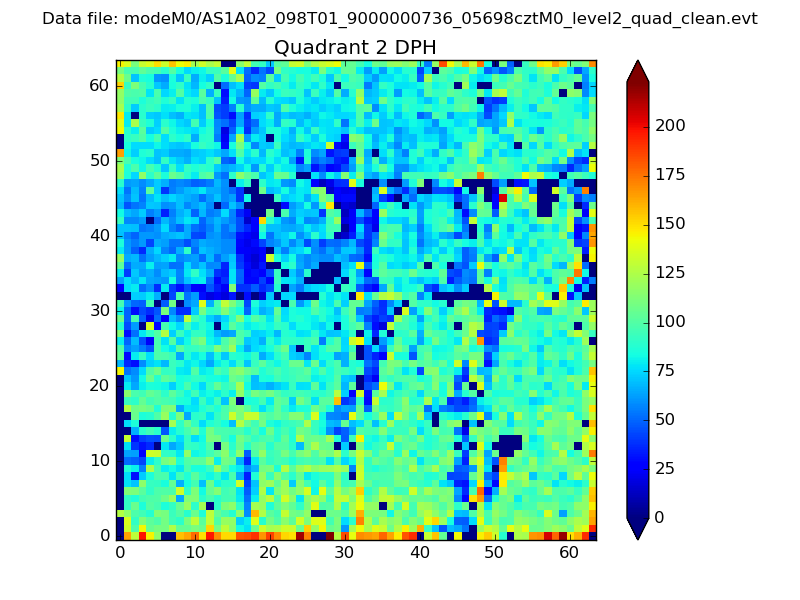 |
Quadrant C |
| Plot type | Count rate plots | Images |
|---|---|---|
| Comparison with Poisson distribution Blue bars denote a histogram of data divided into 1 sec bins. Red curve is a Poisson curve with rate = median count rate of data. |
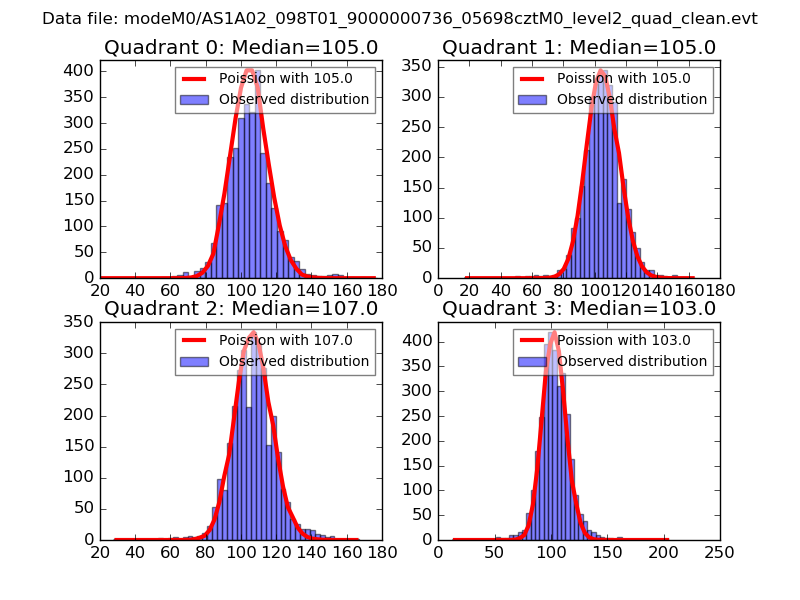 |
 |
| Quadrant-wise count rates Data is divided into 100 sec bins |
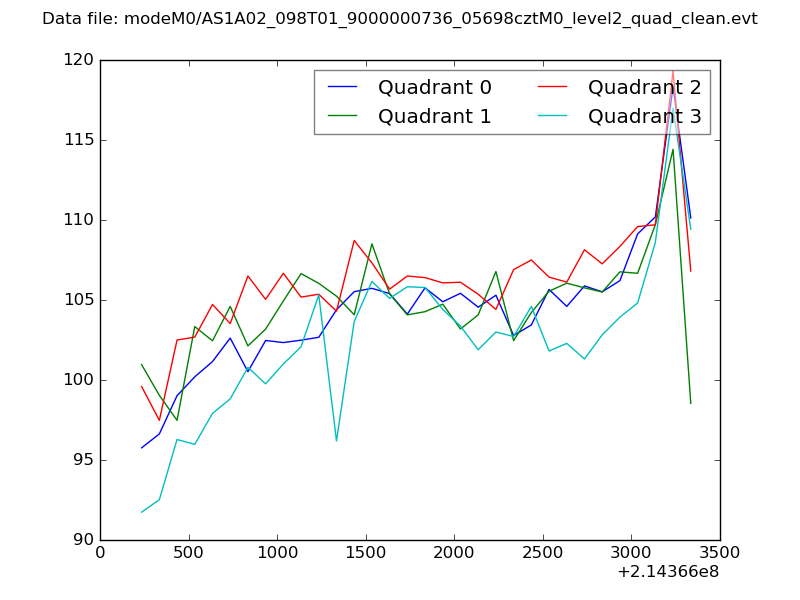 |
|
| Module-wise count rates for Quadrant A Data is divided into 100 sec bins |
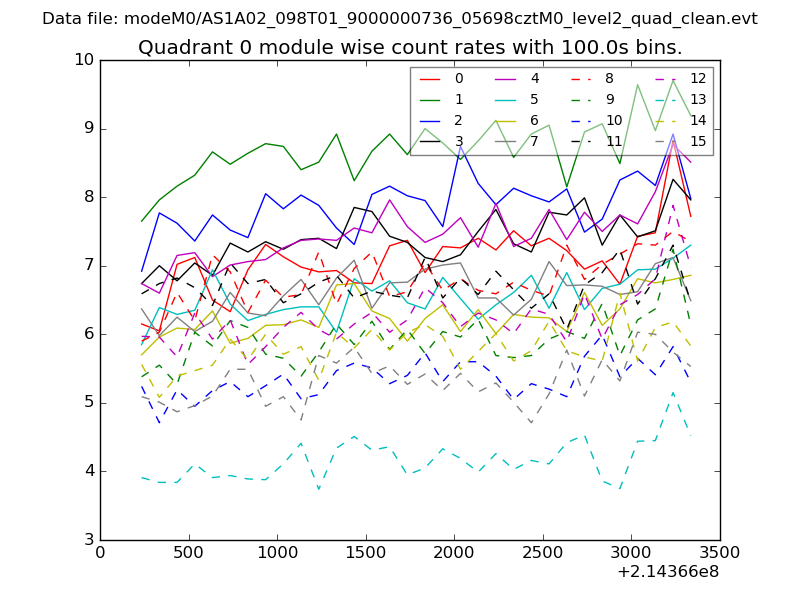 |
 |
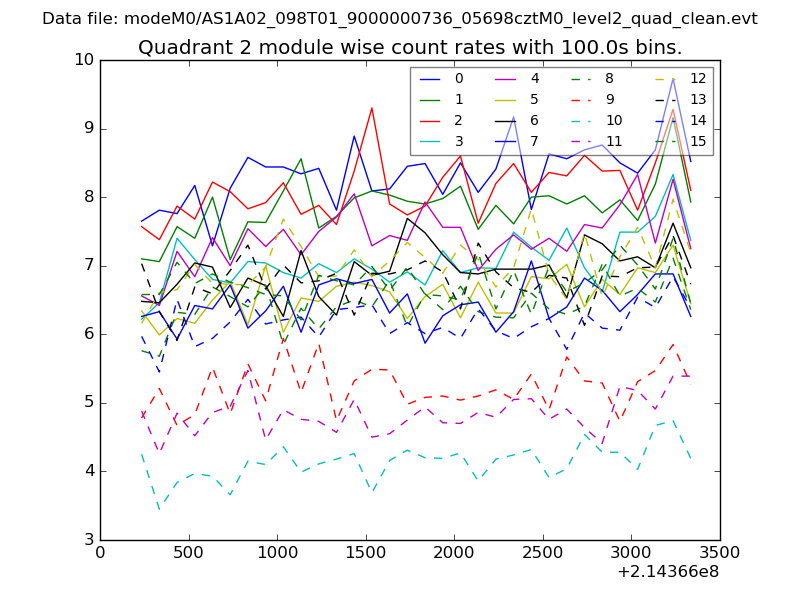
| Module-wise count rates for Quadrant B Data is divided into 100 sec bins |
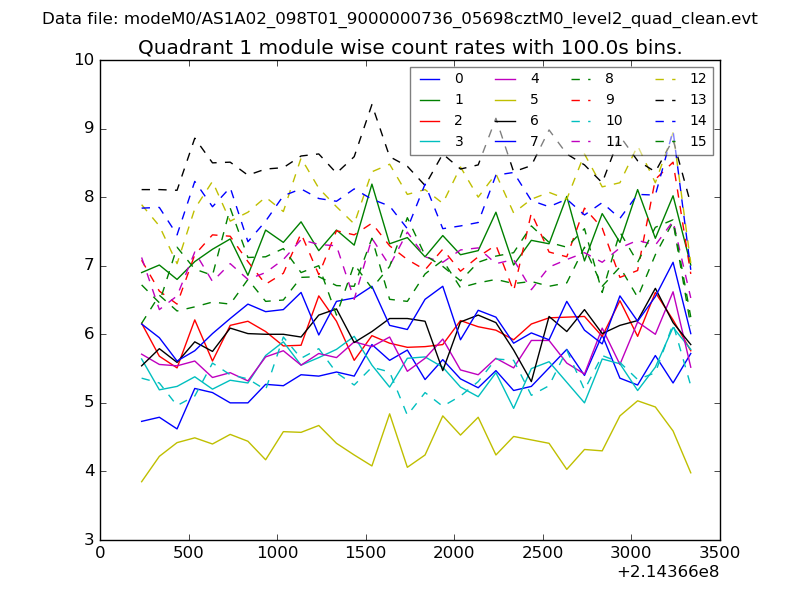 |
 |
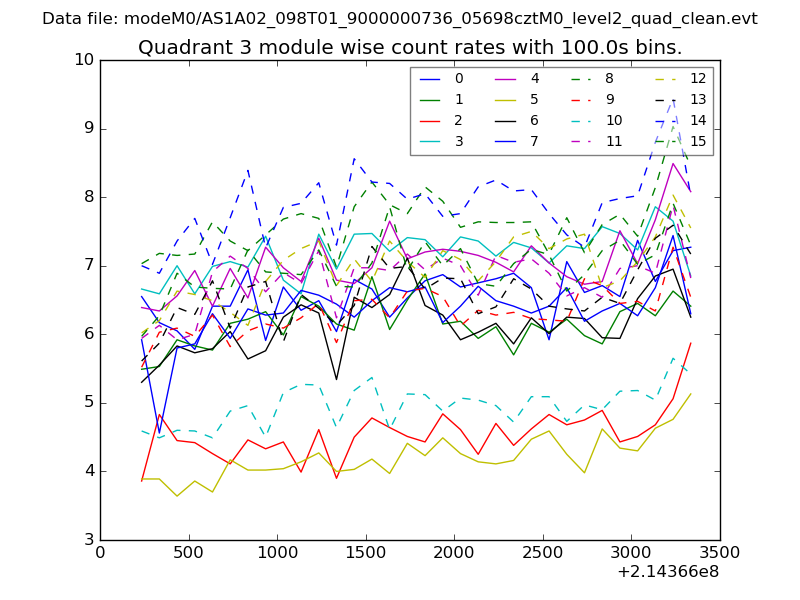
| Module-wise count rates for Quadrant C Data is divided into 100 sec bins |
 |
 |
| Module-wise count rates for Quadrant D Data is divided into 100 sec bins |
 |
 |
| Parameter | Plot |
|---|---|
| CZT HV Monitor | 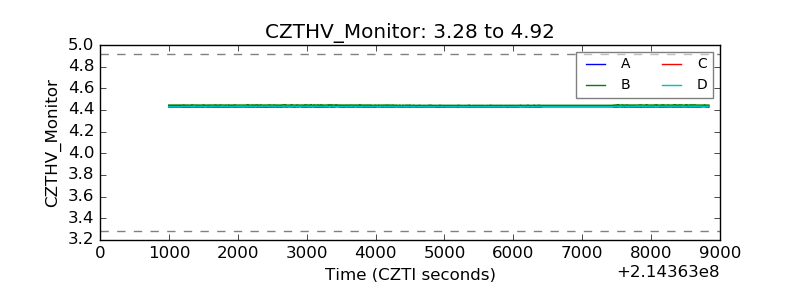 |
| D_VDD | 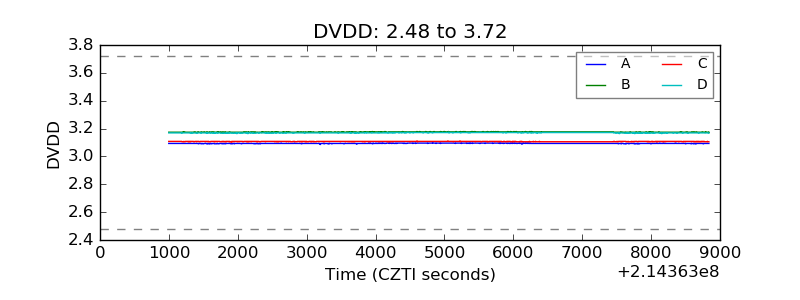 |
| Temperature 1 | 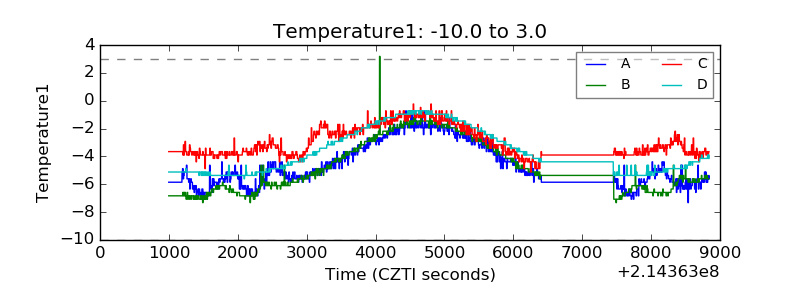 |
| Veto HV Monitor | 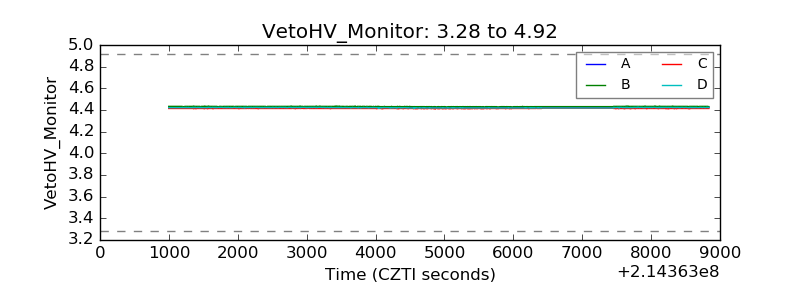 |
| Veto LLD |  |
| Alpha Counter | 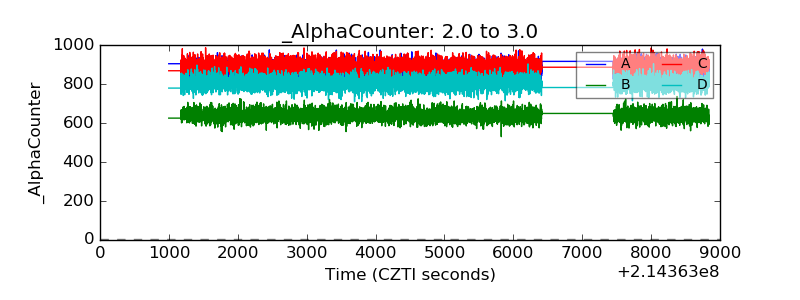 |
| _CPM_Rate | 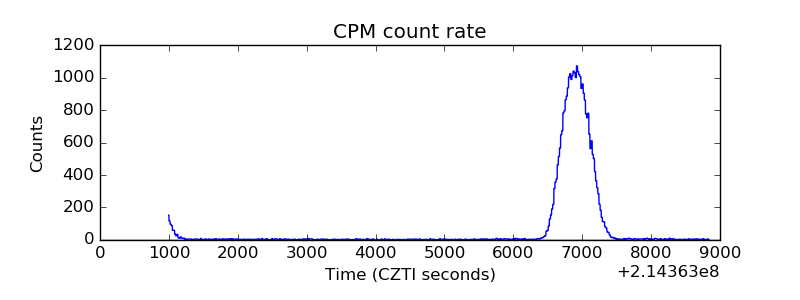 |
| CZT Counter | 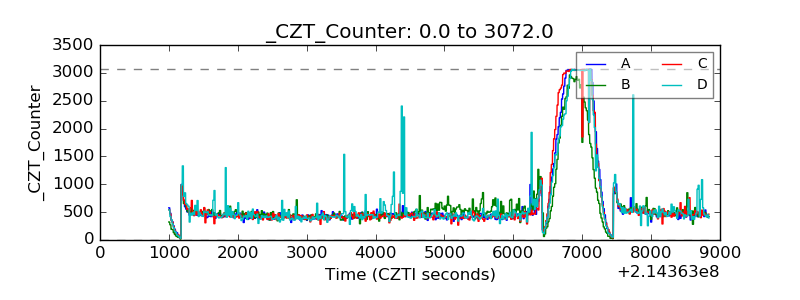 |
| +2.5 Volts monitor | 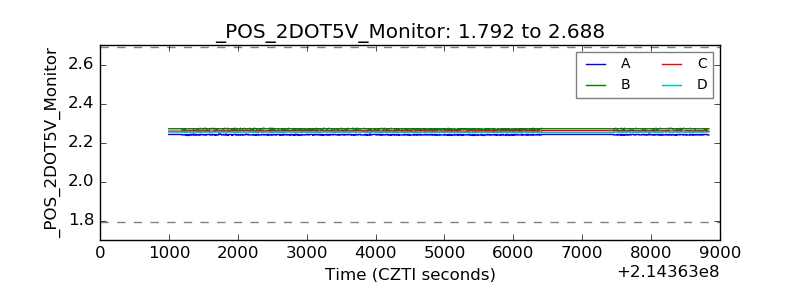 |
| +5 Volts monitor |  |
| _ROLL_ROT | 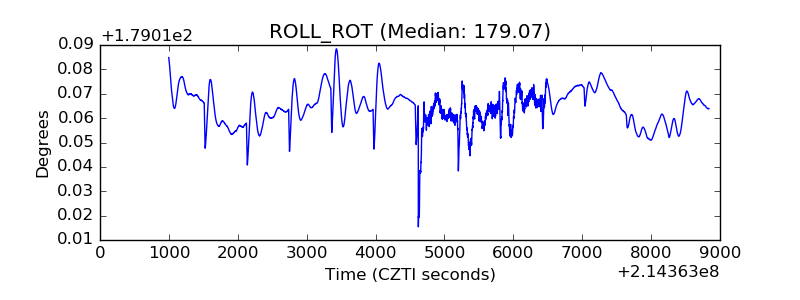 |
| _Roll_DEC | 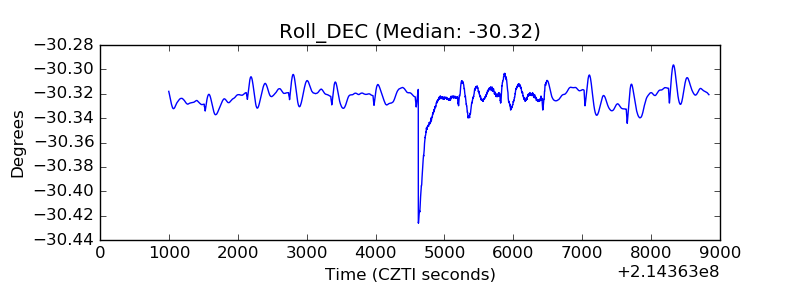 |
| _Roll_RA | 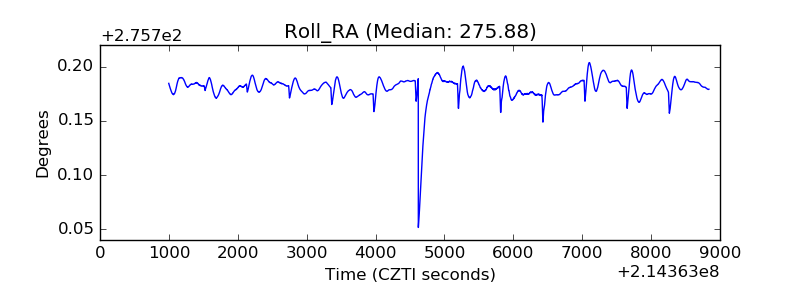 |
| Veto Counter | 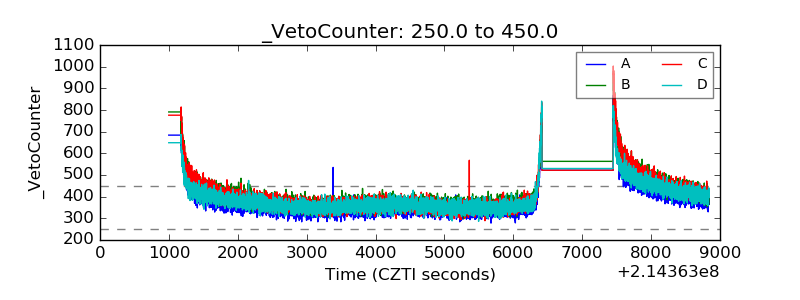 |