| Param | Original file | Final file |
|---|---|---|
| Filename | modeM0/AS1A02_098T01_9000000736_05700cztM0_level2.evt | modeM0/AS1A02_098T01_9000000736_05700cztM0_level2_quad_clean.evt |
| Size (bytes) | 449,176,320 | 65,865,600 |
| Size | 428.4 MB | 62.8 MB |
| Events in quadrant A | 3,118,470 | 385,965 |
| Events in quadrant B | 3,513,434 | 389,271 |
| Events in quadrant C | 3,184,742 | 392,491 |
| Events in quadrant D | 3,346,816 | 375,072 |
| Mode SS | |||
|---|---|---|---|
| Quadrant | BADHDUFLAG | Total packets | Discarded packets |
| A | 0 | 130 | 0 |
| B | 0 | 130 | 0 |
| C | 0 | 130 | 0 |
| D | 0 | 130 | 0 |
| Mode M0 | |||
|---|---|---|---|
| Quadrant | BADHDUFLAG | Total packets | Discarded packets |
| A | 0 | 13458 | 3 |
| B | 0 | 14435 | 2 |
| C | 0 | 13768 | 2 |
| D | 0 | 14156 | 2 |
| Mode M9 | |||
|---|---|---|---|
| Quadrant | BADHDUFLAG | Total packets | Discarded packets |
| A | 0 | 18 | 0 |
| B | 0 | 18 | 0 |
| C | 0 | 18 | 0 |
| D | 0 | 19 | 0 |
| Quadrant | Total seconds | Saturated seconds | Saturation percentage |
|---|---|---|---|
| A | 6475 | 112 | 1.729730% |
| B | 6475 | 127 | 1.961390% |
| C | 6475 | 95 | 1.467181% |
| D | 6475 | 123 | 1.899614% |
Noise dominated data is calculated using 1-second bins in cleaned event files. If a bin has >2000 counts, and if more than 50% of those come from <1% of pixels, then it is considered to be noise-dominated and hence unusable.
| Quadrant | # 1 sec bins | Bins with >0 counts | Bins with >2000 counts | High rate bins dominated by noise | Noise dominated (total time) | Noise dominated (detector-on time) | Marked lightcurve |
|---|---|---|---|---|---|---|---|
| A | 7595 | 6475 | 2 | 2 | 0.03% | 0.03% |  |
| B | 7595 | 6475 | 2 | 2 | 0.03% | 0.03% |  |
| C | 7595 | 6475 | 1 | 1 | 0.01% | 0.02% | 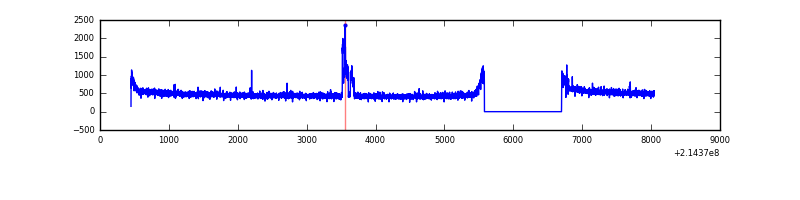 |
| D | 7595 | 6476 | 22 | 22 | 0.29% | 0.34% | 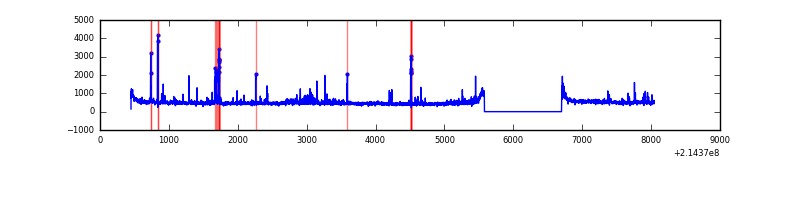 |
Top three noisy pixels from each quadrant. If the there are fewer than three noisy pixels in the level2.evt file, extra rows are filled as -1
| Pixel properties | Quadrant properties | ||||||
|---|---|---|---|---|---|---|---|
| Quadrant | DetID | PixID | Counts | Sigma | Mean | Median | Sigma |
| A | 0 | 50 | 13603 | 78.22 | 805 | 788 | 163.8 |
| A | 0 | 226 | 8109 | 44.68 | 805 | 788 | 163.8 |
| A | 12 | 194 | 7751 | 42.5 | 805 | 788 | 163.8 |
| B | 15 | 204 | 248179 | 1614.94 | 810 | 794 | 153.2 |
| B | 0 | 214 | 36073 | 230.3 | 810 | 794 | 153.2 |
| B | 11 | 51 | 28934 | 183.7 | 810 | 794 | 153.2 |
| C | 1 | 241 | 98202 | 539.9 | 783 | 785 | 180.4 |
| C | 1 | 16 | 16988 | 89.8 | 783 | 785 | 180.4 |
| C | 14 | 67 | 10172 | 52.02 | 783 | 785 | 180.4 |
| D | 2 | 14 | 109705 | 569.49 | 782 | 756 | 191.3 |
| D | 8 | 195 | 82982 | 429.81 | 782 | 756 | 191.3 |
| D | 2 | 152 | 75748 | 392.0 | 782 | 756 | 191.3 |
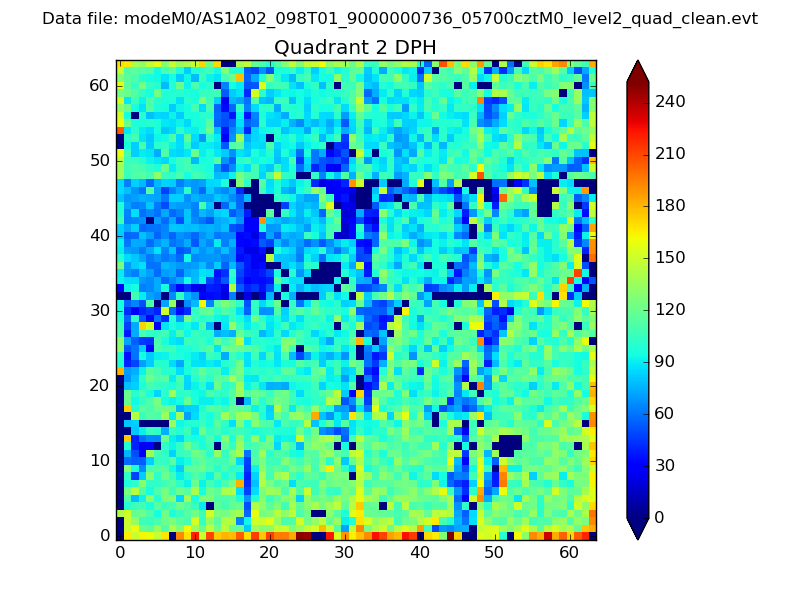
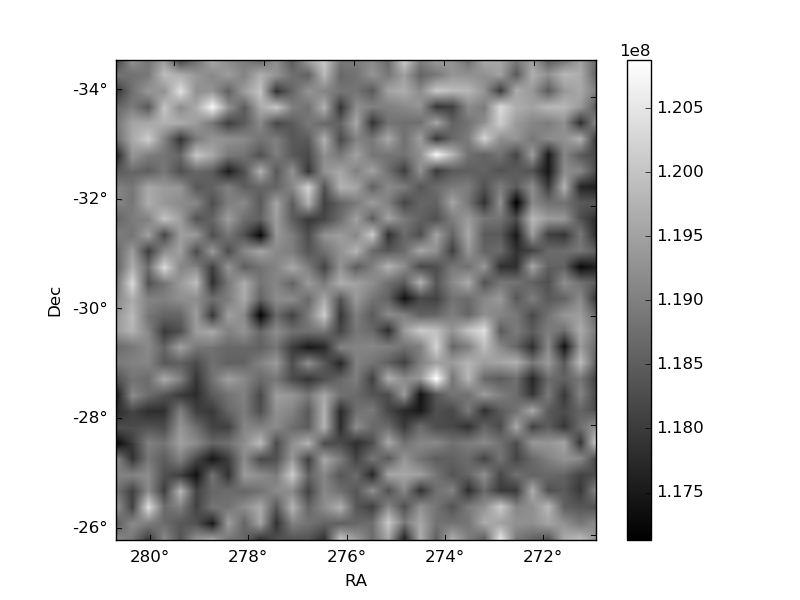
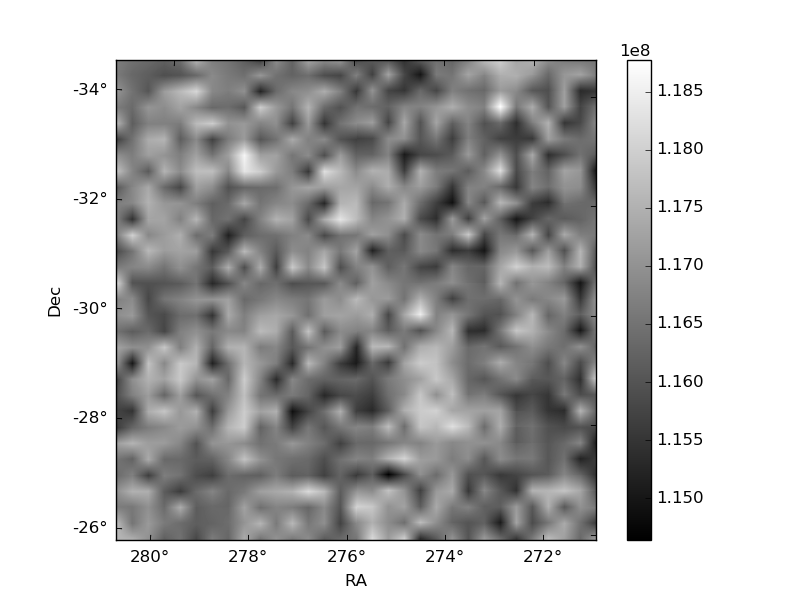
Histogram calculated using DETX and DETY for each event in the final _common_clean file
| Quadrant A |  |
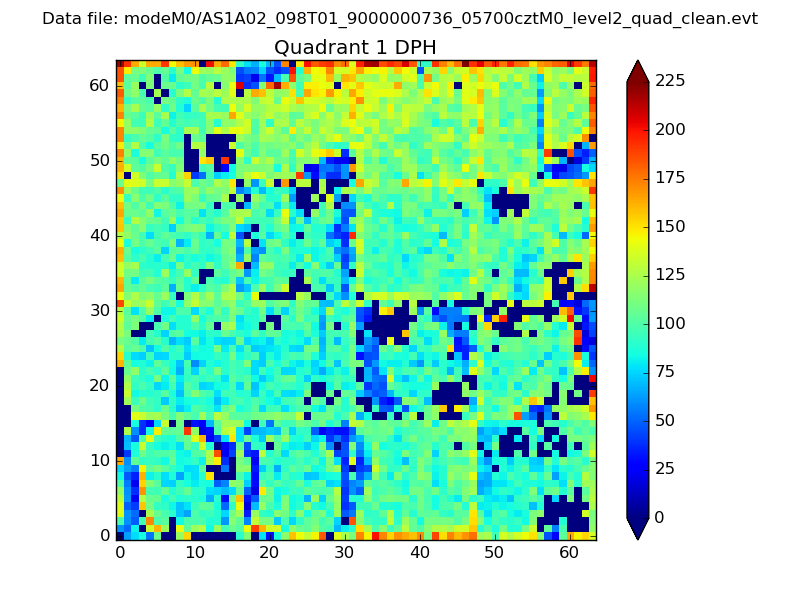 |
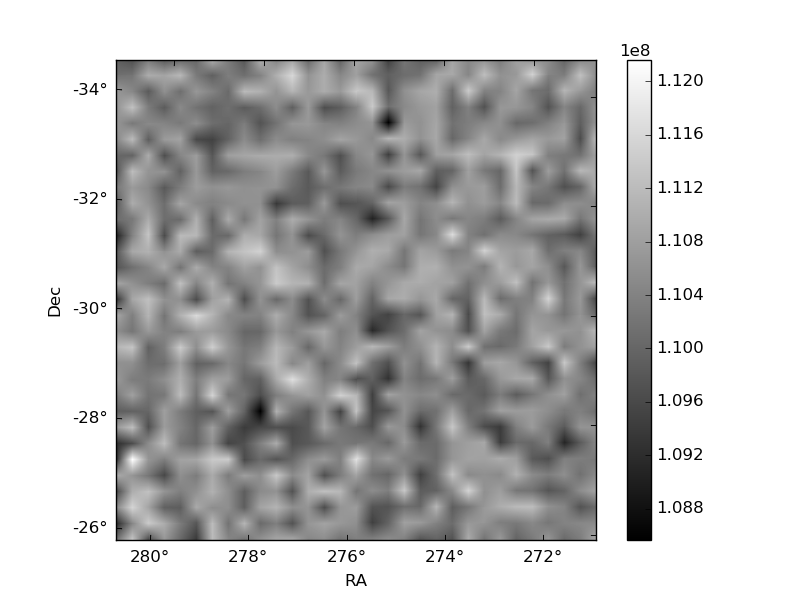
Quadrant B |
|---|---|---|---|
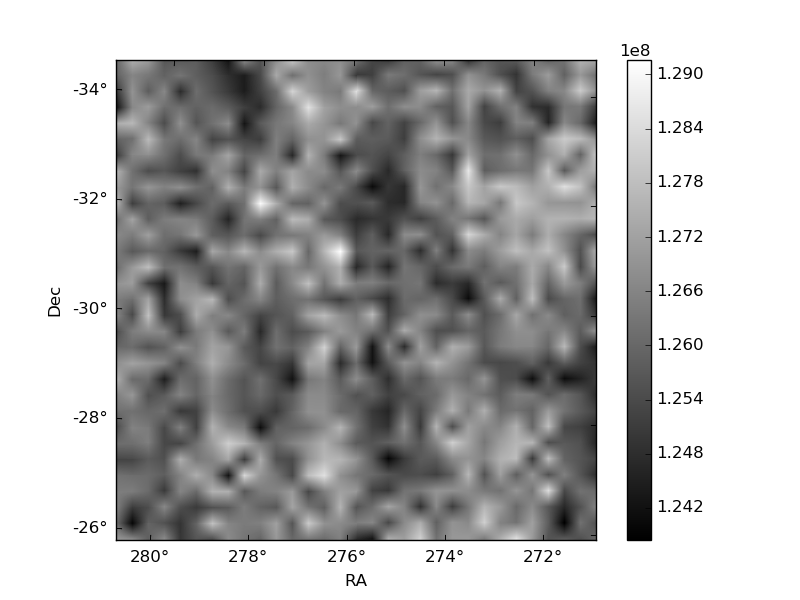
| Quadrant D | 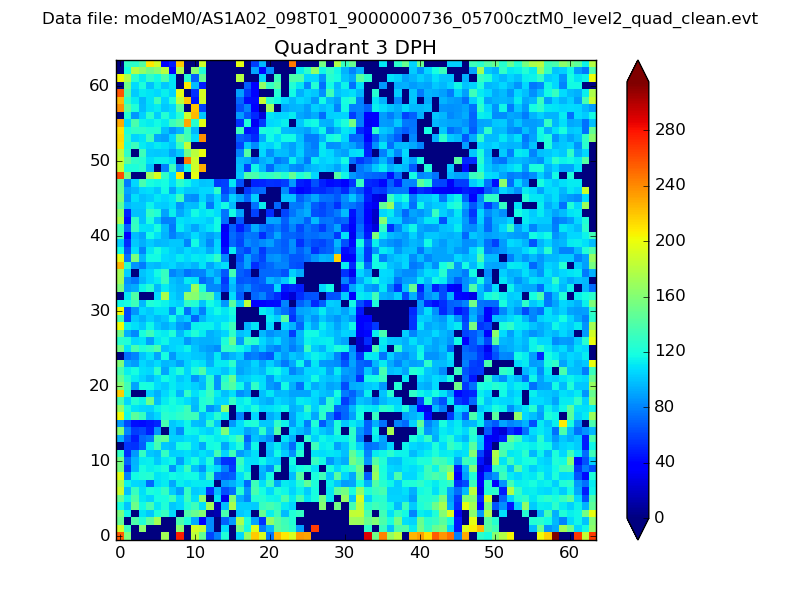 |
 |
Quadrant C |
| Plot type | Count rate plots | Images |
|---|---|---|
| Comparison with Poisson distribution Blue bars denote a histogram of data divided into 1 sec bins. Red curve is a Poisson curve with rate = median count rate of data. |
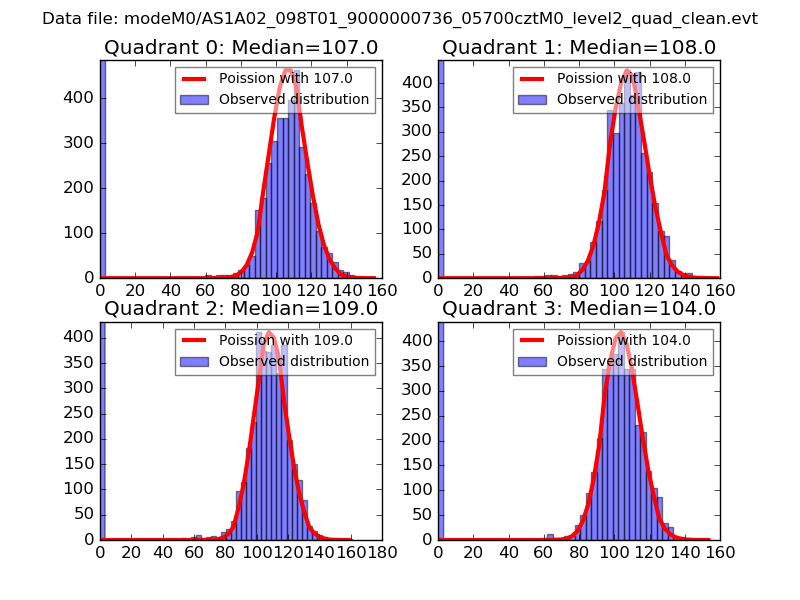 |
 |
| Quadrant-wise count rates Data is divided into 100 sec bins |
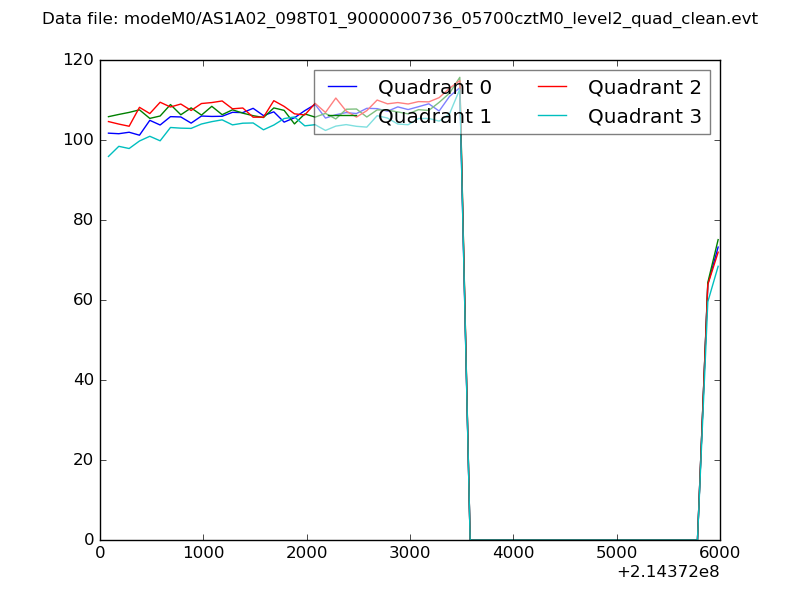 |
|
| Module-wise count rates for Quadrant A Data is divided into 100 sec bins |
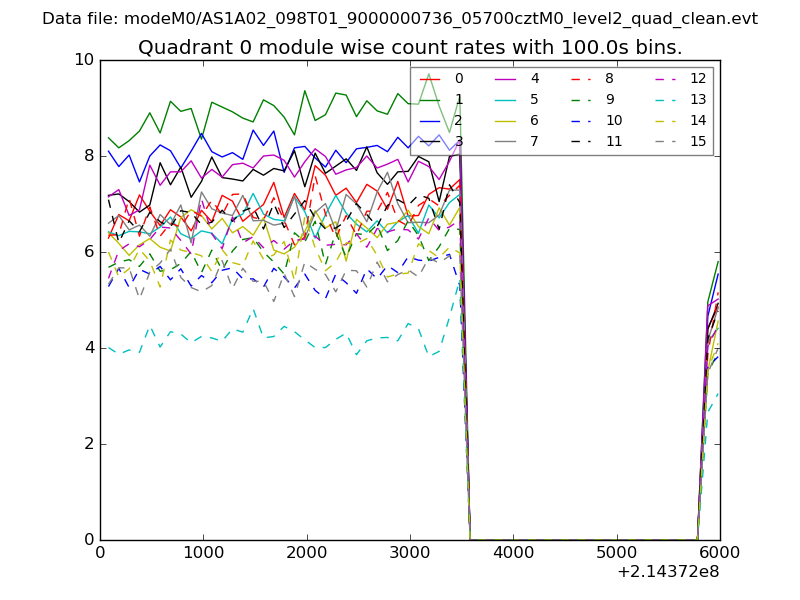 |
 |
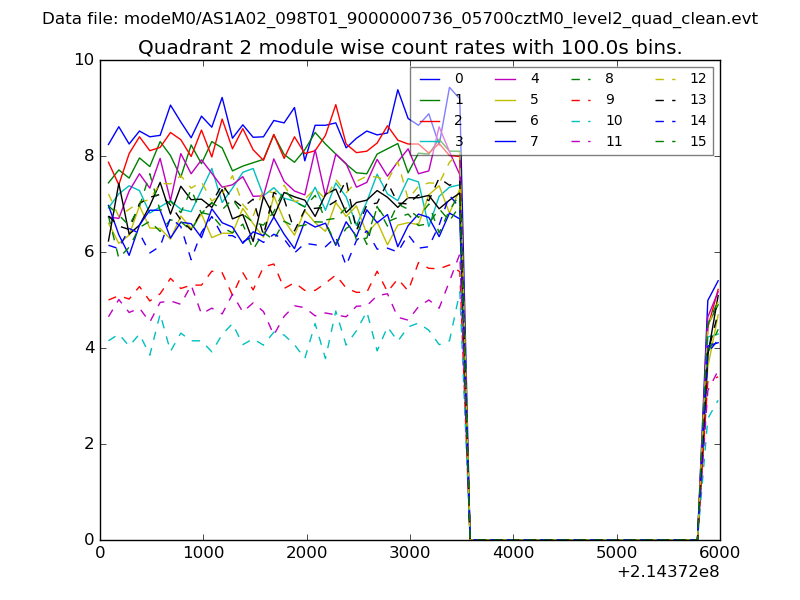
| Module-wise count rates for Quadrant B Data is divided into 100 sec bins |
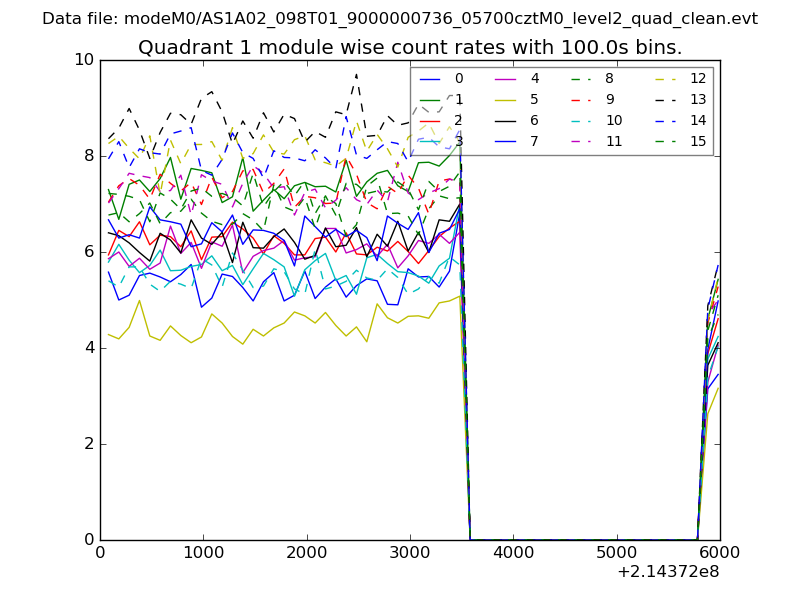 |
 |
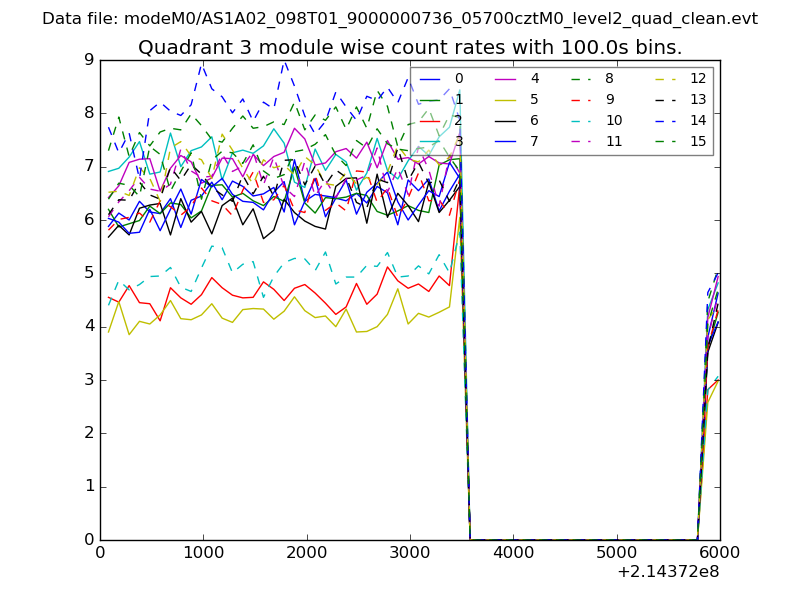
| Module-wise count rates for Quadrant C Data is divided into 100 sec bins |
 |
 |
| Module-wise count rates for Quadrant D Data is divided into 100 sec bins |
 |
 |
| Parameter | Plot |
|---|---|
| CZT HV Monitor | 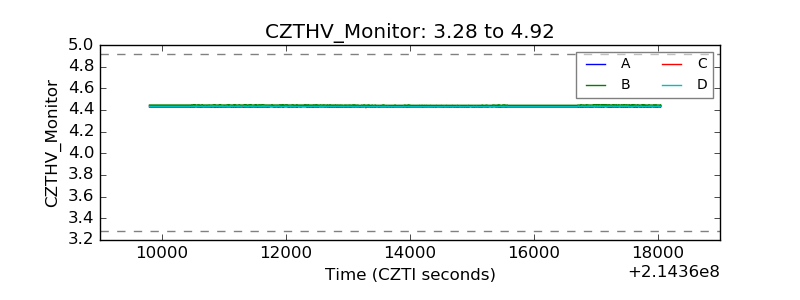 |
| D_VDD | 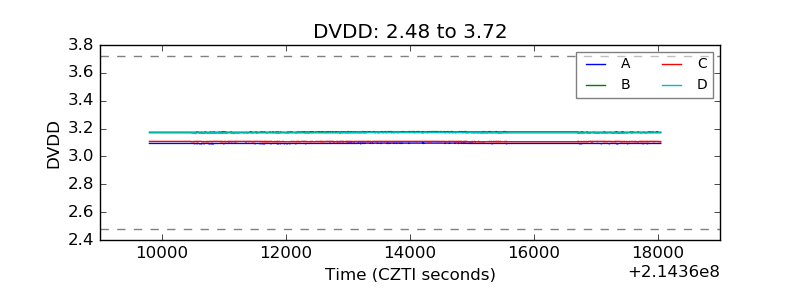 |
| Temperature 1 | 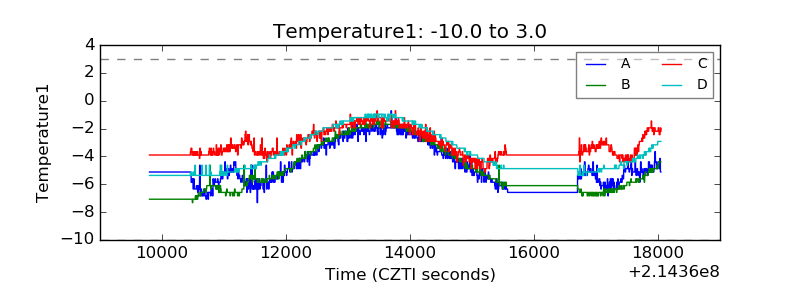 |
| Veto HV Monitor | 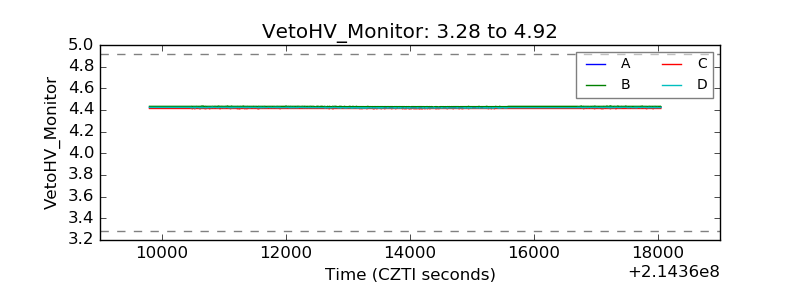 |
| Veto LLD | 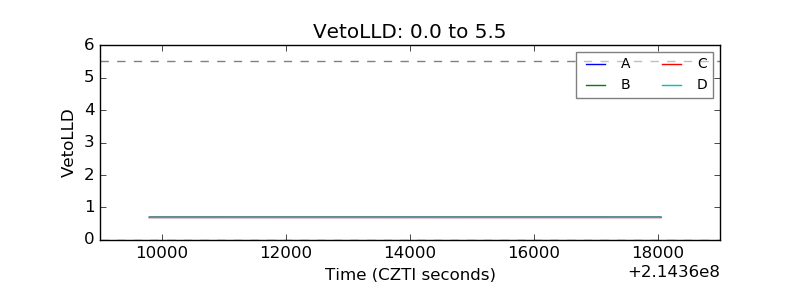 |
| Alpha Counter | 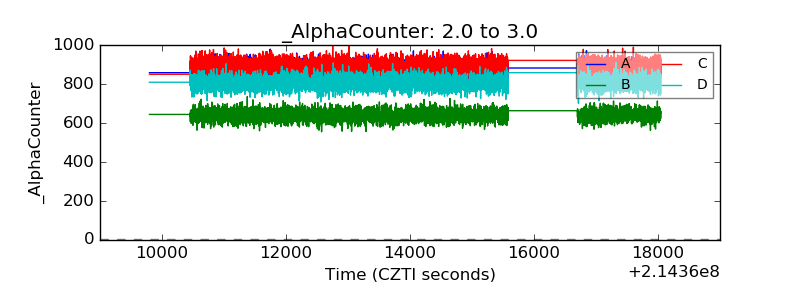 |
| _CPM_Rate | 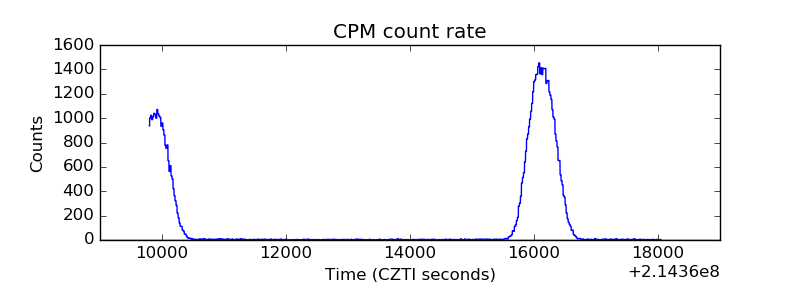 |
| CZT Counter | 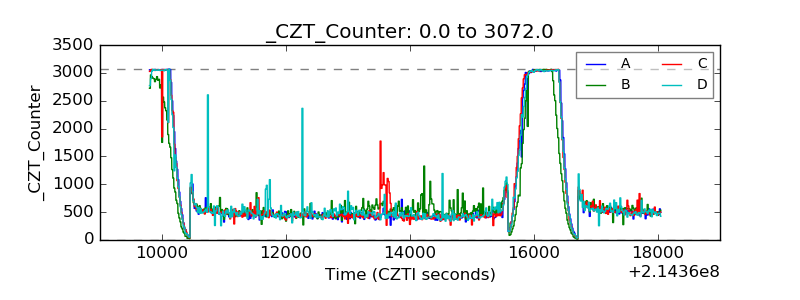 |
| +2.5 Volts monitor |  |
| +5 Volts monitor |  |
| _ROLL_ROT | 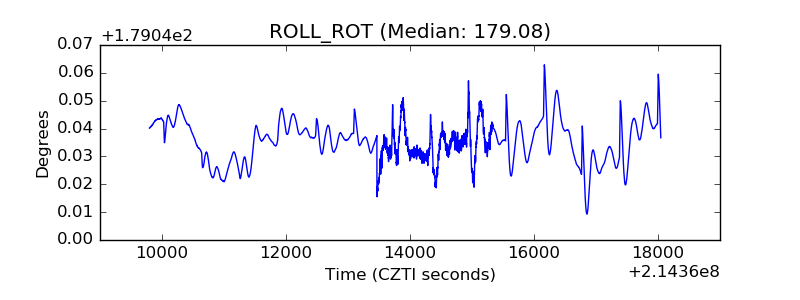 |
| _Roll_DEC | 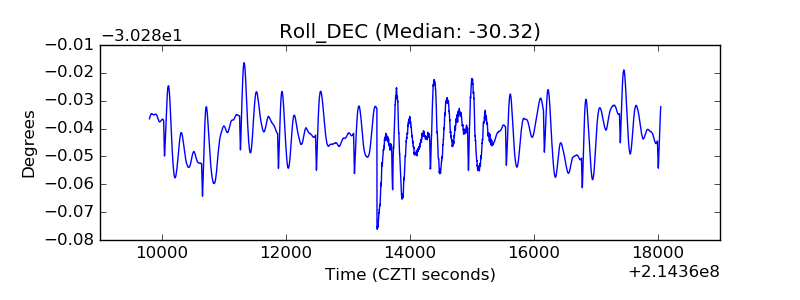 |
| _Roll_RA | 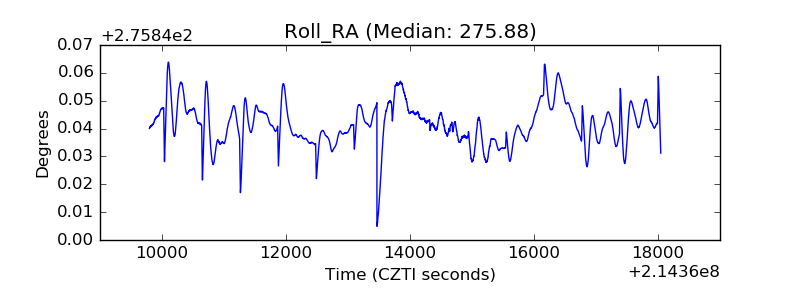 |
| Veto Counter | 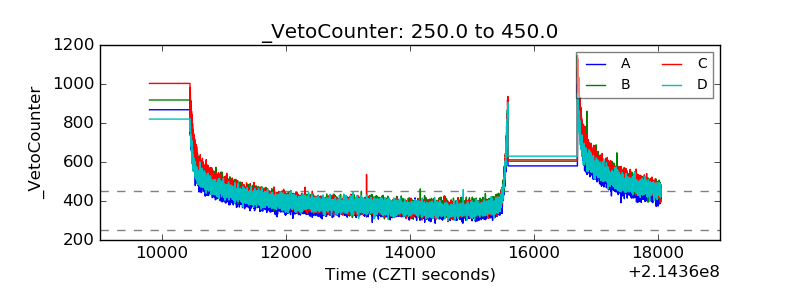 |