| Param | Original file | Final file |
|---|---|---|
| Filename | modeM0/AS1A02_098T01_9000000736_05701cztM0_level2.evt | modeM0/AS1A02_098T01_9000000736_05701cztM0_level2_quad_clean.evt |
| Size (bytes) | 462,879,360 | 80,386,560 |
| Size | 441.4 MB | 76.7 MB |
| Events in quadrant A | 3,247,658 | 498,693 |
| Events in quadrant B | 3,661,615 | 500,888 |
| Events in quadrant C | 3,216,648 | 503,353 |
| Events in quadrant D | 3,452,381 | 479,644 |
| Mode SS | |||
|---|---|---|---|
| Quadrant | BADHDUFLAG | Total packets | Discarded packets |
| A | 0 | 134 | 0 |
| B | 0 | 134 | 0 |
| C | 0 | 134 | 0 |
| D | 0 | 134 | 0 |
| Mode M0 | |||
|---|---|---|---|
| Quadrant | BADHDUFLAG | Total packets | Discarded packets |
| A | 0 | 13698 | 3 |
| B | 0 | 14923 | 2 |
| C | 0 | 13748 | 2 |
| D | 0 | 14388 | 2 |
| Mode M9 | |||
|---|---|---|---|
| Quadrant | BADHDUFLAG | Total packets | Discarded packets |
| A | 0 | 24 | 0 |
| B | 0 | 24 | 0 |
| C | 0 | 24 | 0 |
| D | 0 | 24 | 0 |
| Quadrant | Total seconds | Saturated seconds | Saturation percentage |
|---|---|---|---|
| A | 6473 | 126 | 1.946547% |
| B | 6473 | 148 | 2.286421% |
| C | 6473 | 115 | 1.776611% |
| D | 6473 | 132 | 2.039240% |
Noise dominated data is calculated using 1-second bins in cleaned event files. If a bin has >2000 counts, and if more than 50% of those come from <1% of pixels, then it is considered to be noise-dominated and hence unusable.
| Quadrant | # 1 sec bins | Bins with >0 counts | Bins with >2000 counts | High rate bins dominated by noise | Noise dominated (total time) | Noise dominated (detector-on time) | Marked lightcurve |
|---|---|---|---|---|---|---|---|
| A | 8848 | 6474 | 0 | 0 | 0.00% | 0.00% |  |
| B | 8848 | 6474 | 3 | 3 | 0.03% | 0.05% |  |
| C | 8848 | 6474 | 0 | 0 | 0.00% | 0.00% |  |
| D | 8848 | 6475 | 7 | 7 | 0.08% | 0.11% |  |
Top three noisy pixels from each quadrant. If the there are fewer than three noisy pixels in the level2.evt file, extra rows are filled as -1
| Pixel properties | Quadrant properties | ||||||
|---|---|---|---|---|---|---|---|
| Quadrant | DetID | PixID | Counts | Sigma | Mean | Median | Sigma |
| A | 0 | 226 | 8218 | 43.18 | 843 | 825 | 171.2 |
| A | 12 | 194 | 8209 | 43.13 | 843 | 825 | 171.2 |
| A | 15 | 254 | 2686 | 10.87 | 843 | 825 | 171.2 |
| B | 15 | 204 | 282257 | 1772.91 | 841 | 823 | 158.7 |
| B | 11 | 51 | 50203 | 311.07 | 841 | 823 | 158.7 |
| B | 0 | 219 | 18948 | 114.18 | 841 | 823 | 158.7 |
| C | 1 | 16 | 14552 | 73.41 | 817 | 822 | 187.0 |
| C | 14 | 67 | 10617 | 52.37 | 817 | 822 | 187.0 |
| C | 13 | 61 | 6582 | 30.79 | 817 | 822 | 187.0 |
| D | 8 | 195 | 105844 | 529.09 | 819 | 797 | 198.5 |
| D | 2 | 152 | 86198 | 430.14 | 819 | 797 | 198.5 |
| D | 12 | 221 | 46170 | 228.53 | 819 | 797 | 198.5 |
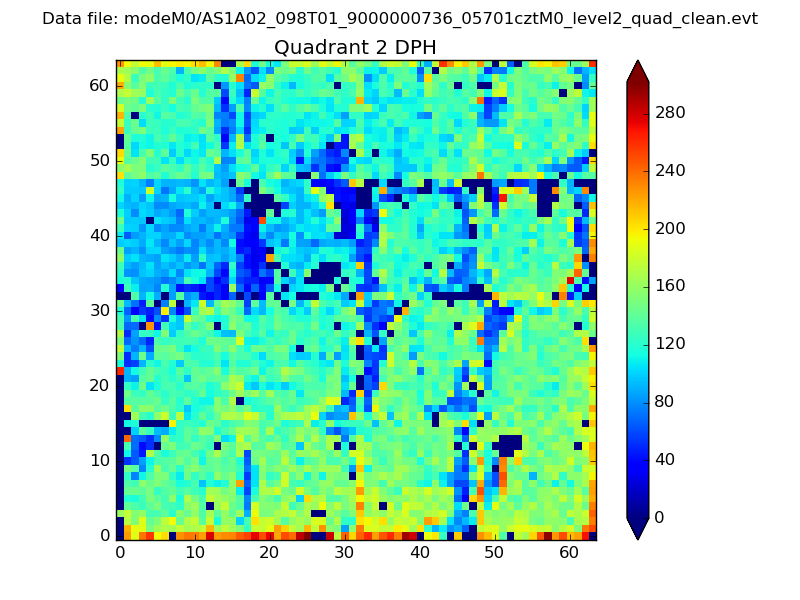
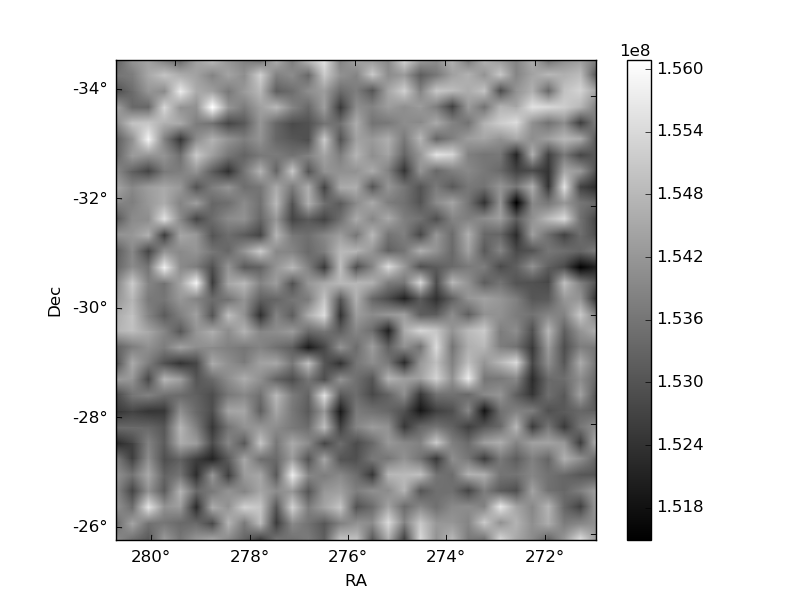
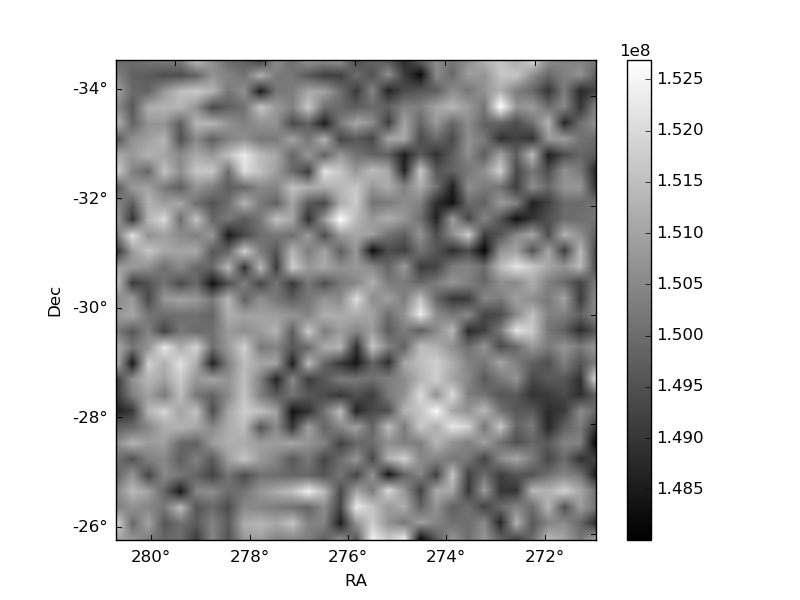
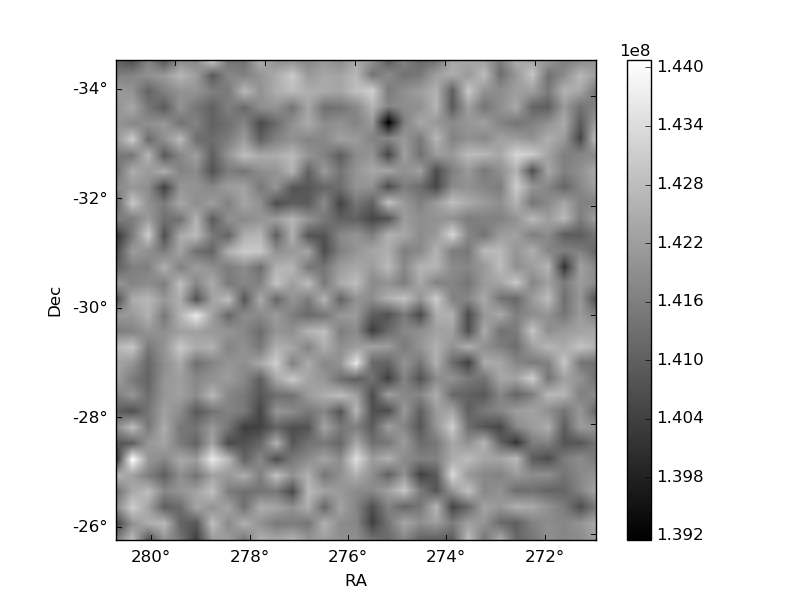
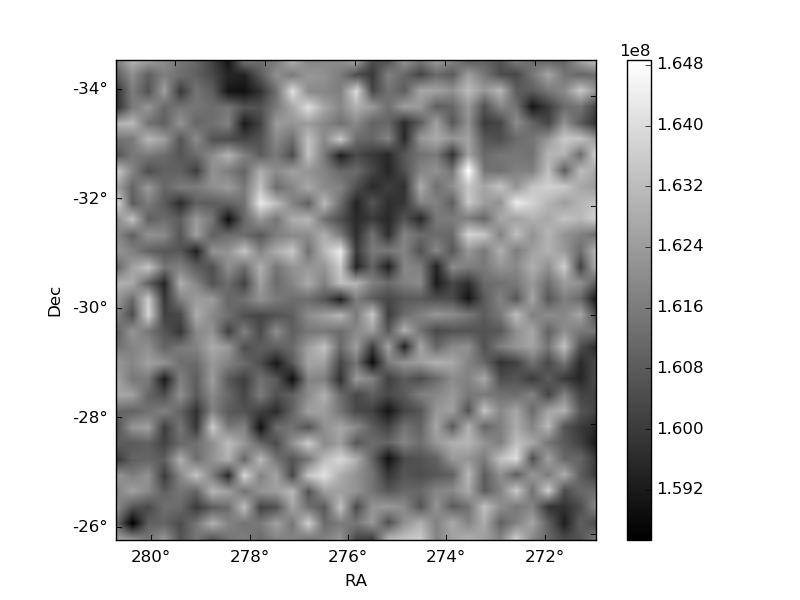
Histogram calculated using DETX and DETY for each event in the final _common_clean file
| Quadrant A | 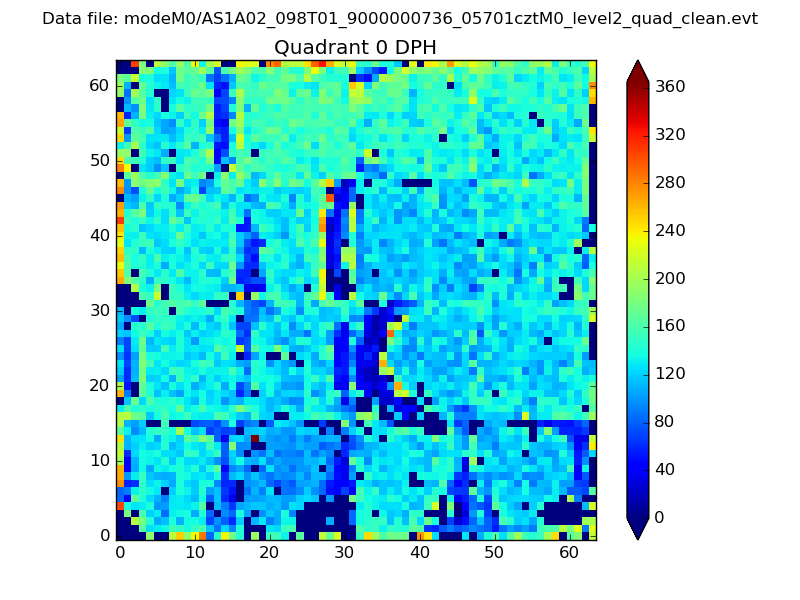 |
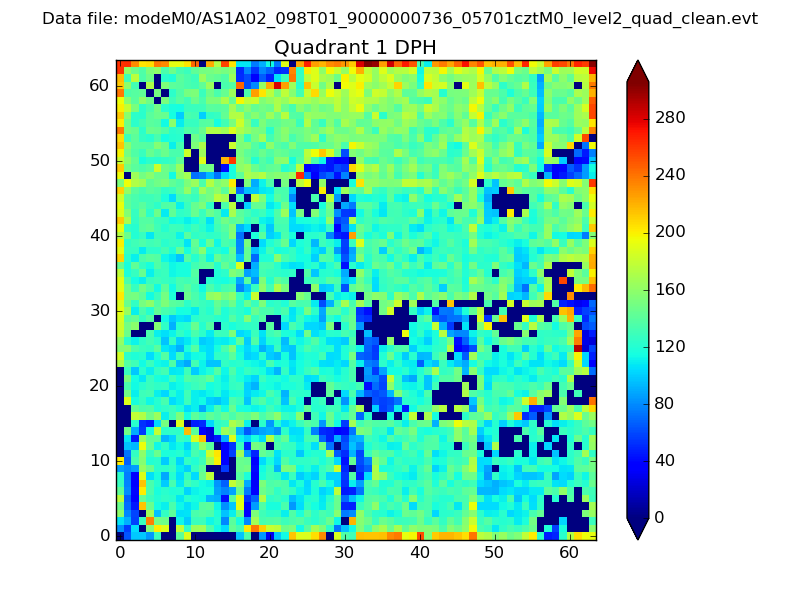 |
Quadrant B |
|---|---|---|---|
| Quadrant D | 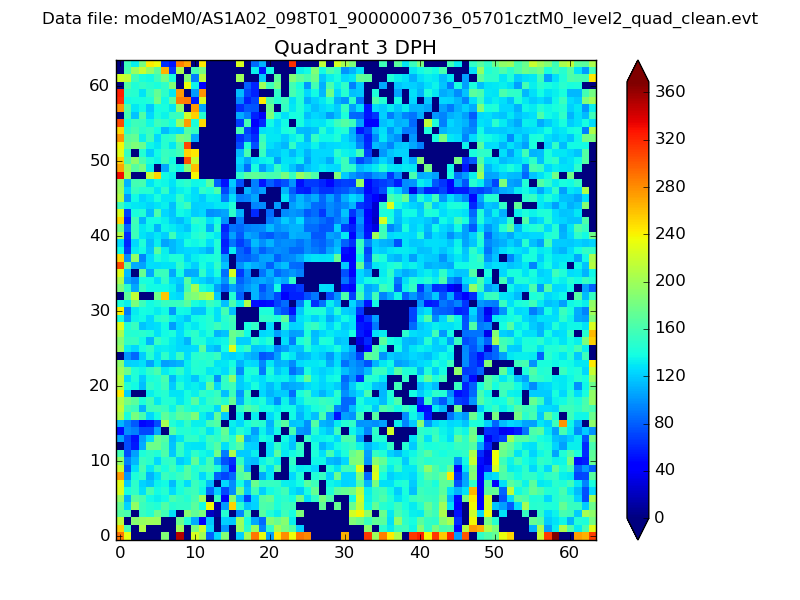 |
 |
Quadrant C |
| Plot type | Count rate plots | Images |
|---|---|---|
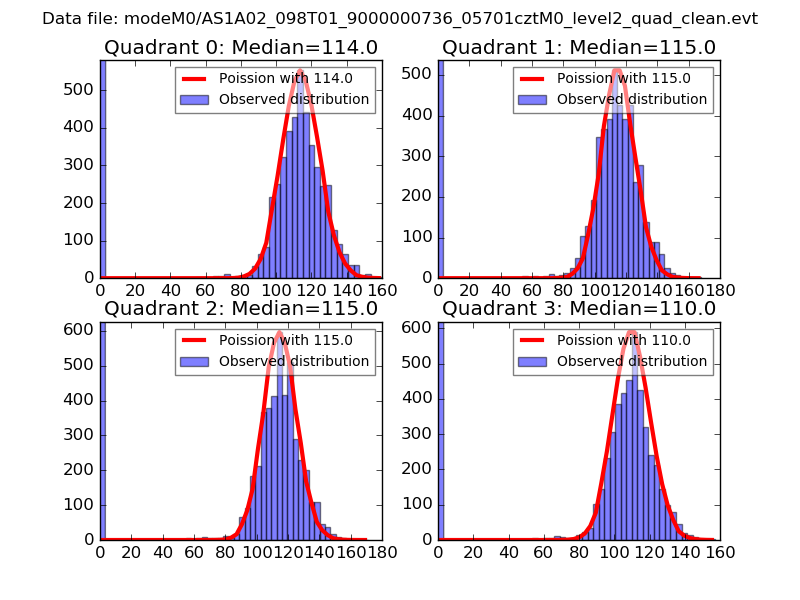
| Comparison with Poisson distribution Blue bars denote a histogram of data divided into 1 sec bins. Red curve is a Poisson curve with rate = median count rate of data. |
 |
 |
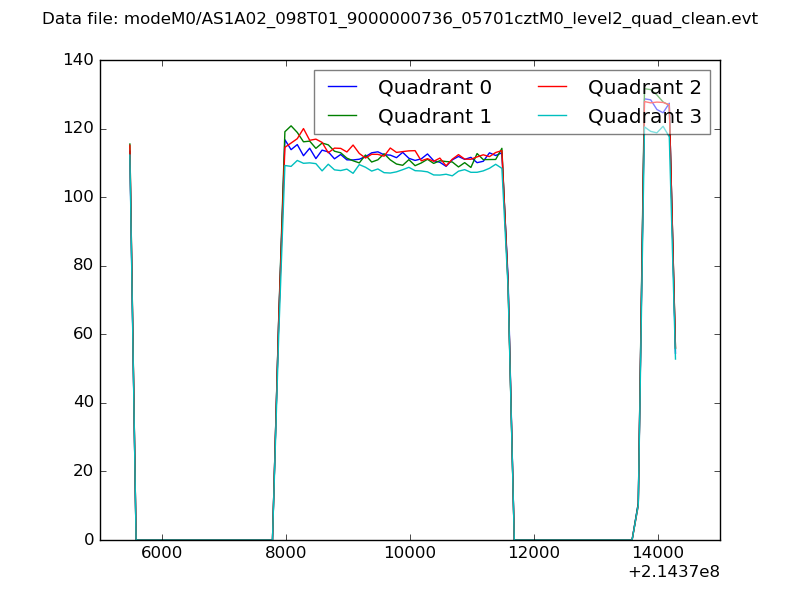
| Quadrant-wise count rates Data is divided into 100 sec bins |
 |
|
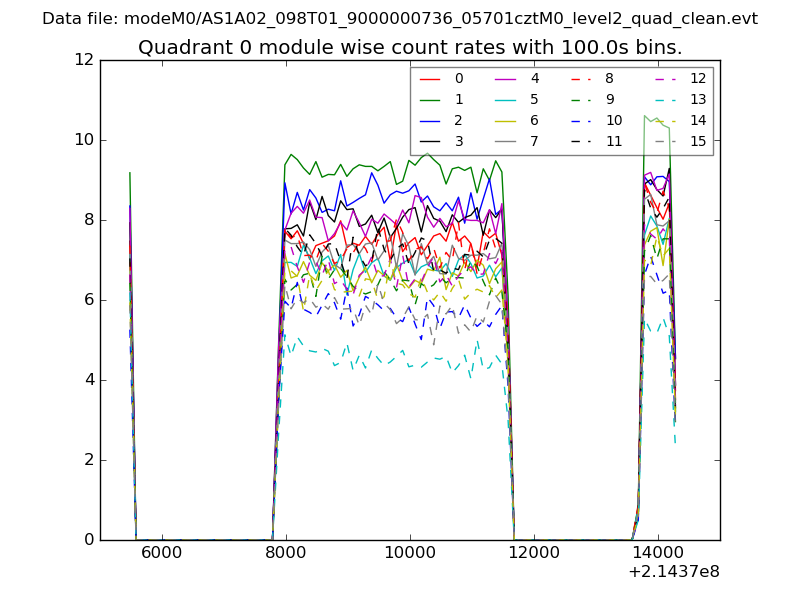
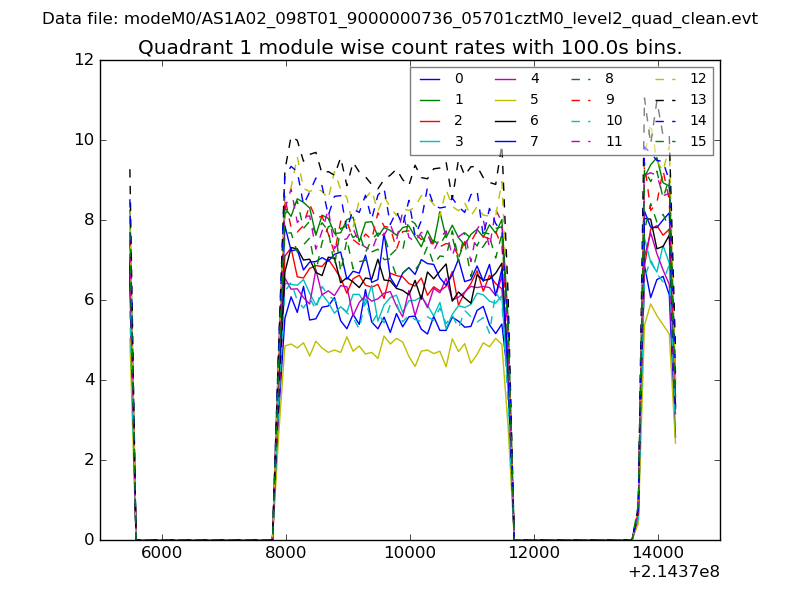
| Module-wise count rates for Quadrant A Data is divided into 100 sec bins |
 |
 |
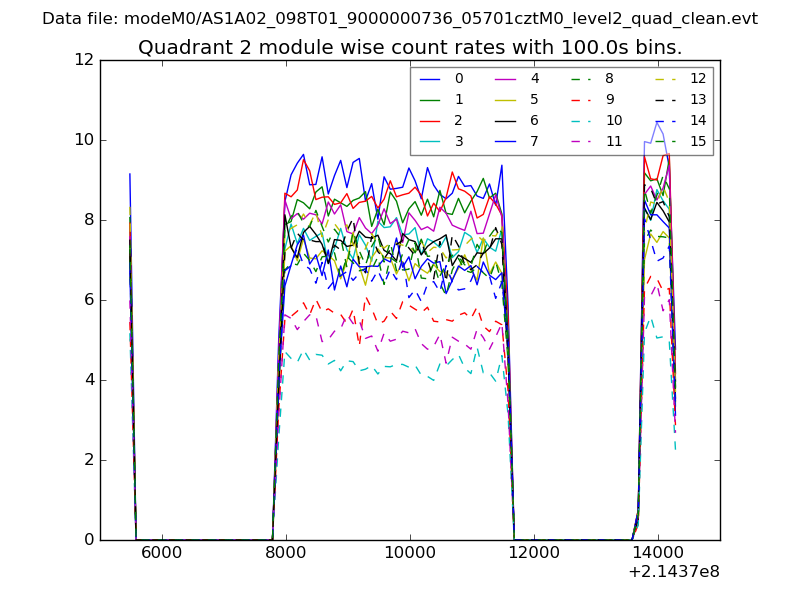
| Module-wise count rates for Quadrant B Data is divided into 100 sec bins |
 |
 |
| Module-wise count rates for Quadrant C Data is divided into 100 sec bins |
 |
 |
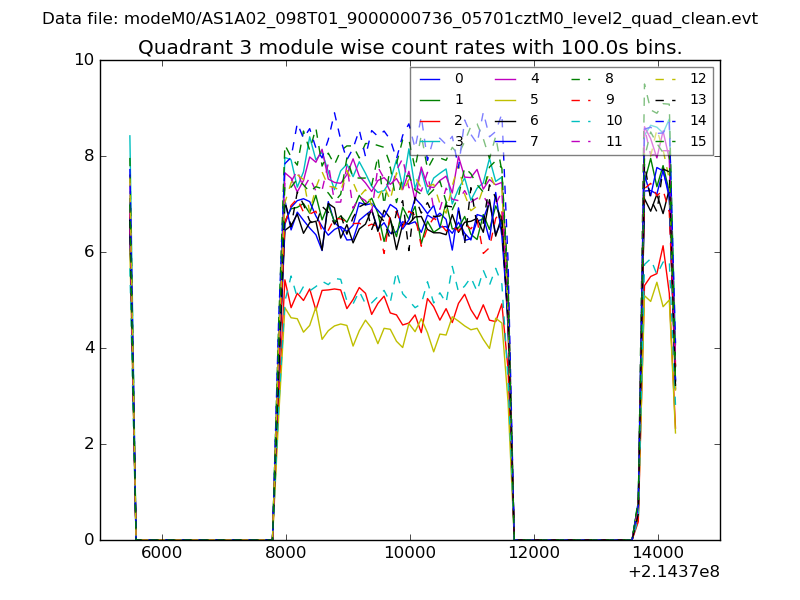
| Module-wise count rates for Quadrant D Data is divided into 100 sec bins |
 |
 |
| Parameter | Plot |
|---|---|
| CZT HV Monitor | 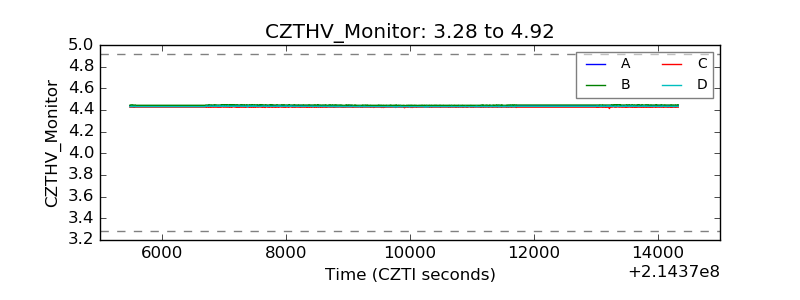 |
| D_VDD | 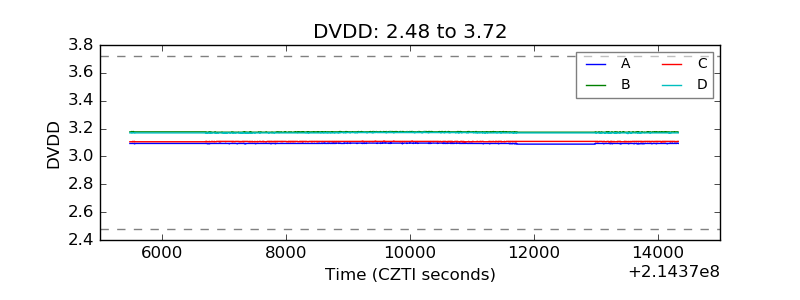 |
| Temperature 1 | 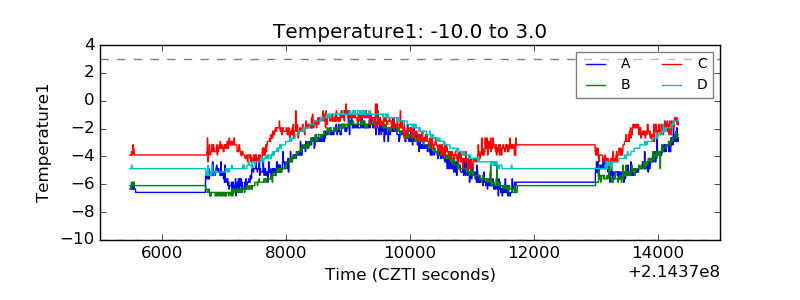 |
| Veto HV Monitor | 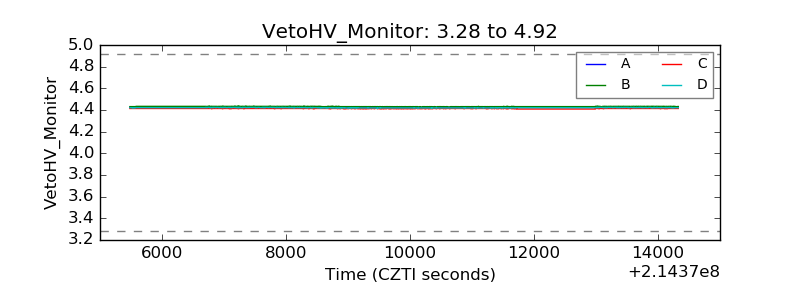 |
| Veto LLD | 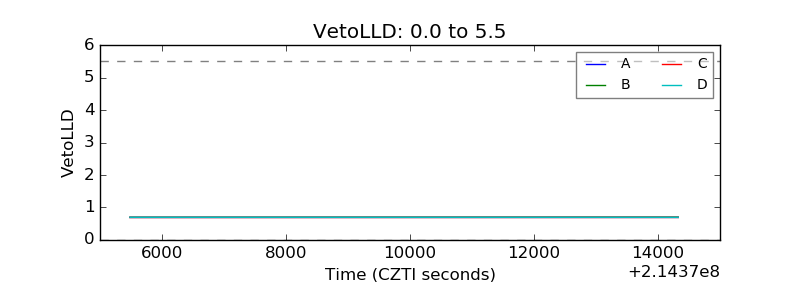 |
| Alpha Counter |  |
| _CPM_Rate | 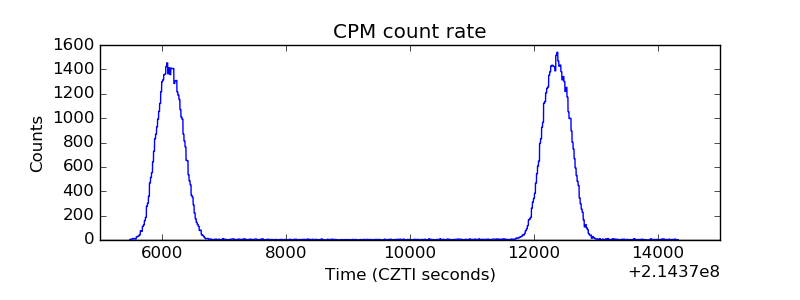 |
| CZT Counter |  |
| +2.5 Volts monitor | 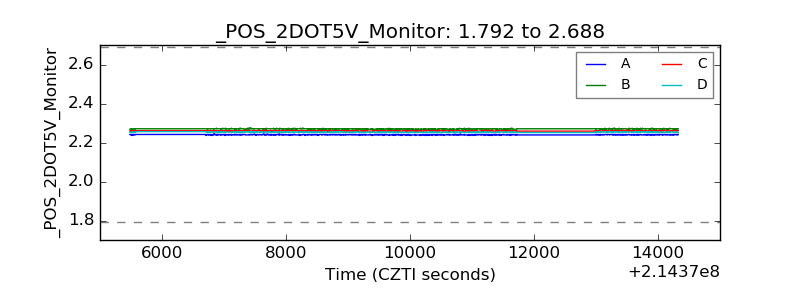 |
| +5 Volts monitor |  |
| _ROLL_ROT | 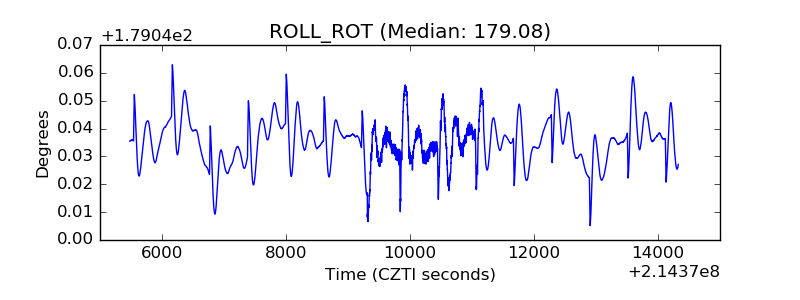 |
| _Roll_DEC | 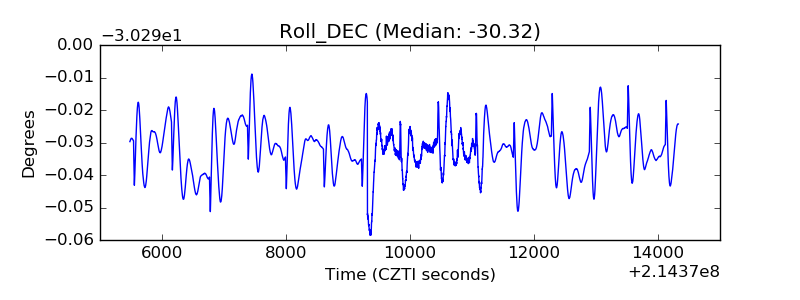 |
| _Roll_RA | 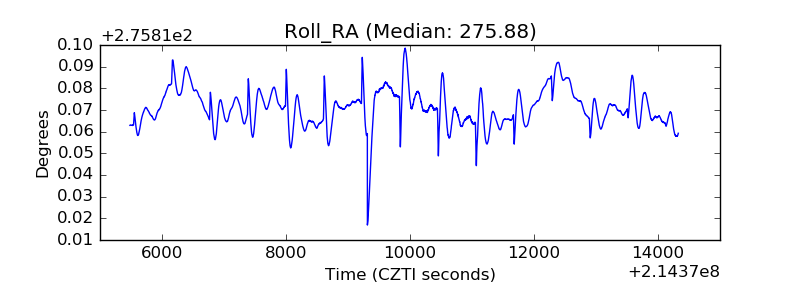 |
| Veto Counter | 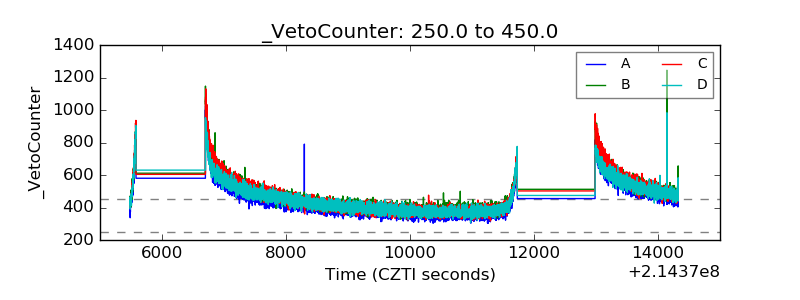 |