| Param | Original file | Final file |
|---|---|---|
| Filename | modeM0/AS1A02_098T01_9000000736_05703cztM0_level2.evt | modeM0/AS1A02_098T01_9000000736_05703cztM0_level2_quad_clean.evt |
| Size (bytes) | 465,984,000 | 93,974,400 |
| Size | 444.4 MB | 89.6 MB |
| Events in quadrant A | 3,170,443 | 607,938 |
| Events in quadrant B | 3,529,965 | 607,829 |
| Events in quadrant C | 3,190,886 | 604,612 |
| Events in quadrant D | 3,786,455 | 579,270 |
| Mode SS | |||
|---|---|---|---|
| Quadrant | BADHDUFLAG | Total packets | Discarded packets |
| A | 0 | 130 | 0 |
| B | 0 | 130 | 0 |
| C | 0 | 130 | 0 |
| D | 0 | 130 | 0 |
| Mode M0 | |||
|---|---|---|---|
| Quadrant | BADHDUFLAG | Total packets | Discarded packets |
| A | 0 | 13467 | 3 |
| B | 0 | 14432 | 2 |
| C | 0 | 13715 | 2 |
| D | 0 | 15456 | 2 |
| Mode M9 | |||
|---|---|---|---|
| Quadrant | BADHDUFLAG | Total packets | Discarded packets |
| A | 0 | 20 | 0 |
| B | 0 | 20 | 0 |
| C | 0 | 20 | 0 |
| D | 0 | 21 | 0 |
| Quadrant | Total seconds | Saturated seconds | Saturation percentage |
|---|---|---|---|
| A | 6397 | 120 | 1.875879% |
| B | 6397 | 108 | 1.688291% |
| C | 6397 | 83 | 1.297483% |
| D | 6397 | 140 | 2.188526% |
Noise dominated data is calculated using 1-second bins in cleaned event files. If a bin has >2000 counts, and if more than 50% of those come from <1% of pixels, then it is considered to be noise-dominated and hence unusable.
| Quadrant | # 1 sec bins | Bins with >0 counts | Bins with >2000 counts | High rate bins dominated by noise | Noise dominated (total time) | Noise dominated (detector-on time) | Marked lightcurve |
|---|---|---|---|---|---|---|---|
| A | 7657 | 6398 | 1 | 1 | 0.01% | 0.02% | 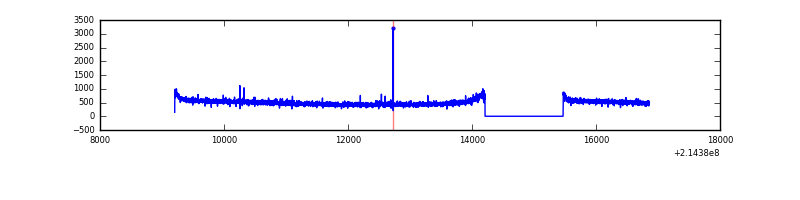 |
| B | 7657 | 6398 | 5 | 5 | 0.07% | 0.08% | 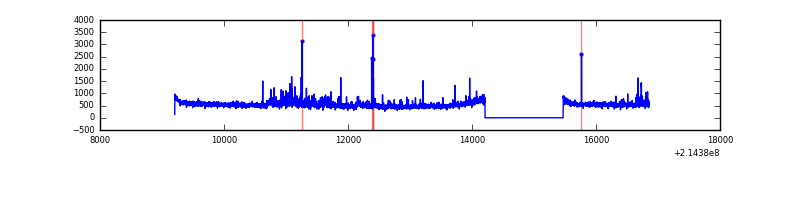 |
| C | 7657 | 6398 | 10 | 10 | 0.13% | 0.16% | 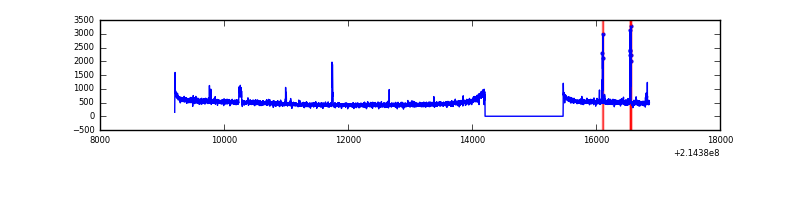 |
| D | 7657 | 6398 | 29 | 29 | 0.38% | 0.45% | 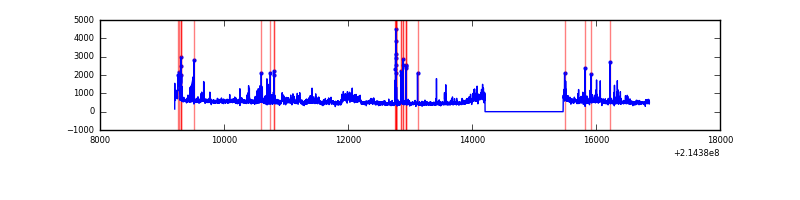 |
Top three noisy pixels from each quadrant. If the there are fewer than three noisy pixels in the level2.evt file, extra rows are filled as -1
| Pixel properties | Quadrant properties | ||||||
|---|---|---|---|---|---|---|---|
| Quadrant | DetID | PixID | Counts | Sigma | Mean | Median | Sigma |
| A | 0 | 31 | 9217 | 50.33 | 821 | 802 | 167.2 |
| A | 12 | 194 | 8155 | 43.97 | 821 | 802 | 167.2 |
| A | 0 | 226 | 8004 | 43.07 | 821 | 802 | 167.2 |
| B | 15 | 204 | 156042 | 1006.43 | 816 | 797 | 154.3 |
| B | 0 | 214 | 96996 | 623.64 | 816 | 797 | 154.3 |
| B | 0 | 219 | 36084 | 228.76 | 816 | 797 | 154.3 |
| C | 3 | 9 | 83556 | 461.07 | 784 | 789 | 179.5 |
| C | 1 | 241 | 24437 | 131.74 | 784 | 789 | 179.5 |
| C | 1 | 16 | 14228 | 74.86 | 784 | 789 | 179.5 |
| D | 2 | 152 | 276827 | 1436.27 | 793 | 771 | 192.2 |
| D | 8 | 195 | 266964 | 1384.96 | 793 | 771 | 192.2 |
| D | 12 | 233 | 59394 | 305.01 | 793 | 771 | 192.2 |
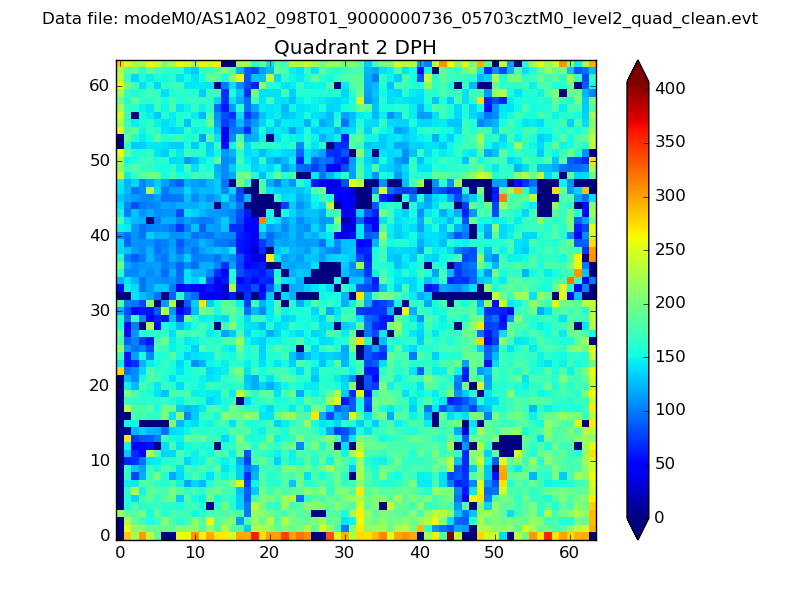
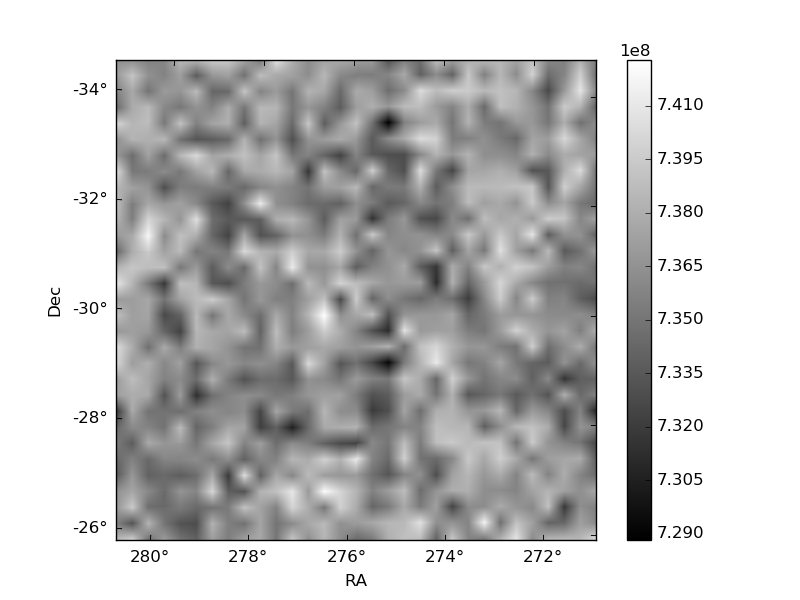
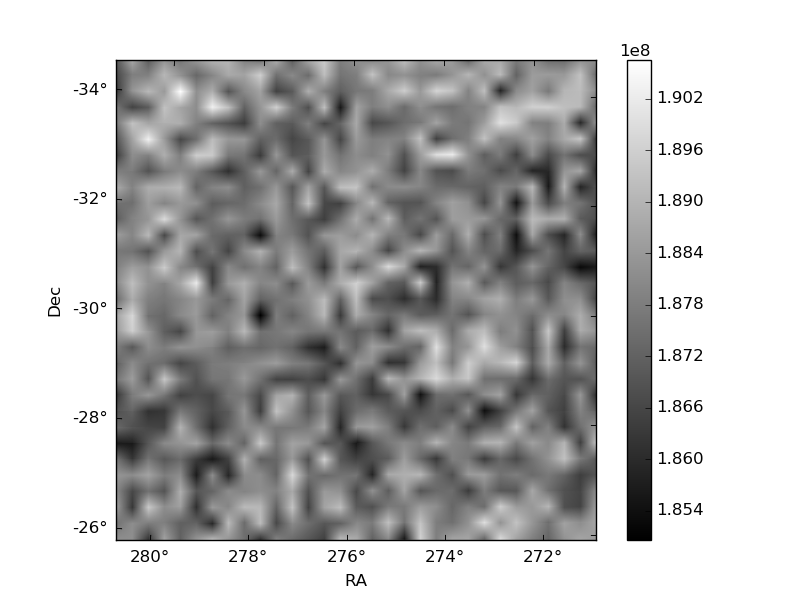
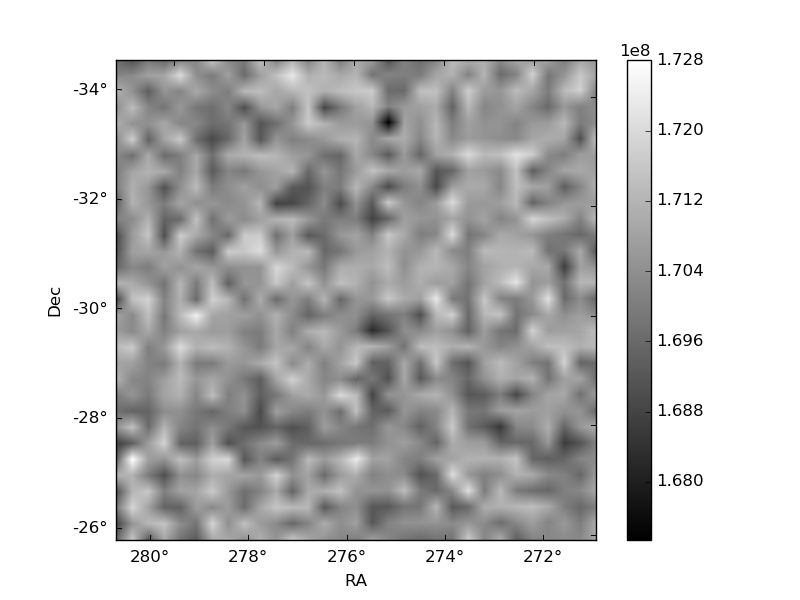
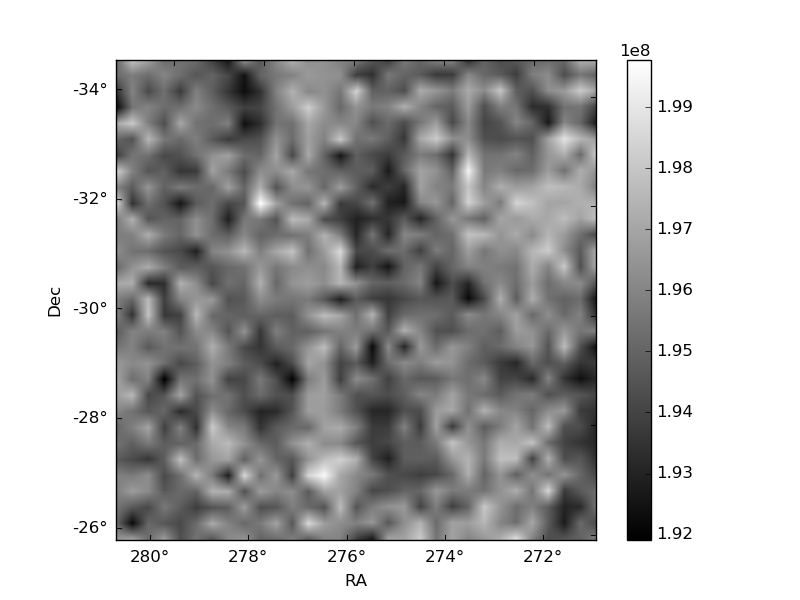
Histogram calculated using DETX and DETY for each event in the final _common_clean file
| Quadrant A | 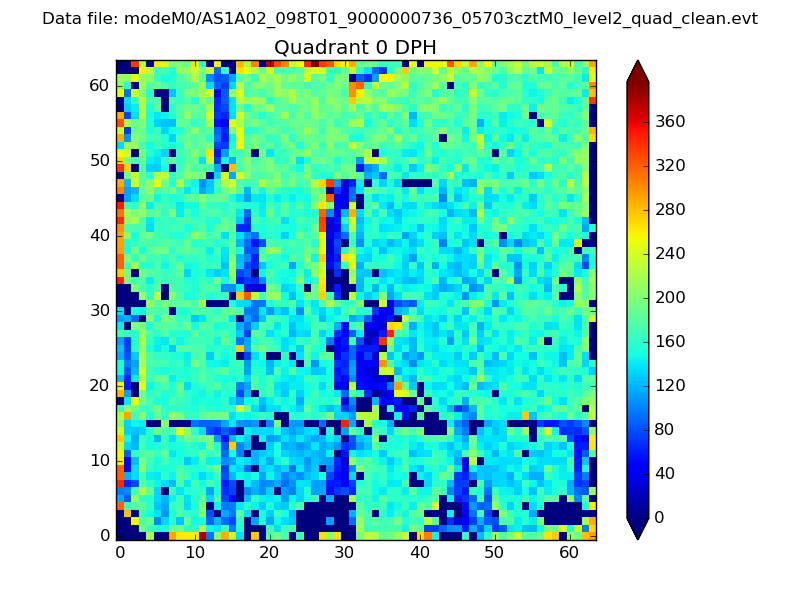 |
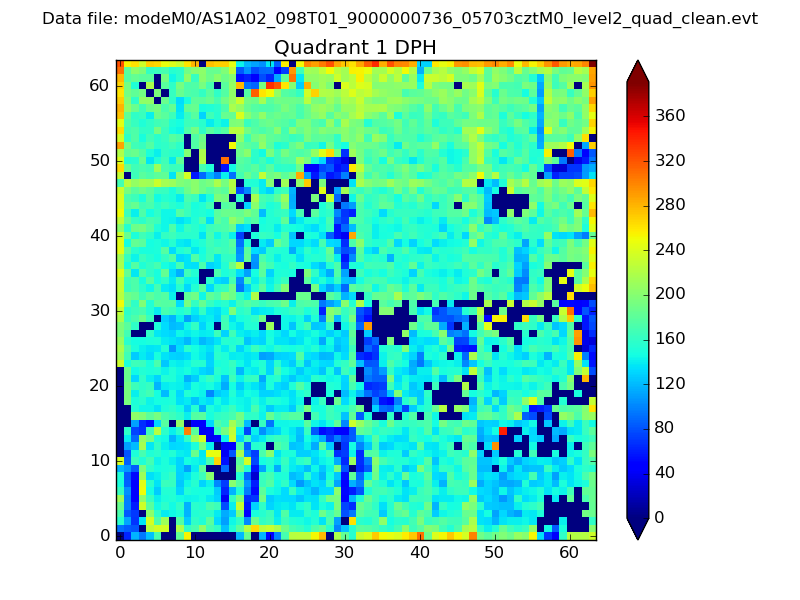 |
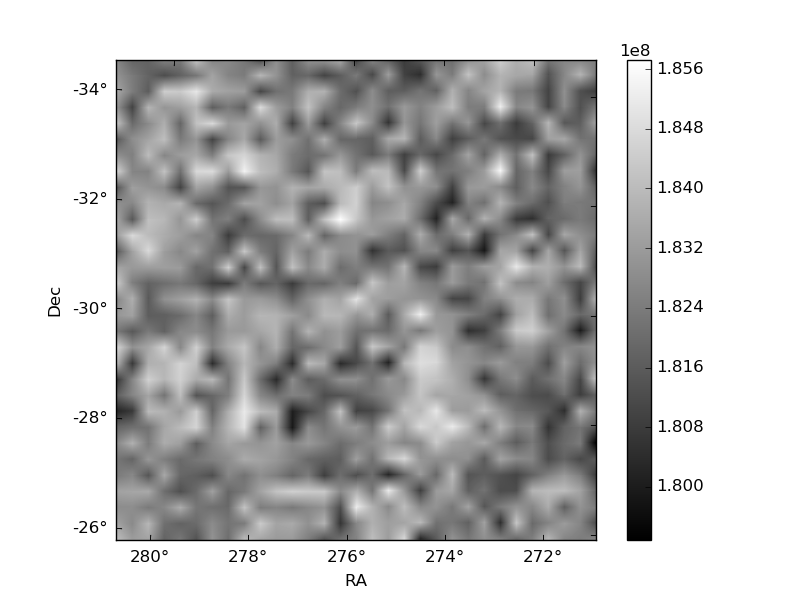
Quadrant B |
|---|---|---|---|
| Quadrant D | 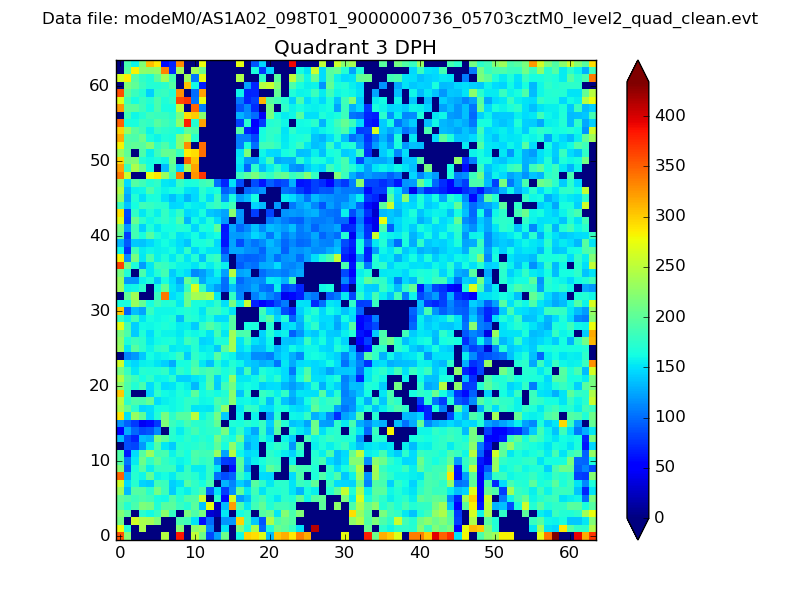 |
 |
Quadrant C |
| Plot type | Count rate plots | Images |
|---|---|---|
| Comparison with Poisson distribution Blue bars denote a histogram of data divided into 1 sec bins. Red curve is a Poisson curve with rate = median count rate of data. |
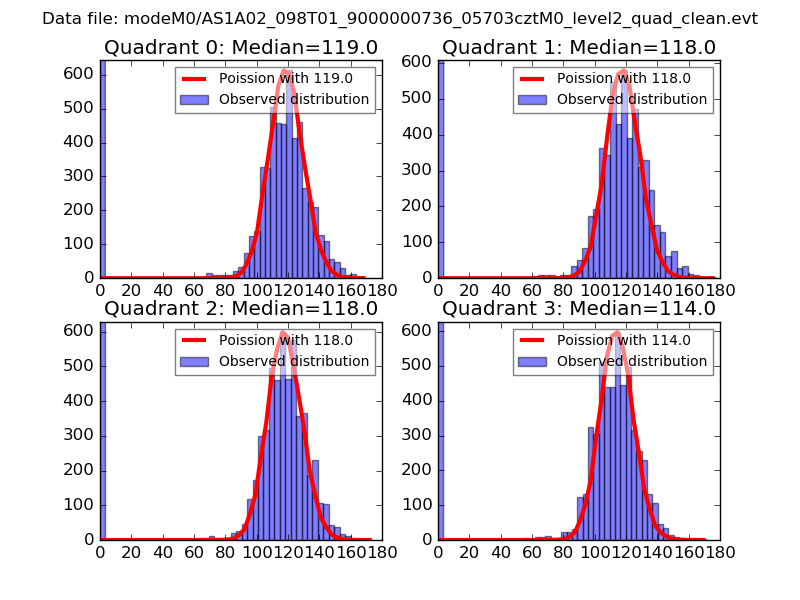 |
 |
| Quadrant-wise count rates Data is divided into 100 sec bins |
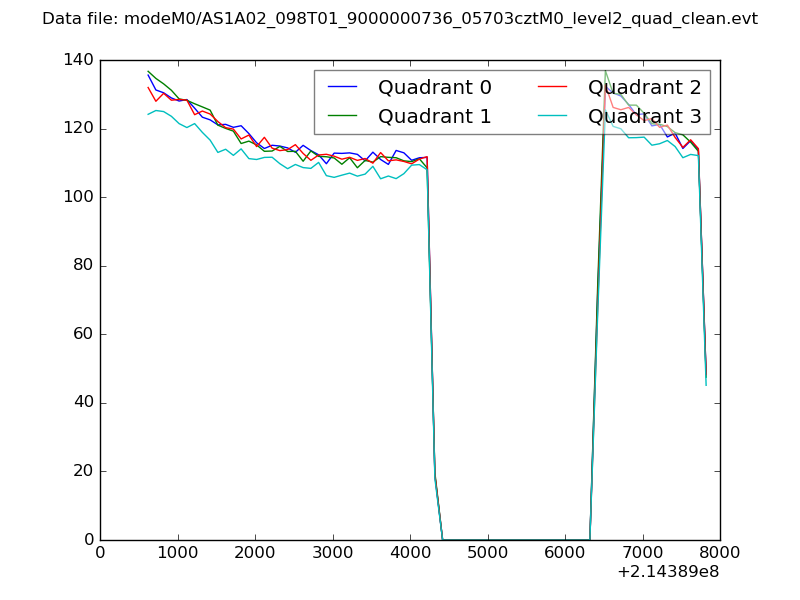 |
|
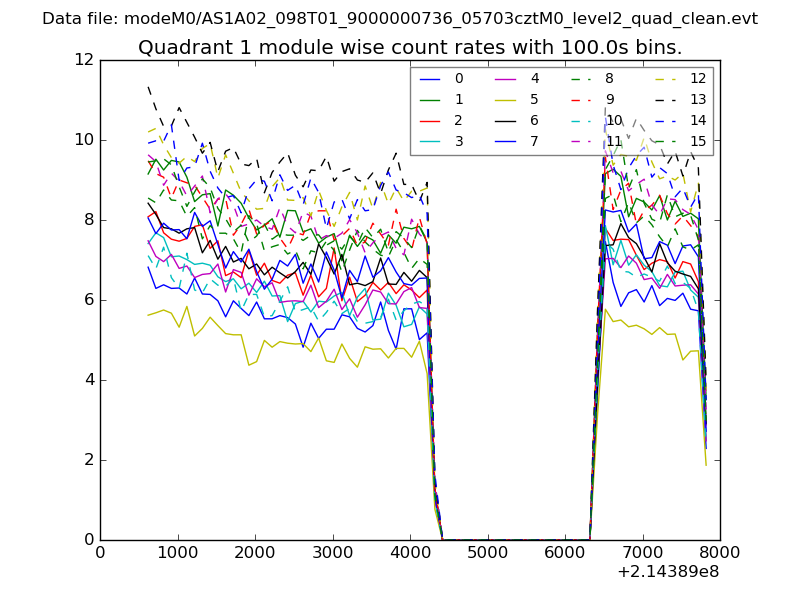
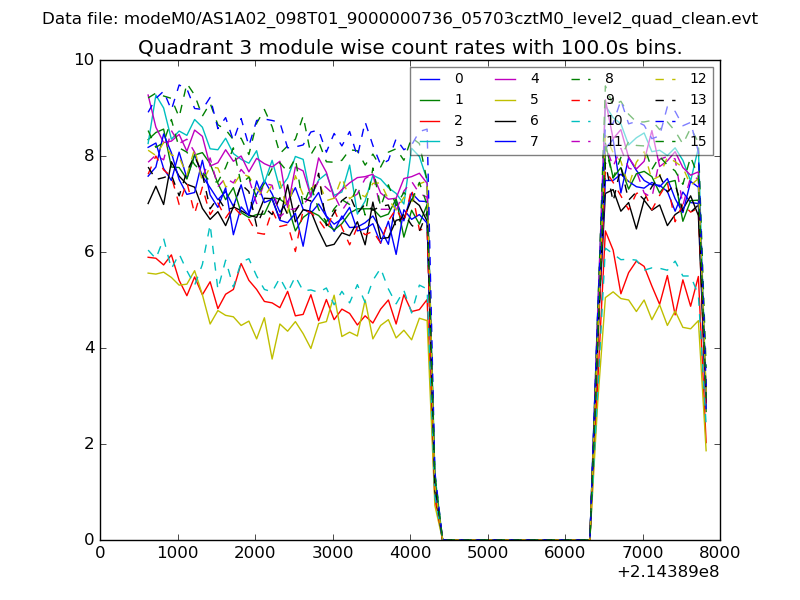
| Module-wise count rates for Quadrant A Data is divided into 100 sec bins |
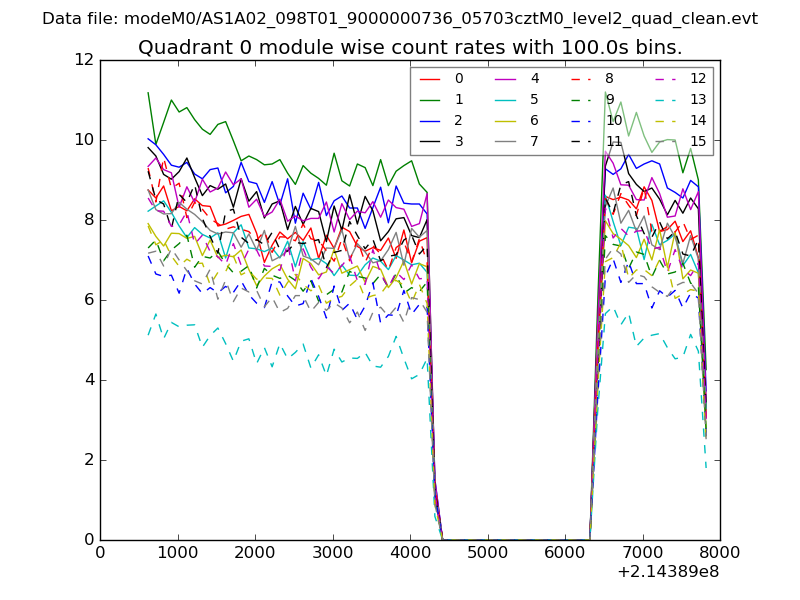 |
 |
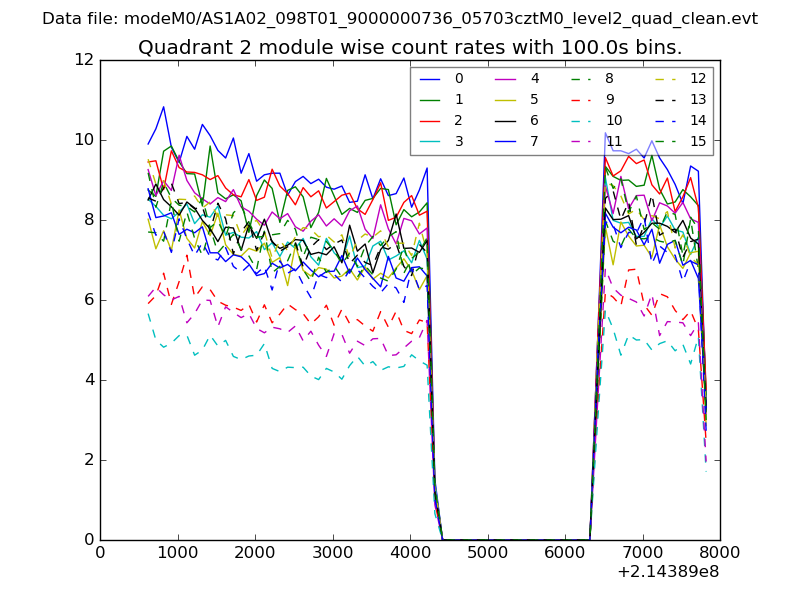
| Module-wise count rates for Quadrant B Data is divided into 100 sec bins |
 |
 |
| Module-wise count rates for Quadrant C Data is divided into 100 sec bins |
 |
 |
| Module-wise count rates for Quadrant D Data is divided into 100 sec bins |
 |
 |
| Parameter | Plot |
|---|---|
| CZT HV Monitor | 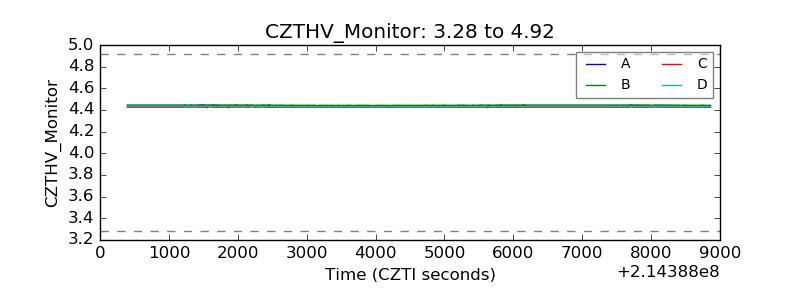 |
| D_VDD | 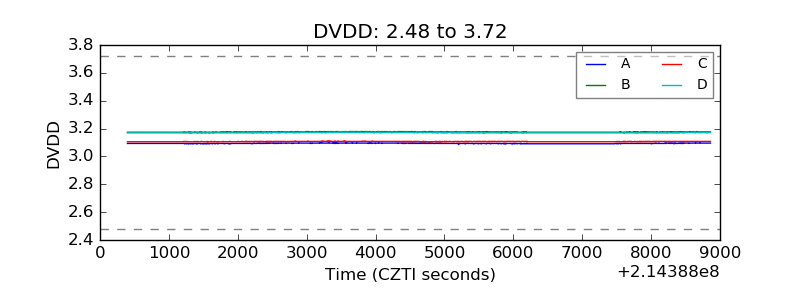 |
| Temperature 1 | 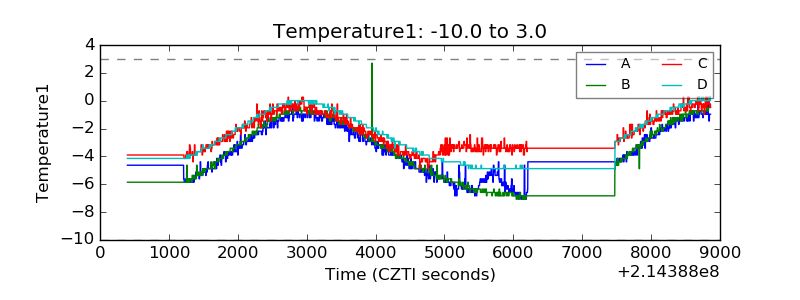 |
| Veto HV Monitor | 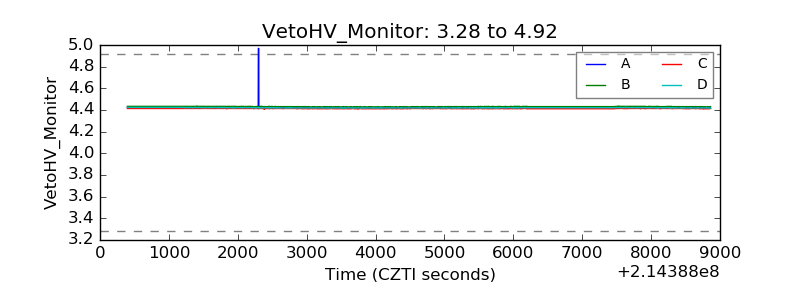 |
| Veto LLD | 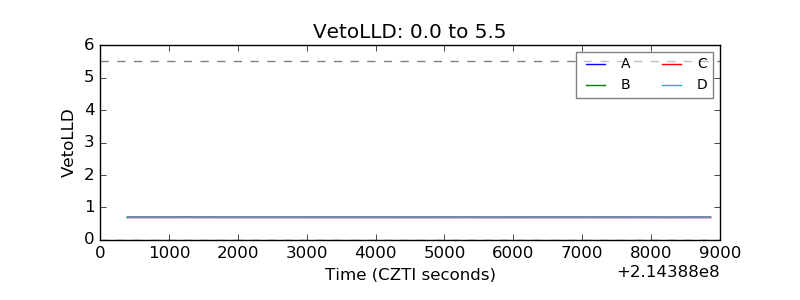 |
| Alpha Counter | 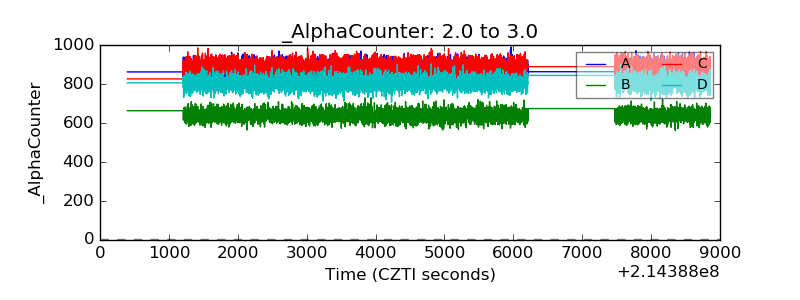 |
| _CPM_Rate | 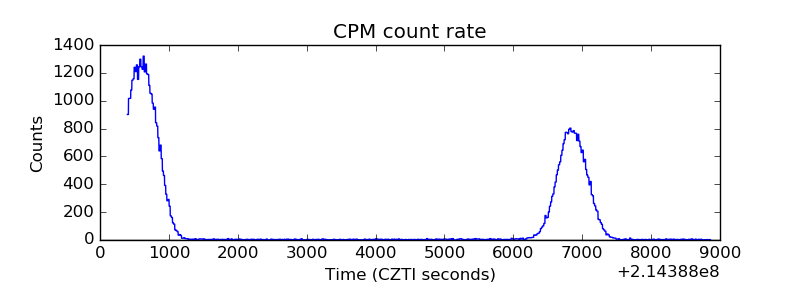 |
| CZT Counter | 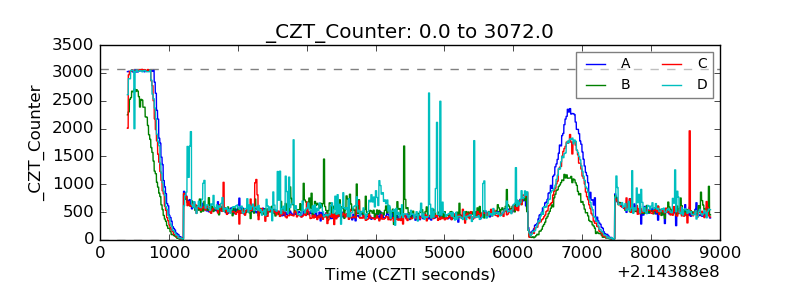 |
| +2.5 Volts monitor |  |
| +5 Volts monitor |  |
| _ROLL_ROT | 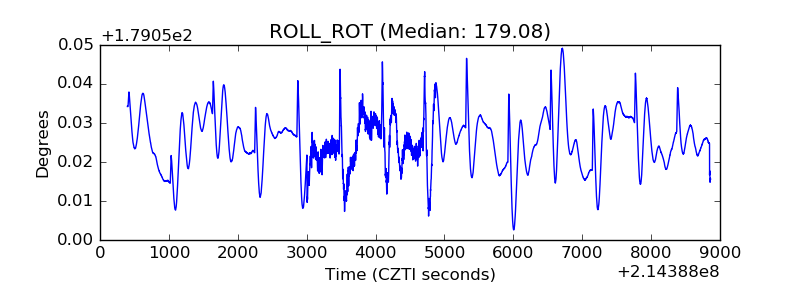 |
| _Roll_DEC | 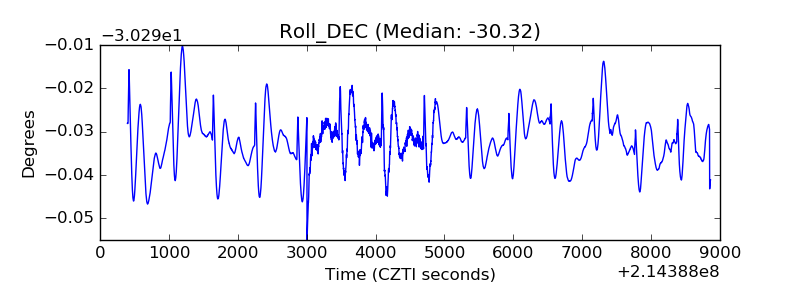 |
| _Roll_RA | 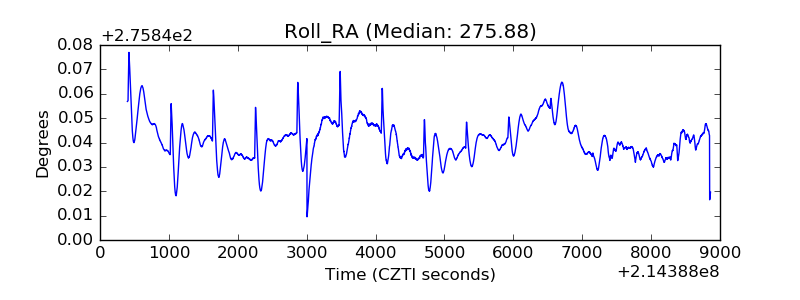 |
| Veto Counter | 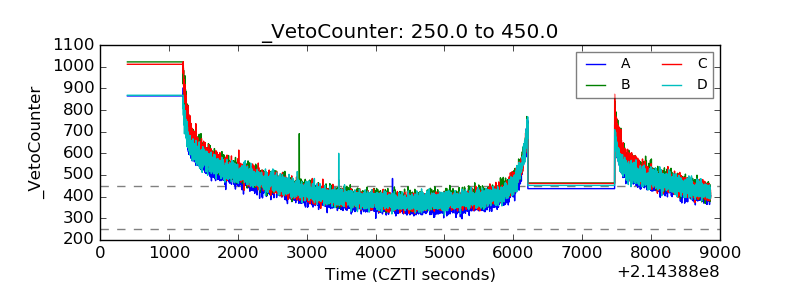 |